
Planting Wheat After Anhydrous
Every year in August and early September I get the question “How soon after applying NH3 can I sow wheat?”. Typically my answer has been a conservative one which takes into account rate, depth, spacing and soil moisture to end up with a range of 3 days to a week. The concern with anhydrous application is that when NH3 is placed in the soil it immediately turns into NH4 by striping H from H2O. This action releases OH into the soil in increases pH, depending on rate pH can reach 10.0 this hike in soil pH is a short term as the system disperrses and NH4 immediately begins the conversion to NO3 release H and driving down pH. The high pH in itself is not the problem but if the pH is still high and soil dries the OH will strip H from NH4 and NH3 is formed. The ammonia gas (NH3) is what can easily damage the sensitive seedling.
After fielding several calls in one day I wanted to dig a bit deeper and see what the science and specialist say. I was hoping for a nice consensus, haven’t found that yet. Here are some snip-its.

From Kansas State University
Dr. Dave Mengel
As a general rule, wait about 7 to 10 days between the anhydrous ammonia application and wheat planting. The higher the nitrogen rates and the wider the spacing (creating a higher concentration of ammonia in the band), the longer period of time you should wait. Also, in dry soils you may need to wait longer.
Canada Grains Council’s Complete Guide to Wheat Management Link
In the past, it was recommended that seeding be delayed for two days after banding anhydrous ammonia (NH3). However, in many soils as long as the NH3 is placed 5- 7.5 cm ( 2-3 inches) away from the seed, NH3 can be applied at the time of seeding. Seed damage from NH3 is most likely to occur under dry conditions on sandy soils when there is insufficient separation from the seed. Placement of fertilizer nitrogen should be deeper in sandy soils than in loams or heavy textured soils. Narrow band spacing 25 to 30 cm (10-12 in) is better than wider band spacing particularly under low moisture conditions.
From University on Minnesota
Peer reviewed publication
VARVEL: EFFECTS OF ANHYDROUS AMMONIA ON WHEAT AND BARLEY AGRONOMY JOURNAL, VOL. 74. NOVEMBER-DECEMBER 1982
Field experiments were conducted 1979-1981 on a Wheatville loam soil. The treatments consisted of three rates of N as anhydrous ammonia (45, 90, and 135 kg/ha) in 1979 and four rates of N (0, 45, 90, and 135 kg/ ha) in 1980-1981 at three depths (8,16, and 24 cm) in all combinations. Spring wheat and barley were then seeded at three different times. Seedling stand counts, grain yield, and protein were used to determine the effect of the treatments. Seedling stands were reduced in some cases, but no reduction in grain yield or protein was obtained due to the reduction in stand. The most important factor in spring anhydrous application was the depth of application, which caused greater moisture loss and seedbed disruption at the 24-cm application depth.
Spring wheat and barley response to N rates was similar at all depths of application (no significant interaction between N rate and application depth). The results indicate that anhydrous ammonia can be applied safely at planting time on spring wheat and barley, if applied at the 8 to 16 cm depth and at N rates currently used in the northern Great Plains.
From University on Minnesota (referring to corn) link
The only risk of planting soon after AA application is if seeds fall within the ammonia retention zone. To avoid seedling injury separation in time or space can be important. Under ideal soil moisture conditions and proper application depth of a typical agronomic rate normally there is little risk of seedling injury even if planted on top of the application zone right after AA application. That said, this can be risky and I would not recommend planting on top of the AA row. If you have RTK guidance it is very easy to apply AA between the future corn rows. If RTK guidance is not an option, I would recommend applying AA on an angle to the direction of planting to minimize the potential for planting on top of the AA band. If application conditions are less than ideal and you have no RTK guidance to ensure a safe distance from the AA band, then waiting 3 to 5 days before planting is typically enough time to reduce the risk of seedling injury.
From University on Wisconsin (referring to corn) Link
The depth of NH3 placement was the greatest factor in determined potential seedling damage. The time after application had little impact.
Iowa State University (referring to corn)
by Regis Voss, extension agronomist, Department of Agronomy
The wet fall and spring will cause anhydrous ammonia application and corn planting date to be close. This will lead to the oft asked question, “How long do I have to wait to plant corn after ammonia application?” If there is a soil separation between the ammonia zone and the seed, planting can be done the same day the ammonia is applied. If the seed is to be placed in the ammonia zone, the longer the waiting period the less potential for root injury. There is no magic number of days to wait.

WAKO NH3 applicator used for in-season application.
My take home from several hours of reading research articles and factsheets was my favorite answer IT DEPENDS. I believe Regis Voss with ISU had it right, there is no magic number. The important aspects for determining time will be 1) Soil Moisture 2) N rate 3) Depth and 4) shank spacing. From the reading I think there may be some general rules of thumb.
On the conservative side with good soil moisture, NH3 placed at 6″ deep, rate below 80 lbs and spacing of about 15″ the next day should be ok. As any one of these factors change (drier soil, higher rates, shallower application, wider rows) the more time should be added to reduce risk. One thing to consider is field variability. While the field on average may have great moisture there could be dry spots, while on average you are 6″ deep with the NH3 there are areas the rig is bound to rise up and go shallow. So there is always a chance for hot spots. All of that said I could not find any research on this topic for winter wheat in the southern Great Plains much less Oklahoma. I will always tend to the safe side and suggest if possible to delay sowing a few days after applying anhydrous. However if time is critical proceed with caution.
Looks like I can add one more project to my list and I need to find some open ground and do some “Experimenting”.
Happy Sowing All!
Now may not be the time for Replacement
For phosphorus (P) and potassium (K) fertilizer management there are three primary schools of thought when it comes to rate recommendations. The three approaches are Build-up, Maintenance/Replacement, and Sufficiency. There is a time and place for each one of the methods however the current markets are making the decision for the 2016-16 winter wheat crop a very easy one. The OSU factsheet PSS-2266 goes in-depth on each of these methods. For the rest of the blog I will use P in the conversation but in many scenarios K should/could be treated the same.
Build-up is when soil test is below a significant amount of fertilizer, about 7.5 lbs P2O5 per 1 ppm increase, is added so that soil test values increase. This method is only suggested when grain price is high and fertilizer is relatively cheap. Given the market, this is a no go. The two most commonly used methods of recommendation are Replacement and Sufficiency. In the replacement approach if the soil is at or below optimum P2O5 rate it based upon replacing what the crop will remove. The sufficiency approach uses response curves to determine the rate of P that will maximize yield. These two values are typically quite different. A good way you boil the two down is that replacement feeds the soil and sufficiency feeds the plant.
Oklahoma State Universities Soil, Water, and Forage Analytical Lab (SWFAL) provides recommendations utilizing sufficiency only while many private labs and consultants use replacement or a blended approach. Some of this is due to region. Throughout the corn belt many lease agreement contain clauses that the soil test values should not decrease otherwise the renter pays for replacement after the lease is over. For the corn belt both corn and soybean can be expected to remove 80 to 100 pounds of P per year. Conversely the Oklahoma state average wheat crop removes 17 lbs P a year. In areas where wheat yields are below 40 bushel per acre (bpa) using the sufficiency approach for P recs can increase soil test P over time.

This conceptual soil test response curve is divided into categories that correspond with below opti-mum, optimum and above optimum soil test values. The critical level is the soil test level, below which a crop response to a nutrient application may be expected, and above which no crop response is expected. At very high soil test levels crop yield may decrease.
*Rutgers Cooperative Extension Service FS719
Back to subject of this blog, consultants, agronomist, and producers need to take a good look at the way P recs are being made this year. Profitability and staying in the black is the number 1, 2, and 3 topic being discussed right now. The simple fact is there is no economic benefit to apply rate above crop need, regardless of yield level. The figures above demonstrate both the yield response to fertilizer based upon soil test. At the point of Critical level crop response / increase in yield is zero. What should also be understood is that in the replacement approach P fertilizer is still added even when soil test is in Optimum level. This also referred to as maintenance, or maintaining the current level of fertility by replacing removal. If your program is a replacement program this is not a recommendation to drop it completely. Over a period of time of high removal soil test P levels can and will be drawn down. But one year or even two years of fertilizing 100 bpa wheat based on sufficiency will not drop soil test levels. On average soils contain between 400 and 6000 pounds of total phosphorus which in the soil in three over arching forms plant available, labile, and fixed. Plant available is well plant available and fixed is non plant available. The labile form is intermediate form of P. When P is labile it can be easily converted to plant available or fixed. When a plant takes up P the system will convert labile P into available P. When we apply P fertilizer the greatest majority of was is applied makes it to the labile and fixed forms in a relatively short period of time. For more in-depth information on P in the soil you can visit the SOIL 4234 Soil Fertility course and watch recorded lectures Fall 2015 10 26-30 Link .
How to tell if your P recs have a replacement factor, not including calling your agronomist. First replacement recs are based on yield goal, so if you change your yield goal your rate will change. The other and easier way is to compare your rates to the table below. Most of the regional Land Grant Universities have very similar sufficiency recs for wheat. Another aspect of the sufficiency approach is the percent sufficiency value itself. The sufficiency can provide one more layer in the decision making process for those who are near the critical or 100% level. Response and likelihood of response to P is not equal. At the lowest levels the likelihood of response is very high and the yield increase per unit of fertilizer is the greatest. As soil test values near critical (32.5 ppm or 65 STP) the likelihood of response and amount of yield increase due to fertilizer P decreases significantly. At a STP of 10 the crop will only produce 70% of its environmental potential if P is not added while at a STP of 40 the crop will make 90% of its potential. The combination of % sufficiency and yield goal can be used to determine economic value of added P.

*From Oklahoma State University Soil Test Interpretations. Fact Sheet PSS-2225
*Based on Mehlich 3
*PPM (parts per million) is used by most labs
*STP (soil test P) is a conversion used by some Universities. Equivalent to pounds per acre.
* for a 0-6” in soil sample PPM * 2 = STP.
This data is available from OSU in multiple forms from the Factsheet PSS-2225, the SWFAL website, Pete Sheets quick cards, and the Field Guide App.

This year with margins tight soil testing is more important than ever before. Knowing the likelihood of response and appropriate amount of fertilizer to apply will be critical maximizing the return on fertilizer invest while maximizing the quality and amount of grain we can produce. Visit with your consultant or agronomist to discuss what the best approach is for your operation. Lets ride this market out, get the most out of every input and come out of this down cycle strong.
Feel free to contact me with any questions you may have.
Brian
b.arnall@okstate.edu
Soil calcium and magnesium levels: Does the ratio make a difference?
Guest Author
Dorivar Ruiz-Diaz,
Nutrient Management Specialist
Kansas State University
Is it important to have the proper ratio of calcium (Ca) and magnesium (Mg) in the soil? Producers may ask this question as they have their soil tested for nutrient levels in the summer before wheat planting begins. This question may also arise at the moment of lime purchase, which can be an important source of Ca and Mg.
Calcium and Mg are plant-essential nutrients. All soils contain Ca and Mg in the form of cations (positively charged ions, Ca++ and Mg++) that attach to the soil clay and organic matter; these are also the forms taken up by crops. The relative proportion of these elements, as well as the total amount in the soil, depends mainly on the soil parent material. In Kansas soils, the levels of Ca and Mg are typically high and crop deficiencies are rare.
Soils typically have higher Ca levels than Mg. Table 1 gives the amount and ratios of Ca and Mg for some soils in Kansas. Both nutrients are present in large quantities. Unusual cases of Ca or Mg deficiencies may be found in areas of very sandy soils.
| Table 1. Calcium, magnesium, and Ca:Mg ratio for several Kansas soils | |||
| Ca | Mg | Ca:Mg ratio | |
| Soil | cmol/kg | ||
| Canadian-Waldeck | 42 | 11 | 3.7 |
| Carwile | 22 | 4 | 5.2 |
| Chase | 198 | 30 | 6.7 |
| Crete | 111 | 29 | 3.8 |
| Harney | 202 | 15 | 13.2 |
| Harney-Uly | 200 | 12 | 16.1 |
| Keith | 127 | 38 | 3.3 |
| Las | 176 | 37 | 4.8 |
| McCook | 35 | 8 | 4.5 |
| Onawa | 163 | 28 | 5.8 |
| Ortello | 19 | 6 | 3.3 |
| Parsons | 80 | 23 | 3.5 |
| Tully | 158 | 38 | 4.2 |
Why would the ratio of Ca to Mg be important? The concept of an optimum Ca:Mg ratio started in the 1940s under the “basic cation saturation ratio” theory. The theory is that an “ideal soil” will have a balanced ratio of Ca, Mg, and potassium (K). According to this theory, fertilization should be based on the soil’s needs rather than crop’s needs — focusing on the ratio of crop nutrients present in the soil. This concept of an ideal Ca:Mg ratio has been debated by agronomists over the years. The suggested ideal ratio according to the theory is between 3.5 and 6.0, but this has never proven to be of significance.
There is very little research evidence to support any effect, either positive or negative, of the soil Ca:Mg ratio on crop production and yield. What research studies have been conducted in the laboratory and in the field show no effect of Ca:Mg ratio on crop yield. Despite this, the promotion of the ratio concept persists today. Furthermore, the initial work that derived this concept did not differentiate between crop response (alfalfa) due to the change in Ca:Mg ratio and the improvement in soil pH from lime application. It is reasonable to conclude that crop response can be expected from changes in soil pH rather than any change in the ratio of Ca:Mg.
One example of research conducted on this topic over the years is shown in Table 2. In that experiment, McLean and coworkers demonstrated the lack of relationship between Ca:Mg ratio and crop yield for several crops. The range of Ca:Mg ratios observed for the highest yields were not different from those observed for the lowest yields. The conclusion from that study was that to achieve maximum crop yield, attention should center on providing sufficient levels of these nutrients rather than attempting to find an adequate ratio. Therefore when these nutrients are present in optimum levels for plant growth, the relative ratio in the soil seems irrelevant.
| Table 2. Ratio of Ca:Mg for five crop-years comparing the highest and lowest yields obtained | ||||||
| Corn | Corn | Soybean | Wheat | Alfalfa | Alfalfa | |
| Yield level | Ca;Mg ratio | |||||
| Highest five | 5.7 – 26.8 | 5.7 – 14.2 | 5.7 – 24.9 | 5.7 – 14.0 | 5.7 – 26.8 | 6.8 – 26.8 |
| Lowest five | 5.8 – 21.5 | 5.0 – 16.1 | 2.3 – 16.1 | 6.8 – 21.5 | 8.2 – 21.5 | 5.7 – 21.5 |
Adapted from: McLean, E.O., R.C. Hartwig, D.J. Eckert, and G.B. Triplett. 1983. Basic cation saturation ratios as a basis for fertilizing and liming agronomic crops. II. Field studies. Agronomy Journal 75: 635-639.Ada – 21.veeio of Ca:Mg for five crop-years comparing the highest and lowest yields obtainedto the diseaseeo produced by Dan Don
In conclusion, trying to manage the ratio of Ca:Mg should not be used for a nutrient application or liming program. The center of attention should be to ensure that levels of Ca and Mg in the soil will not limit optimum plant growth. The relative concentration of Ca and Mg in commercial ag lime can be highly variable, and application should be based on the effective calcium carbonate (ECC) to achieve a target soil pH.
Dorivar Ruiz-Diaz, Nutrient Management Specialist
Kansas State University
ruizdiaz@ksu.edu
NDVI, Its not all the same.
With the most recent FAA UAV announcement my phone has been ringing with excited potential UAV users. Two points always comes up in the conversation. NDVI (normalized difference vegetation index) and image resolution. This blog will address the use of NDVI, resolution will come later. Before getting into the discussion, what NDVI is should be addressed. As described by Wikipedia, NDVI is a simple graphical indicator that can be used to analyze remote sensing measurements, typically but not necessarily from a space platform, and access whether the target being observed contains live green vegetation or not. NDVI is a mathematical function of the reflectance values of two wavelengths regions, near-infrared (NIR) and visable (commonly red).

Calculation for NDVI. Any visible wavelegnth can be substituted for the red wavelength.
The index NDVI has been tied to a great number of crop factors, the most important being biomass. Biomass being important as most things in the plant world impact biomass and biomass is related to yield. The most challenging issue with NDVI is it is highly correlated with biomass and a plants biomass is impacted by EVERYTHING!!!! Think about it, how many things can impact how a plant grows in a field.

Image showing the impact of nitrogen on a potted plants spectral reflectance pattern. The yellow line has 0 Nitrogen and the orange line had 100 lbs. The higher the line the more that wavelength is reflected. Note Photosynthetic wavelength are absorbed more (reflected less) when the plant is bigger but the NIR (right side) is absorbed less by the healthier plants.

The kicker that most do not know is that all NDVI’s values are not created equal. The source of the reflectance makes a big difference.
Measuring reflectance requires a light source, this is where the two forms of NDVI separate. Passive sensors measure reflectance using the sun (natural light) as a light source while active sensors measure the reflectance from a known light source (artificial light). The GreenSeeker is a good example of a active sensor, it emits its own light using LEDs in the sensor while satellite imagery is the classic passive sensor.

Picture representation of satellite remote sensing. http://www.crisp.nus.edu.sg/~research/tutorial/optical.htm

Graphic of how a active sensor emits light and detects light.
The challenge with passive remote sensing lies within the source of the light. Solar radiation and the amount of reflectance is impacted by atmospheric condition and sun angle to name a few things. That means without constant calibration, typically achieved through white plate measurements, the values are not consistent over time and space. This is the case whether the sensor is on a satellite or held held. In my research plots where I am collecting passive sensor data, so that I can measure all wavelength, I have found it necessary to collected a white plate calibration reading every 10 to 15 minutes of sensing. This is the only way I can remove the impacts of sun angle and cloud cover. When using the active sensors as long as the crop does not change the value is calibrated and repeatable.
What does this mean for those wanting to use NDVI collected from a passive sensor (satellite, plane, or UAV)? Not much if the user wants to distinguish or identify high biomass and low biomass areas. Passive NDVI is a great relative measurement for good and bad. However many who look at the measurements over time notice the values can change significantly from one day to the next. The best example I have for passive NDVI is a yield map with no legend. Even the magnitude of change between high and low is difficult to determine.

Passive un-calibrated NDVI is a relative value. Providing relative highs and lows.
Passive NDVI in the hands of an agronomist or crop scout can be a great tool to identify zones of productivity. It becomes more complicated when decisions are made solely upon these values. One issue is this is a measure of plant biomass. It does nothing to tell us why the biomass production is different from one area to the next. That is why even with an active sensor OSU utilizes N-Rich Strips (N-Rich Strip Blog). The N-Rich Strip tells us if the difference is due to nitrogen or some other variable. We are also looking into utilizing P, K, and lime strips throughout fields. Again a good agronomist can utilize the passive NDVI data by directing sampling of the high and low biomass areas to identify the underling issues creating the differences.
OkState has been approached by many UAV companies to incorporate our nitrogen rate recommendation into their systems. This is an even greater challenge. Our sensor based nitrogen rate calculator (SBNRC blog) utilizes NDVI to predict yield based upon a model built over that last 20 years. That means to correctly work the NDVI must be calibrated and accurate to a minimum of 0.05 level (NDVI runs from 0.0 to 1.0). To date none have been able to provide a mechanism in which the NDVI could be calibrated well enough.
Take Home
NDVI values collected with a passive sensor, regardless of the platform the sensor is on, has agronomic value. However its value is limited if the user is trying to make recommendations. As with any technology, to use NDVI you should have a goal in mind. It may be to identify zones or to make recommendations. Know the limitations of the technology, they all have limitations, and use the information accordingly.

2015-16 Wheat Crop Nitrogen Review
From trials to phone calls (and text messages, and tweets, and ect. ect) I have gathered a fairly good picture of this years winter wheat nitrogen story. And as normal, nothing was normal. Overall I seen/heard three distinct trends 1) Did not take much to make a lot 2) took a ton to make a lot 3) saw a response (N-rich strip or cow-pow) but fertilizer never kicked in. Covers most of the options, doesn’t it.

The N-rich strips really came out over all very good this year. N-Rich Strip Blog. On average many of those using the N-Rich Strip and SBNRC (SBNRC Blog) producers have been getting in the neighborhood of 1.0-1.3 lbs of N applied per bushel produced. This year the numbers ran from 0.66 to 2.3 lbs of N per bushel. In both extremes I believe it can be explained via the field history and the N-Cycle.

Nitrogen Cycle Pete’s Sheet
In at least two fields, documented with calibrated yield monitors, the N-Rich Strip and SBNRC lead to massive yields on limited N. One quarter of IBA bumped 86 bpa average on 47 lbs of N while a second quarter, also IBA, managed 94 bpa average on about 52 units of N. We are currently running grain samples from these fields to look protein levels.
The other side of the boat were those with N-Rich strip calling for +2.0 lbs N per bushel. I had received notes from producers without N-rich strips saying that they could predict yield based on the amount of N applied and it was a 2 to 1 ratio. Not always but many of these high N demand fields where wheat following a summer or double crop or corn or sorghum. While many of the low N demand fields were wheat after wheat or wheat after canola. In a rotational study that had been first implemented in the 2014-15 crop year I saw big differences due to previous crop. The picture below was taken in early March. The straw residue in wheat after wheat had just sucked up the nitrogen. While it was evident the residue from the canola broke down at a much more rapid pace releasing any and all residual nutrients early.

The yield differences were striking. The canola rotation benefited the un-fertilized plots by 22 bpa and even with 90 lbs of N applied having canola in the rotation increased yields by 12 bpa. We are looking and grain quality and residual soil sample now. I am sure there will be a more indepth blog to follow.

Canola Wheat Rotation study year two yield average. yields average across previous years N-rates.
Another BIG story from the 2015-16 wheat crop was the lack of benefit from any N applied pre-plant. It really took top-dress N this year to make a crop. Due to our wet early fall and prolong cold winter N applied pre was either lost or tied up late. Work by Dr. Ruans Soil Fertility Program really documented the lack luster pre-plant N effect. The figure below shows 4 location of a rate by timing student. The number at the bottom of each graph is a rate by time (30/0 means 30 lbs Pre-0 lbs Top, 60/30 means 60 lbs Pre-30 lbs Top). At every single location 0/60 beat 60/0. Top-dress N was better than Pre-plant N.

Figure 1. Work from Ethan Driver and Dr. Bill Raun. Study looked at rate and timing of N fertilization in wheat. Treatments are ordered by total N applied.
The last observation was lack of response from applied N even though the crop was deficient. Seen this in both the NE and NW corners. I would hazard with most of the circumstance it was due to a tie up of applied N by the previous crops residue. The length at which the winter stretched into spring residue break down was also delayed.
Take Home
Here it is folks APPLY NITROGEN RICH STRIPS. Just do it, 18 years of research preformed in Oklahoma on winter wheat says it works. Hold off on heavy pre-plant N even if anhydrous is cheap. It does matter how cheap it is if it doesn’t make it to the crop. Will we see another year like 2015-16, do not know and not willing to place money on either side. What we do know is in Oklahoma split applying nitrogen allows you to take weather into account and the N-Rich strip pays dividends.
There are several fact sheets available on top-dressing N and the application of N-Rich strips. Contact your local Oklahoma Cooperative Extension Service county educator to get a copy and see if they have a GreenSeeker sensor on hand.
DAP vs MAP, Source may matter!
Historically the two primary sources of phosphorus have had different homes in Oklahoma. In general terms MAP (11-52-0) sales was focused in Panhandle and south west, while DAP (18-46-0) dominated the central plains. Now I see the availability of MAP is increasing in central Oklahoma. For many this is great, with MAP more P can be applied with less material. which can over all reduce the cost per acre. There is a significant amount of good research that documents that source of phosphorus seldom matters. However this said, there is a fairly large subset of the area that needs to watch what they buy and where they apply it.
If you are operating under optimum soil conditions the research shows time and time again source does not matter especially for a starter. In a recent study just completed by OSU multiple sources (dry, liquid, ortho, poly ect ect) of P were evaluated. Regardless of source there was no significant difference in yield. With the exception of the low pH site. The reason DAP was so predominate in central Ok, soil acidity. See an older blog on Banding P in acidic soils.

Figure 1. The cover of an extension brochure distributed in Oklahoma during the 1980s.
When DAP is applied, the soil solution pH surrounding the granule will be alkaline with a pH of 7.8-8.2. This is a two fold win on soil acidity aka aluminum (Al) toxicity. The increase in pH around the prill reduces Al content and extends the life of P, and as the pH comes back down the P ties up Al and allows the plant to keep going. However, the initial pH around the MAP granule ranges from an acid pH of 3.5-4.2. There is short term pH change in the opposite direction of DAP, however the the Al right around the prill becomes more available and in theory ties up P even faster.
Below is a table showing the yield, relative to untreated check, of in-furrow DAP and MAP treatments in winter wheat. The N401 location had a ph 6.1 while Perk (green) has a pH of 4.8. At Perkins in the low pH, both forms of P significantly increased yeild, almost 20 bushel on the average. DAP however was 5 bushel per acre better than MAP. At the N40 site the yield difference between the two sources was 1 bushel.

Relative yield winter wheat grain yield MAP and DAP both applied at equal rates of P (32 lbs P2O5 ac) when compared to a untreated check.
In general it can be said that in acid soils DAP will out preform MAP while in calcareous high pH soils MAP can out preform DAP. So regarding the earlier statement about the traditional sales area of MAP or DAP if you look at the soil pH of samples went into the Oklahoma State University Soil, Water, and Forage Analytical lab the distribution makes since.

Average soil pH of samples sent into OSU soil water forage analytical lab by county.
In the end game price point and accessibility drives the system. In soils with adequate soil pH levels, from about 5.7 to around 7.0, get the source which is cheapest per lbs of nutrient delivered and easiest to work with. But if you are banding phosphorus in row with your wheat crop because you have soil acidity, DAP should be your primary source.
Sugarcane Aphids Numbers are Building in Oklahoma.
Guest Blog:
Jessica Pavlu, Graduate Research Assistant,
Tom A. Royer, Oklahoa State University Extension Entomologist
Co-Editors: Eric Rebek and Justin Talley; Oklahoma Cooperative Extension Service
On July 12, 2016, we found sugarcane aphids in a sorghum field in Caddo county that had exceeded treatment thresholds. Jerry Goodson, Extension Assistant in Altus, reported finding a sparse colony of sugarcane aphids in Tillman county last week. Most of the sugarcane aphid infestations that we have observed so far are located south of Interstate 40. We will continue to provide weekly reports of sugarcane activity throughout the rest of the summer growing season.
Oklahoma’s “Sugarcane Aphid Team” (which also includes Dr. Ali Zarrabi, Mr. Kelly Seuhs, Dr. Kristopher Giles from the Department of Entomology and Plant Pathology, USDA researchers Dr. Norm Elliott and Dr. Scott Armstrong, and Dr. Josh Loftin and Dr. Tracy Beedy from the Department of Plant and Soil Sciences), is conducting research to identify effective insecticides, resistant sorghum varieties, best cultural practices to avoid sugarcane aphid, and develop improved sampling and decision-making rules for treatment thresholds.
When scouting, make sure you are finding sugarcane aphid, as it can be confused with yellow sugarcane aphid. The sugarcane aphid (Fig.1) is light yellow, with dark, paired “tailpipes” called cornicles and dark “feet” called tarsi. The yellow sugarcane aphid (Fig. 2) is bright yellow with many hairs on its body and no extended cornicles.
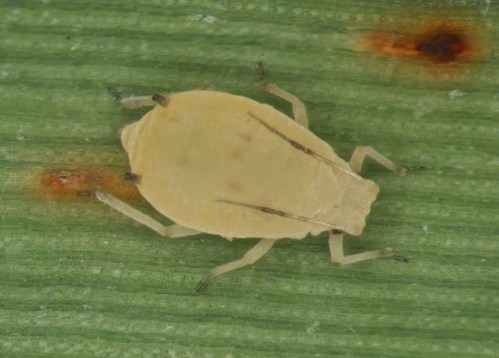
Figure 1. Sugarcane aphid
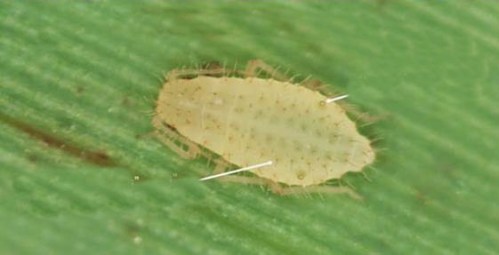
Figure 2. Yellow sugarcane aphid
Currently the suggested treatment threshold for sugarcane aphid is to treat when 20-30 percent of the plants are infested with one or more established colonies of sugarcane aphids. An established colony is an adult (winged or wingless) accompanied by one or more nymphs (Fig 3).
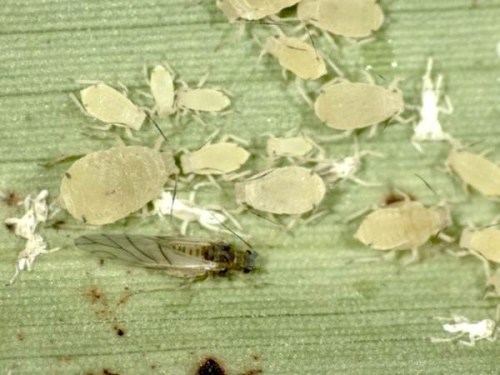
Figure 3. Sugarcane aphid colony
Two insecticides, Sivanto 200 SL, and Transform WD, provide superior control of sugarcane aphid. Sivanto can be applied at 4-7 fluid ounces per acre. Transform WG can be applied at 0.75-1.5 oz. per acre. It is important to achieve complete coverage of the crop in order to obtain the most effective control. Consult CR-7170, Management of Insect and Mite Pests in Sorghum http://pods.dasnr.okstate.edu/docushare/dsweb/HomePage for additional information on sorghum insect pest management.
Sorghum “Whorlworm” and “Headworm” Decisions
Tom A. Royer, Extension Entomologist
This week, I received several reports of “worms” feeding in the whorls of sorghum (Fig 4) which I identified as fall armyworms. I rarely recommend that a producer treat for fall armyworms infesting whorl stage sorghum. Why? because available research suggests that under rain-fed production, whorl feeding rarely caused enough yield loss to warrant treatment costs, AND more importantly, most insecticide applications provide poor control. The poor control is a result of difficult delivery of the insecticide into the whorl allowing the caterpillars to avoid contact. However, recent unpublished research shows that some new insecticides may provide effective control of fall armyworm in the whorl, so it is time to revisit my recommendations.
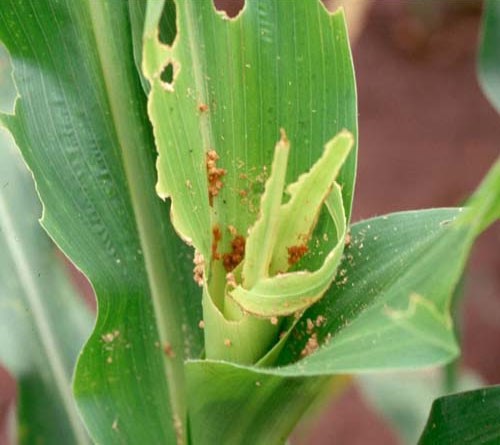
Figure 4. “Whorlworm” damage
Recent unpublished research results conducted in irrigated sorghum out of Lubbock suggest that Prevathon®, Besiege®, and Belt® can provide acceptable control of the caterpillars in the whorl (even large caterpillars). Therefore, the second of the two reasons I listed above may no longer be true; they can be controlled. However, 1: these products were tested on irrigated sorghum 2: they are quite expensive 3: some products may flare sugarcane aphids and spidermites and 4: WE STILL DON’T KNOW HOW THEY IMPACT YIELD, thus, we are still “guessing” with regard to return on investment for control.
How has this information changed my recommendations? Keep in mind that the research in Texas was conducted in irrigated sorghum with a very high yield potential. Since Oklahoma growers typically grow rain-fed sorghum which has lower yield potential, my suggestion is to examine 30 plants (5 consecutive plants in 6 different locations) and split a few stalks to see where the panicle is located. If the panicles are close to emerging (boot stage), my “best guess” is to consider treating if 70% or more of the whorls are infested and there are an average of 1-2 live caterpillars present. Under this scenario, you would be protecting physical damage to the emerging head.
On choosing an insecticide I offer some things to consider. 1: the effective products may or may not be available. 2: some have the potential to flare sugarcane aphids and spidermites. 3: they are all expensive. Belt is still available for use, but EPA recently requested that Bayer voluntarily remove it from the market. Bayer refused, and asked for an administrative hearing. On June 1, an administrative law judge upheld EPA’s decision to cancel registration of Belt. Bayer is appealing and is scheduled to receive another review from the Environmental Appeals Board before July 6. If EPA prevails in the appeal process, Belt will no longer be available. However, Bayer says that Belt can still be sold, purchased and used during the appeals process.
I have little information on how Belt affects sugarcane aphids or spidermites. Besiege is a mixture of the active ingredient in Prevathon with an added pyrethroid. Research in Lubbock suggests that spidermites may flare with Besiege. We also know that any pyrethroid will flare sugarcane aphid. Prevathon has not shown the propensity to flare either spidermites or sugarcane aphids.
We are attempting to obtain data on the effectiveness of, and yield returns obtained from Prevathon to control fall armyworm in the whorl. Until I have more data, I can only say that a producer should carefully consider a decision to control “whorlworms”. The jury is still out as to whether controlling them is economically justified.
With regard to headworms, we have well-designed decision making capability coupled with solid treatment thresholds. USDA and University scientists developed a computer-based program that can calculate an economic threshold for headworms (Fig.5) and provide a simple sampling plan that tells the producer if threshold is reached (Fig.6).
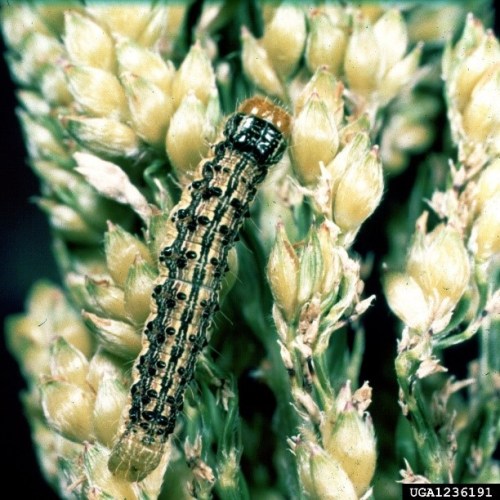
Figure 5. Sorghum headworm
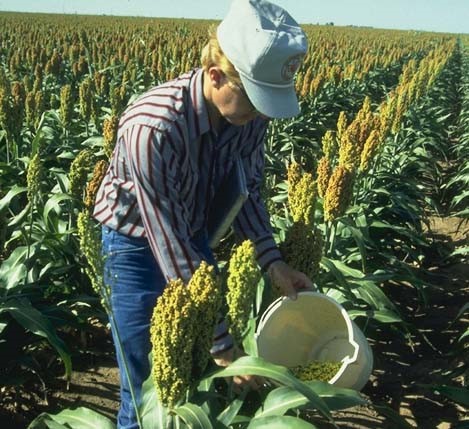
Figure 6. Bucket sampling for headworm
Called the Headworm Sequential Sampling and Decision Support System (http://entoplp.okstate.edu/shwweb/index.htm), it uses input on the plant population, the crop’s worth and the control costs to calculate a treatment threshold.
Now, prepare for the tricky part! If we only had to consider one pest, I would advise selecting the insecticide that works best on that pest. However, we now have to consider sugarcane aphid in all of our sorghum pest management decisions. In my opinion, if sugarcane aphid is already starting, a producer must consider using either Transform or Sivanto. That narrows the choice options for combining another product to control headworms because pyrethroids could flare the aphids.
I have reviewed data from multiple years of insecticide trials throughout the SE US. The data suggests that products containing chlorpyrifos provide spotty control of headworms. Data that I have reviewed from other insecticide trials suggests that Prevathon and Blackhawk provide excellent control of headworms and Diamond® was also effective on headworms. For information on spray mix compatibility, talk to the local sales representatives for the products you have chosen.
Consult CR-7170, Management of Insect and Mite Pests in Sorghum http://pods.dasnr.okstate.edu/docushare/dsweb/HomePage for more information.
Wheat Disease Update – 14 May 2016
Wheat Disease Update – 14 May 2016
Bob Hunger, Extension Wheat Pathologist
Department of Entomology & Plant Pathology – 127 Noble Research Center – Oklahoma State University – Stillwater, OK
405-744-9958 (work) – bob.hunger@okstate.edu
This past week in addition to being around Stillwater, I attended field days in Canadian County (just west of Oklahoma City), Kay County (north of Ponca City), Kingfisher County (northwest of Oklahoma City) and Major County (west of Enid). Wheat I examined ranged from milk to medium dough. Some active stripe rust (producing spores) was still present in Major County, but only at low levels. Leaf rust is prevalent around Stillwater, with low levels of leaf rust found in Kay and Major Counties.
Symptoms of barley yellow dwarf (BYD) also were observed at all locations. As previously indicated, I observed only discolored (yellow to reddish-purple) flag leaves and no stunting indicating infection of BYDV by aphids occurred in the spring. One observation of note is that often with BYD the flag leaf will be discolored but leaves below the flag remain green as in the photo below. This is indeed BYD.
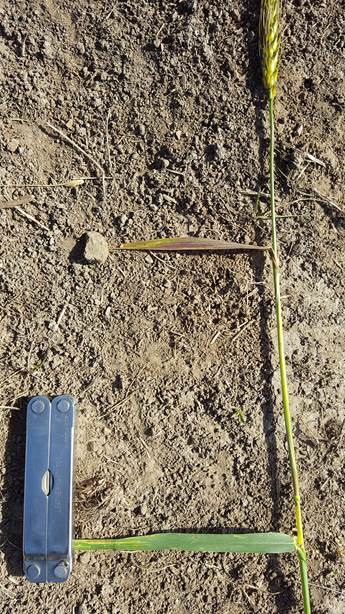
Wheat tiller showing flag leaf with BYD symptoms but lower leaf green
The Diagnostic lab also has continued to receive samples testing positive for Wheat streak mosaic virus and/or High plains virus. These samples have been from northern, northwestern and the panhandle regions of Oklahoma. For more information, see Fact Sheet EPP-7328 (Wheat Streak Mosaic, High Plains Disease, and Triticum Mosaic: Three Virus Diseases of Wheat in Oklahoma) at http://pods.dasnr.okstate.edu/docushare/dsweb/Get/Document-8987/EPP-7328.pdf
Finally, another disease that is making an appearance in Oklahoma this year is take-all. I have not observed take-all in Oklahoma now for many years; in fact, the last time we received a number of samples of take-all was back in the early 2000s. Take-all is favored by moist conditions and a neutral to alkaline soil pH. Abundant moisture starting a year ago and in areas of Oklahoma again this year have likely provided conditions favorable for this disease in a few areas. Take-all will first show as white plants in low-lying, wet areas after a period of hot days. I don’t think this will be a significant disease in Oklahoma this year, but wanted to bring it to your attention.


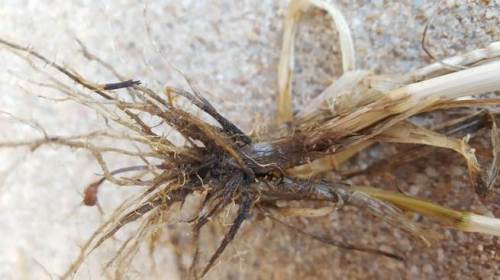
Darkened crown and roots due to take-all
Reports/excerpts of reports from other states:
Colorado: Dr. Kirk Broders (Plant Pathologist); Colorado State University; Fort Collins, CO; May 11, 2016: “There has been good precipitation around the state this spring which has led to a good wheat crop, but also provides the potential for more foliar diseases than we usually see. Most of the wheat in the southeast has already headed out and there are low levels of stripe rust present, but likely will not impact yield especially where the wheat is further along. Wheat in the rest of the state ranges from booting to heading (Feekes 10 – 10.1). It is at this point that the flag leaf will also become fully emerged, and it will be important to ensure the flag leaf is protected in order to protect yield. I have received reports of stripe rust from multiple locations in eastern Colorado from Prowers County in the southeast and further north in Cheyenne, Kit Carson, Yuma, Washington and Arapahoe counties. Scott Haley mentioned he saw bacterial streak in the northeast part of Colorado and I have also received a couple reports and confirmed one report of Stagonosopora blotch on wheat in Washington County. Both reports were from wheat planted after a previous wheat crop. There were several reports of Stagonospora blotch in the state last year likely due to the significant amount of precipitation. This fungus is capable of surviving on wheat stubble and then infecting the successive crop given ample rainfall. Both Stagonospora blotch and stripe rust remain sporadically distributed and at low levels in most regions in the state, but with more predicted rain in the forecast growers may want to consider applying a fungicide once the flag leaf is fully emerged in order to ensure it is protected and the head is able to yield to potential. Certainly, they should take into consideration whether there is any foliar disease currently in the field or in their region, the potential yield of the crop and the cost of the fungicide to be applied, as well as the probability of cool, rainy weather in the forecast.”
Wisconsin: Dr. Damon Smith (Ast Prof – Field Crops Pathology); University of Wisconsin-Madison; May 11, 2016: “It was only a matter of time…. Today we confirmed the first observations of stripe rust in Wisconsin for 2016. Brian Mueller, Graduate Research Assistant in the Field Crops Pathology Lab at the University of Wisconsin-Madison found active stripe rust pustules in winter wheat in both southern and south central Wisconsin. In southern Wisconsin stripe rust was found in the Wisconsin Winter Wheat variety trial located in Sharon, Wisconsin. Stripe rust was at low incidence and severity on emerging flag leaves with some lesions manifesting as chlorotic flecks and not yet active. We speculate that the epidemic initiated recently. With the humid and rainy weather over the past several days, conditions have been ripe for symptom development. The second stripe rust confirmation was at the Arlington Agricultural Research Station in an integrated management trial for stripe rust. Again, incidence and severity were low on emerging leaves, therefore, we speculate that the epidemic has recently initiated. We have been actively looking for stripe rust as there have been numerous reports of epidemics in winter wheat in states to our south and west. Given the recent weather patterns we will likely see more stripe rust show up in the state. I suspect we will start to see fungicide sprayers active in wheat fields in the state given the fact that the epidemic onset is coinciding with the emergence of flag leaves. We will continue to monitor the situation carefully.”
Planting considerations after hayed or failed wheat crop
This article is written by Dr. Josh Lofton
Oklahoma State University Cropping Systems Extension Specialist
Determining wheat yield loss:
The question on to how to manage wheat production that has suffered high potential yield loss can be quite challenging. High disease pressure and periods of dry conditions have been the main focus of this season’s wheat crop, but the recent storms have added to these issues with fields having >50% lodged wheat. While this may be a great concern when viewing this crop initially, a lodged or damaged wheat crop may still have decent yield potential. It is important to remember that, 50% lodging does not necessarily represent 50% yield loss. Many times the wheat crop will stand back up days or weeks after a lodging event. Overall, for a questionable stand of wheat, the best course of action might be to keep the stand and get the most yield possible from the crop. If you are considering planting a crop after failed or abandoned wheat, there are some important considerations before making the jump.
Insurance potential for a replacement crop
This will be the biggest catch for terminating a current wheat crop for a replacement summer crop. In many scenarios, once the wheat crop has begun to head this will be considered a double crop situation. In this instance many companies will not allow insurance to cover the following crop. Even if insurance is available for this double-crop scenario, at least three year yield potential numbers are frequently the minimum needed to receive this support. The best first steps for a grower to take when evaluating their fields planting of a replacement crop after a termination or hay is to check on their individual coverage and talk to their representatives before any action is taken.
Things to consider before moving into a summer crop:
Herbicide restrictions:
One of the most important considerations for determining if and what potential crop could be planted following a non-harvested wheat crop is the chemistries used during the year. Table 1 gives rotational restrictions on some commonly used winter wheat herbicides. While this provides a summary or shortened list of herbicides and their rotational restrictions, producers should check individual labels if other herbicides were used. It should also be mentioned that minor plant injury could occur past the stated months following application given differences in soil conditions such as pH, soil moisture, and soil temperature.
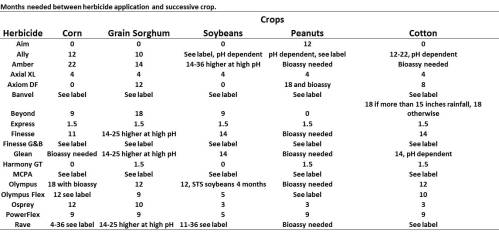
Wheat herbicides rotation restrictions
Heavy wheat residue:
One thing that needs to be decided is how the grower will manage the heavy wheat residue associated with the failed crop. Certain situations exist that may result in limited to no residue (i.e. haying or heavy disease pressure); however, most producers will be faced with high residue load which may potentially be heavily matted and may pose challenges for producers to plant through. In these situations, producers may need to resort to tillage. The amount and intensity of tillage will greatly depend on the amount of residue left in field. In high residue situations, producers may need to run one or several primary tillage practices followed by a secondary or finishing tillage event. However, in lower residue conditions or if the producer has access to no-till equipment, no tillage may be needed to achieve a successful stand.
Overall cropping system:
When deciding to terminate an existing wheat crop and/or to plant a successive crop, decisions need to be evaluated at a systems level. Growers need to ask themselves whether this makes sense within their system and if it fits into their long-term system goals. If the original intent for the system was to double-crop following wheat harvest, it needs to be determined if the remaining economic benefit without the yield from the wheat crop. This may be at least partially alleviated if any profit can be made from the wheat crop (i.e. hayed) but needs to be evaluated on a specific field basis. The next question will be what the successive crop would have originally been? If a summer crop is planted, some systems will need a winter fallow as to not overstress the system, harvest the summer crop prematurely, or plant the successive winter crop past the appropriate timeframe. In this case it needs to be determined if that is suitable for the long-term system goals. Many of these scenarios exist and each could be beneficial or not within individual systems; however, growers need to evaluate these individually and determine what works best for their current situation and their long-term production goals.
Overall, the decision to move to a replacement crop can be very challenging. It cannot be stressed enough that in most situations maintaining the existing crop is likely the best option for most producers.
Josh Lofton
Assistant Professor
Cropping Systems Extension Specialist
376 Agricultural Hall
405-744-3389
josh.lofton@okstate.edu
Learning from Strip Trials.
This article is written by Dr. George Rehm, University Minnesota, Soil Fertility Specialist (retired).
See more of Dr. Rehm’s blogs at agwaterexchange.com.
Use of strip trials as a learning as a way to learn is becoming more popular across the Corn Belt. This is to be expected. Crop producers have a thirst for information. With GPS technology and yield monitors, and the use of common sense, it’s not difficult to establish strip trials for the purpose of evaluating a concept or compare one or more products or rates of a product. There are, however, some important considerations for the conduct of a strip trial. These begin with planning before planting and continue with appropriate interpretation of the data following harvest. These considerations are summarized in the paragraphs that follow.
IN THE PLANNING PROCESS, SIMPLICITY RULES — Speaking from years of experience, when planning, it’s very easy to bite off more than you can chew. What looks easy or simple on paper can be a logistical problem when you go to the field. So, make comparisons simple. If comparing rates of nitrogen fertilizer for corn, for example use no more than three rates. It’s nice to have a control (the variable of interest is not used). The treatments to be compared must be repeated in the field at, least three times. If comparing rates of nitrogen fertilizer for corn, for example, use no more than three rates. It’s nice to have a control (the variable of interest is not used). The treatments to be compared must be repeated at least three times. The replication must be in the same field. It is almost a waste of time if fields are used as replications. If a control is used, it should also be replicated three times.
SITE UNIFORMITY — The day of selection of the site for a strip trial is probably the most day for the entire project. Soil uniformity is a must. There is no easy and simple procedure that can be used to correct for lack of soil uniformity at the site. There are several tools that can be used to select for soil uniformity. The Soil Survey should not be ignored. Soil test information based on either grid or zone sampling can also be very valuable. Time spent in selecting a uniform site is time well spent.
PRODUCTION PRACTICES — Once a specific comparison has been selected it’s very important to keep other production practices constant. For example, information from a strip trial designed to compare nitrogen rates has little value if varieties are changed in the trial area. Except for the factor of interest, keep all other production practices constant across the strip trial area. Two production practices that change across the strip trial cannot be changed at the same time. Careful planning for this type of project takes time and thought.
DATA COLLECTION — Unless there are special reasons to do otherwise, samples collected from treatments at any strip trial site should be collected at the same time. This practice reduces variability in the data. Considering yields, use of combine yield monitors or weigh wagons is certainly appropriate. Although this may be obvious to most, it is essential to record yields from each strip separately.
STATISTICAL ANALYSIS — There’s a reason for repeating (replicating) each treatment at least three times. The project is not complete until the data collected have been analyzed with a mathematical procedure called “statistical analysis”. I think that we all realize that there is variability across any field. With all factors being equal, we could combine four strips across any field and the yields would not be the same. So, when we see differences in yield, the obvious question is: “Is the difference in the yield the result of a real difference caused by the factor being considered or variability across the field?” Statistical analysis is the tool needed to answer this question. There is no other way to answer this question.
Let’s look at an example illustrating the importance of statistical analysis. Using strip trials in different counties, two rates of nitrogen were compared. There were three strips of each rate. For a field in Kandiyohi County with corn following a soybean crop, yields from the lower nitrogen rate (149 lb. soil + fertilizer N/acre) were 123, 157, and 170 bu./acre for the three strip receiving this rate. These three yields average to 150 bu./acre. For the higher nitrogen rate (199 lb. soil + fertilizer nitrogen), the three yields were 157, 176, and 166 bu./acre. This averages 171 bu./acre. Using these arithmetic averages, the initial conclusion is that the higher nitrogen rate was better than the lower nitrogen rate It would certainly appear that 171 bu./acre is better than 150 bu./acre. If statistical analysis is used, however, the difference in yield is not statistically significant. Why? This conclusion is the consequence of substantial variability among three replications. In other words, the arithmetic difference is due to variability in yield across the field rather than the factor being compared.
For the same project, a strip trial was used on a field in Carver County. The corn/soybean rotation was used. The low nitrogen rate was 102 lb./acre and the higher nitrogen rate was 151 lb./acre. Yields from the three strips with the low nitrogen were 181, 196, and 195 bu./acre with an average of 191 bu./acre. For the high nitrogen rate, yields from the three strips were 208, 210, and 207 bu./acre with an average of 208 bu./acre. Statistical analysis of this yield data showed that the difference between 191 bu./acre and 208 bu./acre was not due to variability in the field. It was, in fact, the result of the rate of nitrogen applied. Notice that variability among the three replications for each nitrogen rate was small. Thus, we can say with confidence that there was a REAL difference in yield caused by the rate of applied nitrogen.
Nearly everyone involved with strip trials wants to present an economic analysis of the yield data. This is logical. HOWEVWE, an economic interpretation is only valid if differences between or among treatments is STATISTICALLY SIGNIFICANT. Otherwise, we make a serious MISTAKE that could have serious economic consequences. For the Kandiyohi County field, the difference in yield could have been caused by treatment applied or natural variation in the field. We have no way of knowing the real cause. For the trial in Carver County, we are sure that the difference in yield was due to the rate of nitrogen applied. Use of statistical analysis allows us to reach this conclusion. Now economic interpretation can be applied to the results.
SUMMING UP — Use of strip trials is a good way to make comparisons between or among factors that affect crop production. In addition, these comparisons can be conducted in growers’ fields. However, it’s not an easy task to do an accurate job. Good planning is needed at the beginning and STATISTICAL ANALYSIS is essential at the end. There are too many comparisons where statistical analysis is ignored and only arithmetic averages are used. Without statistical analysis, there can be any number of interpretations of the data. Statistical analysis eliminates the potential for confusion.
Dr. George Rehm,
University of Minnesota
Nutrient Management Specialist (retired)
rehmx001@umn.edu

