
Using a Grain Drill Grain Box for Fertilizer, Results and a Calibration guide.
For the last few years I have been challenging people to “Think Out Side the Box” when applying fertilizer. One of these application methods is to use a grain drill to put Nitrogen fertilizer into the soil. Just the act of getting N into the soil will immediately decrease the opportunity for losses. While it seems crazy many picked up on the idea of using grain drills for N applicators. The first year of a two-year study looking at documenting the practice is in the books. With data coming in from three locations, utilizing two drill types (double disk conventional and single disk no-till), the results are quite promising. The biggest take home from year one was a 2 parter: 1) if conditions are conducive to nitrogen loss from urea volatilization, applying urea with a grain drill in the spring improved efficiency. Conversely if loss potential was low, there was no difference. 2) in some soil conditions the double disk drill could not close the furrow and this reduced the positive impact of using the drill. The two tables below show the impact application and environment on yield. Each of the treatments had 60 lbs of nitrogen (as Urea) applied per acre. At Chickasha the first application was made while it was fairly dry and then it rained, but the second application was made during a period in which there was no rain but a fairly significant dew each morning. This can be seen as the small effect volatilization played on the yields of the first application timing. At Lahoma, it was the early applications that had a higher risk of loss with no difference seen later.

Partial year one results from the topdress N with a grain drill at Chickasha OK. Timing 1 was late January and timing 2 was late February.

Partial year one results from the topdress N with a grain drill at Lahoma Ok. Timing 1 was early January and timing 2 was mid February, and timing 3 was early March.
With the results from the first year of the top-dressed drilled nitrogen studies in the books, the interest has been increasing. One question keeps popping up: for grain drills without a fertilizer box, what do we put our grain box on to apply fertilizer. At one point the number of inquires hit a critical mass and I sent out my crew to find grain drills and create calibration curves for DAP (18-46-0) and Urea (46-0-0). The crew did just that.
Now please consider what is presented below is a general calibration. Much like the chart on your grain drills, it will hopefully get you close but the best-case scenario is that each drill is calibrate prior to running. As request are made we will try to add more drills to this list.
To create the following charts the guys located several different makes of drills around the OSU experiment stations. They were instructed to choose setting based on the manufacture seed rate charts in the range of 60, 90, 120 etc. For each setting they caught a couple of row units for both Urea (46-0-0) and DAP (18-46-0). They caught each setting multiple times to get a good average.
If you look at the tables you can see the Landol 5211, Great Plains 1006NT, and International 5100 are fairly similar, with the John Deere 1560 being a little lower and the John Deere 450 significantly lower at the lower rates. To use the tables below, consider what kind of grain drill you have and choose to follow one of the drills listed or the average of all five. If you use the average value I would expect most to find they applied a bit more than planned. To make it even simpler, but less accurate, you can use the % wheat value. To do this for DAP take your target rate and divide by .88, this value is what you want to set your drill to. For example for a target rate of 100 lbs DAP per acre use the following formula: 100/.88 = 114. Choose the manufacturer recommended settings 114 lbs wheat seed per acre. If you are wanting to apply Urea take your target rate of urea and divide by 0.71.
DAP 18-46-0
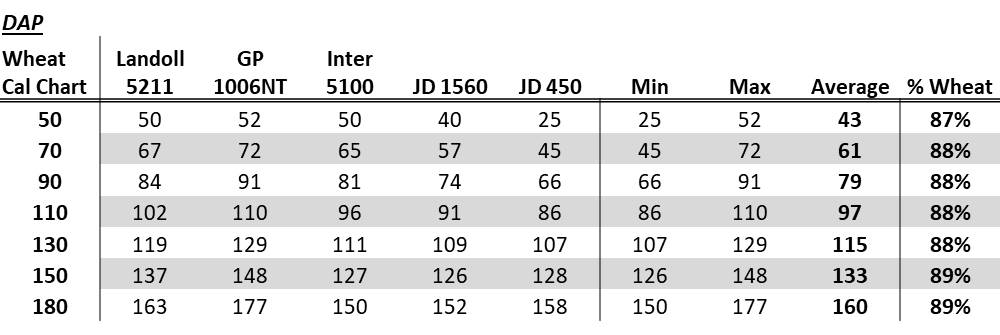
Table showing the manufacturer wheat rate setting and the resulting amount of DAP 18-46-0.

Graph documenting the manufacturer wheat rate setting and the resulting amount of DAP 18-46-0.
UREA 46-0-0

Table documenting the manufacturer wheat rate setting and the resulting amount of Urea 46-0-0.

Graph documenting the manufacturer wheat rate setting and the resulting amount of Urea 46-0-0.
Again, I cannot state this enough, this is a general guide, each drill even of the same manufacture and model will likely be different. The only way to be certain of the rate applied is to calibrate each drill individually.
Questions or comments please email me at b.arnall@okstate.edu or call 405.744.1722
Scouting App Review
For 2017 InfoAG I was challenged to review the available mobile scouting apps. While I have been reviewing ag apps since the summer of 2013 https://osunpk.com/2013/07/30/agriculture-app-for-the-ipad-and-iphone/ , I had yet try to tackle a group as complex as scouting apps.My first challenge was to locate all relevant apps. My search began using social media and the search terms Crop Scouting, Field Scouting, Ag Scouting, and Farm Scouting for both iPhone and iPad apps. After a week-long hunt I had found around 30 apps, although I am sure I missed a few. As most of these app require payment, I assumed most would have a 30 day free-trial period. So towards the end of June, about a week out from the meetings, I started trying to gain access. As I did this I kept records in an excel file on how the process was going. I found that with nine apps I had immediate access via the app, for seven apps I was able to request a demonstration, and for another six I used the contact us option and requested a demo via that method. By Friday, July 21st, I had access to 17, my presentation was on Wednesday the 26th. I should note that a few more demos were provided after the presentation, but are not included in this review.
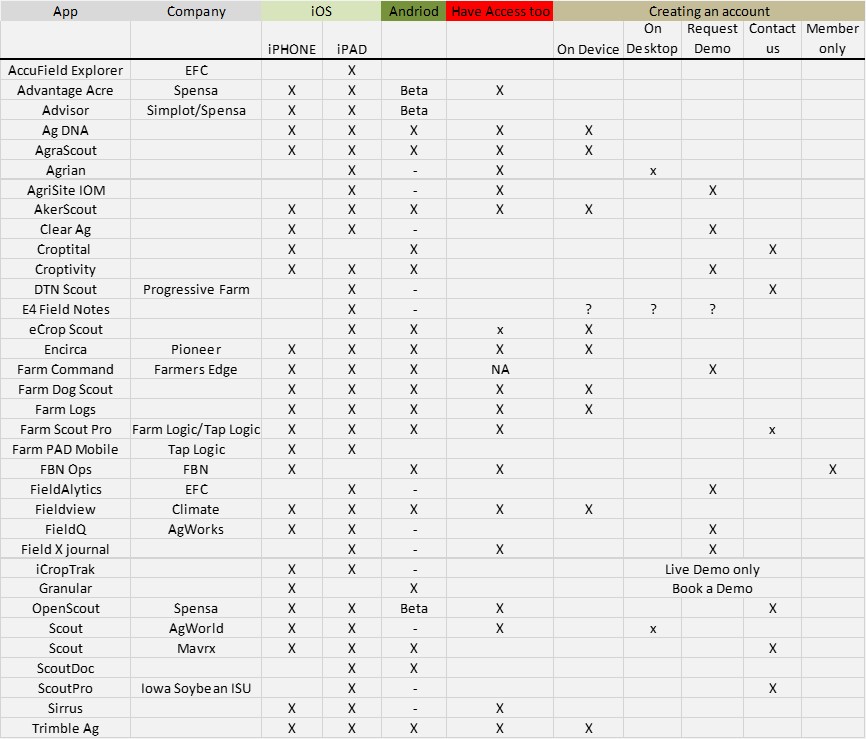
List of all apps downloaded for the review.
After I gained access I went into iTunes and Google play to determine where they could be found.
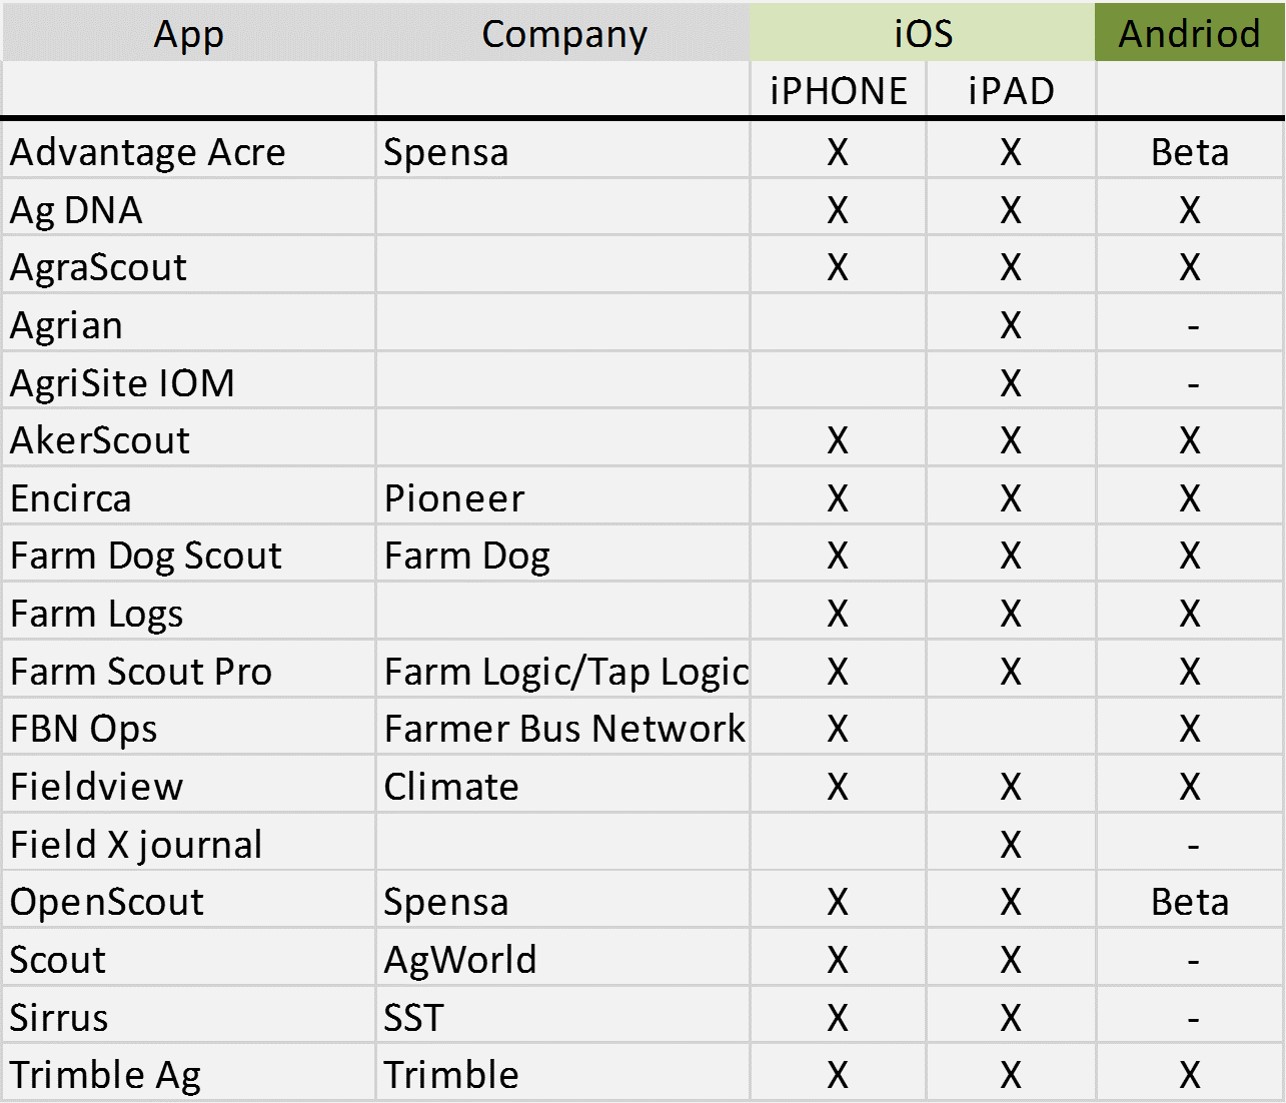
Mobile devices applications are available for.
During the signup and trial phase most apps offered/suggested/preferred that I went through training for supervised demonstration of their applications. I chose to pass on the training. The first reason was simply due to time constraints, as my presentation data was approaching rapidly by this point. More importantly, I wanted this review to be useful to the people I know that are interested in these apps, and I also know that many of these people are just the type to try something without instructions, you know who you are! So my observations are based entirely on how well I was able to intuitively use the applications. There is no question if I had gone through the training I would have picked up on several items I likely missed. Also it should be noted many of the demo versions I had access to had limited functions.
Evaluation of the apps took place in the field, office, and home. Near the end of the project I spent many hours reviewing notes and going back and forth between the mobile and web based versions.

Home work space. Laptop for web applications, iPad mini for app review, iPhone and notebook for in-field notes.
As I was working through each of the apps, I tried to put myself in the shoes of a private crop scout, much like many of my friends are. This is an important point to consider because as I dug deeper into the applications I came to realize that many of these apps were developed with larger consulting firms in mind. The next table has some important ramifications depending upon the user. Almost every application had a downloadable software or web-based form utilized for operation management. Some of the apps that fell into the category of “Needed to Perform” are the apps which a field boundary or scouting trip could not be initiated from the mobile device.

It is those applications that needed a manager to set fields and/or assign task which I deemed where meant for larger consulting groups, as this strategy would not be efficient for a one or two person operation. These applications did have some impressive functions allowing managers to follow scouts progress and direct operations near real time.

If a web or desktop based program was needed to direct actions I categorized the application as best fit for larger consulting groups.
One of the first tasks I wanted to review was the creation of field boundaries. From the view point of a private consultant, I put an emphasis on those apps which could draw field boundaries from the mobile device. The use of CLUs (common land units) was an interesting way to load boundaries, more on that in a bit. Most applications that utilized CLUs did so in the desktop program, however several apps also had the option within the mobile device. A few of the desktop apps also allowed the import of shape files to set field boundaries, it was the only option in Field X.

This table shows which mobile applications can apply field boundaries from the device, which applications utilize CLUs (common land units) and shape files.
Drawing field boundaries was the one area that some apps really separated themselves in terms of functionality. For me, the mobile device field boundary winner was the AgDNA app. Their use of the cross-hair with pin drop at the top of the screen increased the accuracy of the pin set. Often, when dropping pins or moving the pins in other apps, the placement would be off due to poor finger to eye coordination. Sirrus and Agrian tied for 2nd, and both provided a zoom option for the pin after placement. AgriSiteIPM provided a nice function where the application dropped an additional pin between any two that I placed. I found this to help speed up the task and allowed me to make some refinements a bit quicker. All other applications were equal.
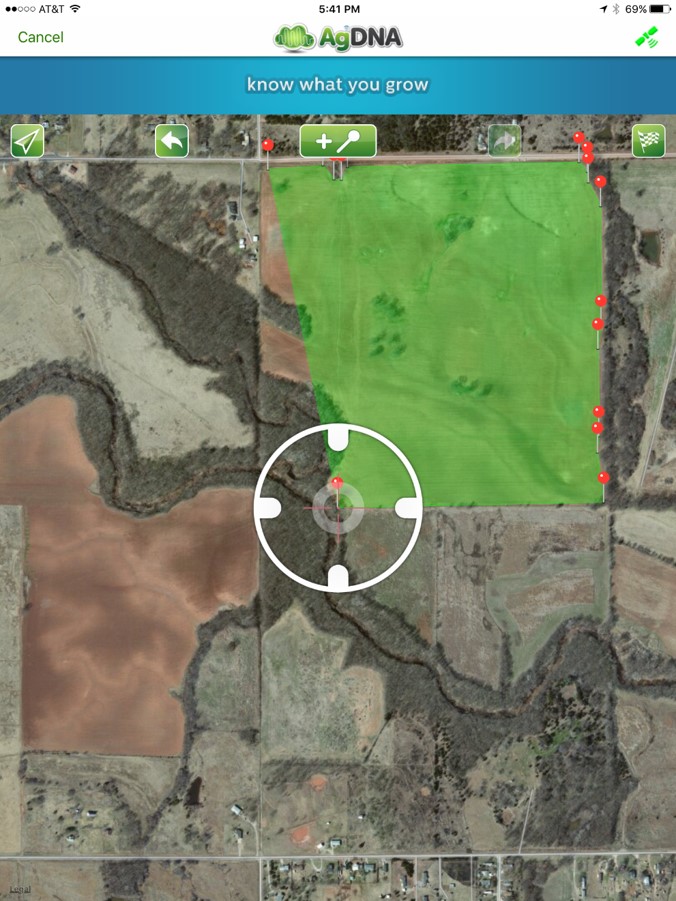
AgDNA field boundary draw tool.

Sirrus Field boundary draw tool.

Agrian Field boundary draw tool.

AgriSiteIPM Field boundary draw tool.
Now back to the CLU conversation. With CLUs the application draws the boundaries for you. I must say that, when it works properly, it is a very nice function. Below are two examples of fields I used CLUs to define field boundaries.

Field boundary building utilizing common land units (CLUs). Often this was a very nice feature.
However CLUs did not consistently identify the proper fields. In the examples below, the L field on the right is actually two separate fields with a dirt road between them, the example on the right only identified the grass waterway and left the field unselected. The saving grace is that all of the apps with CLU option also had the draw option, so if the CLU did not work I could just draw it in manually. So in the long run, no harm no foul.

Field boundary building utilizing common land units (CLUs). Just as often this feature did not work for the fields I wanted.
The next task I evaluated was entering crop/field information, such as crop type, variety/hybrid, planting date, fertilizer, and pesticide applications. My preference was that this task could be accomplished from the mobile device. As it turned out many of the applications which would function better for a larger organization did not allow for this information to be entered via the mobile device. Also, as a soil scientist, I was bummed by the lack of apps with the ability to bring in SURGO data, and even more let down that the majority of the desktop versions did not utilize this data layer. So, with that being said, a big props to FarmLogs for being the only mobile app with the capability of downloading SURGO data layers. Climate had an interesting “soils” portion of the app, where it provided a table listing predominate soil texture, percent organic matter, soil pH and CEC. A note on the Climate soils data, while the soil texture, OM, and CEC are not far off the average, I felt that the pH was off by a bit. This is not unexpected however as, of all the reported variables, pH is the most impacted by human activities.
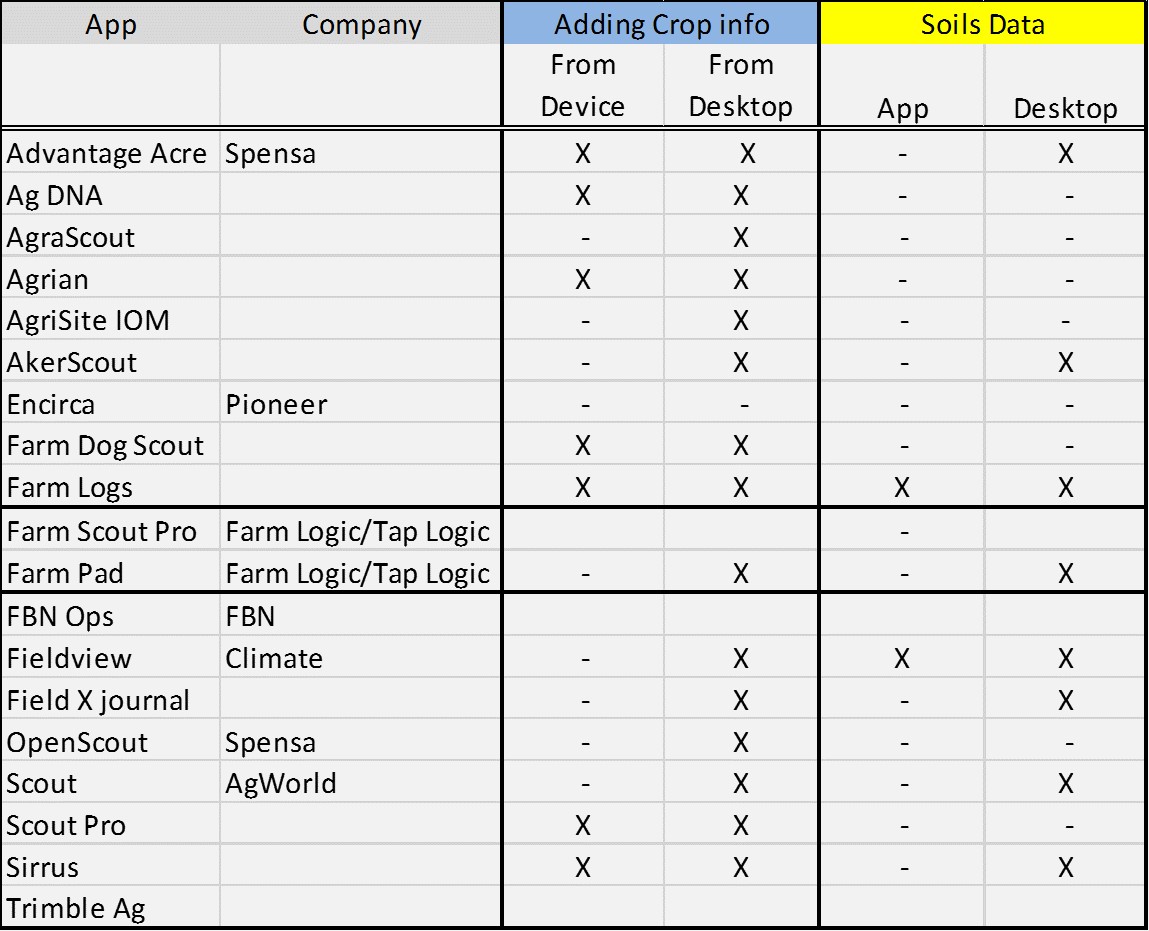
This table list the applications which the crop information (crop type, variety/hybrid, population and planting date. The table also list the applications which had access to SURGO soil type data.
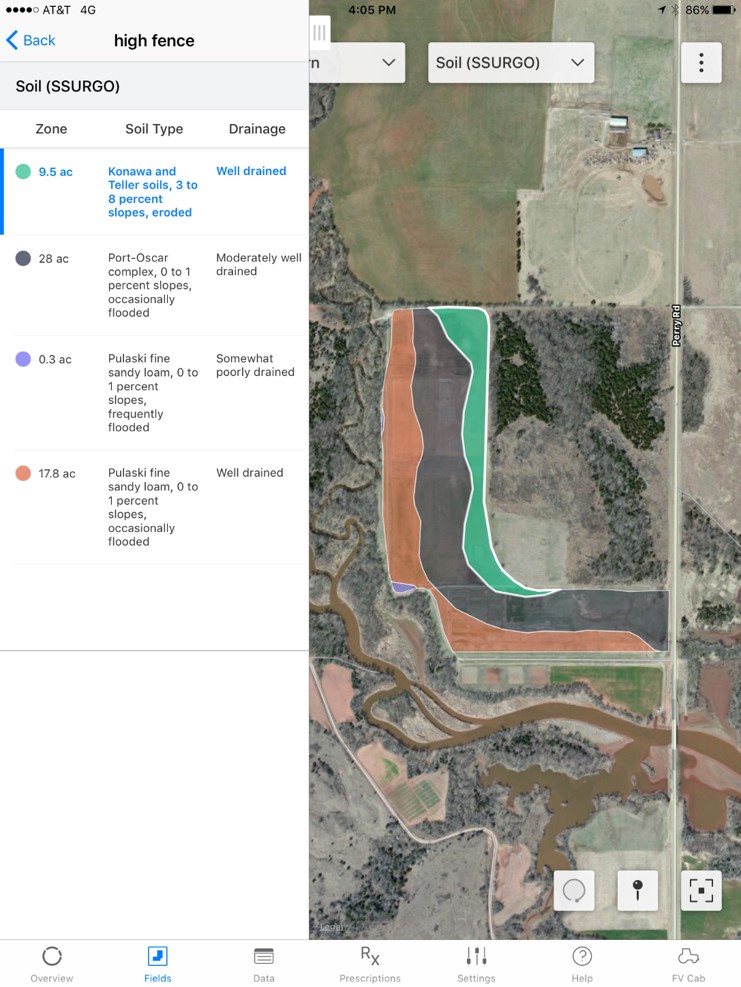
FarmLogs brought SURGO data directly into the application.
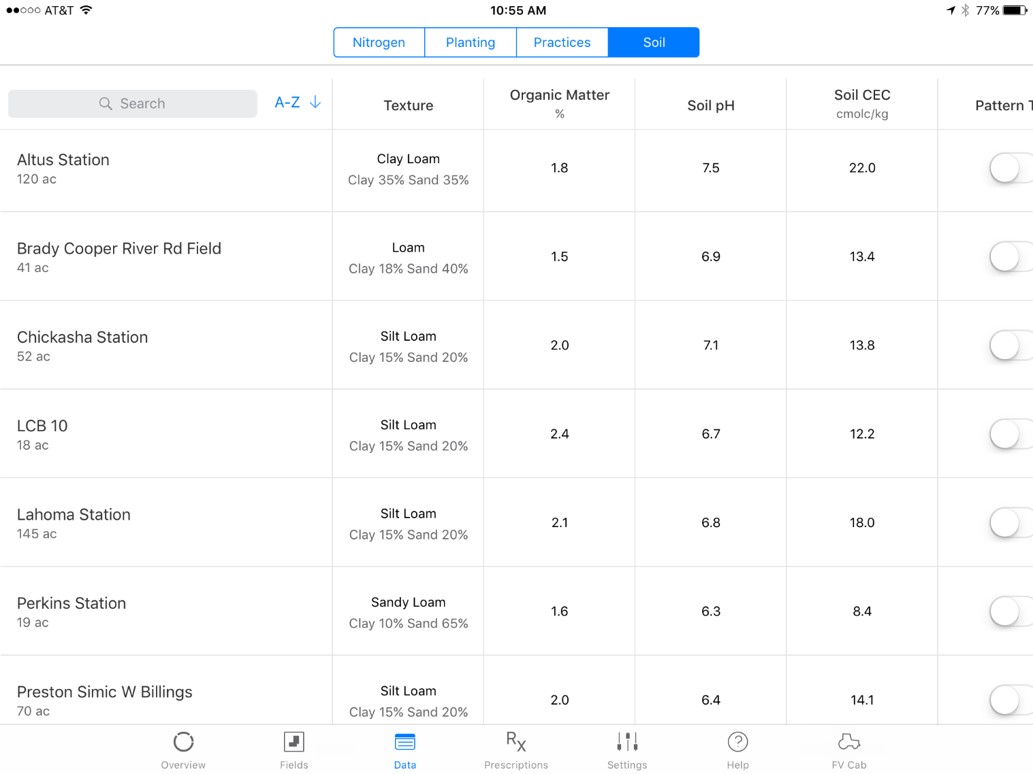
Climate provided fields dominate soil texture, estimated OM%, pH and EC.
Below is a summation of the weather functions of mobile and desktop applications. I categorized the data as Historical (multi-year average), Past (either calendar or growing period weather), Current (today’s temp and wind), and Forecast (3-10 day forecast on either a daily or hourly basis). From the consultants viewpoint if I am out in a field trying to determine if I should recommend a nutrient or pesticide application weather is a BIG part of that decision process. So having the current weather and forecast in hand when I have to make that call is a great tool. The past/historical data is something I really enjoyed looking at, and could spend hours doing, its impact on management decision is not as critical as forecast, but is still a tool I appreciated. With that, Climate and Sirrus were the only mobile apps with a forecast function while Farm Logs had nice past data functionality.

This table shows the weather and forecast features on the mobile and desktop applications.
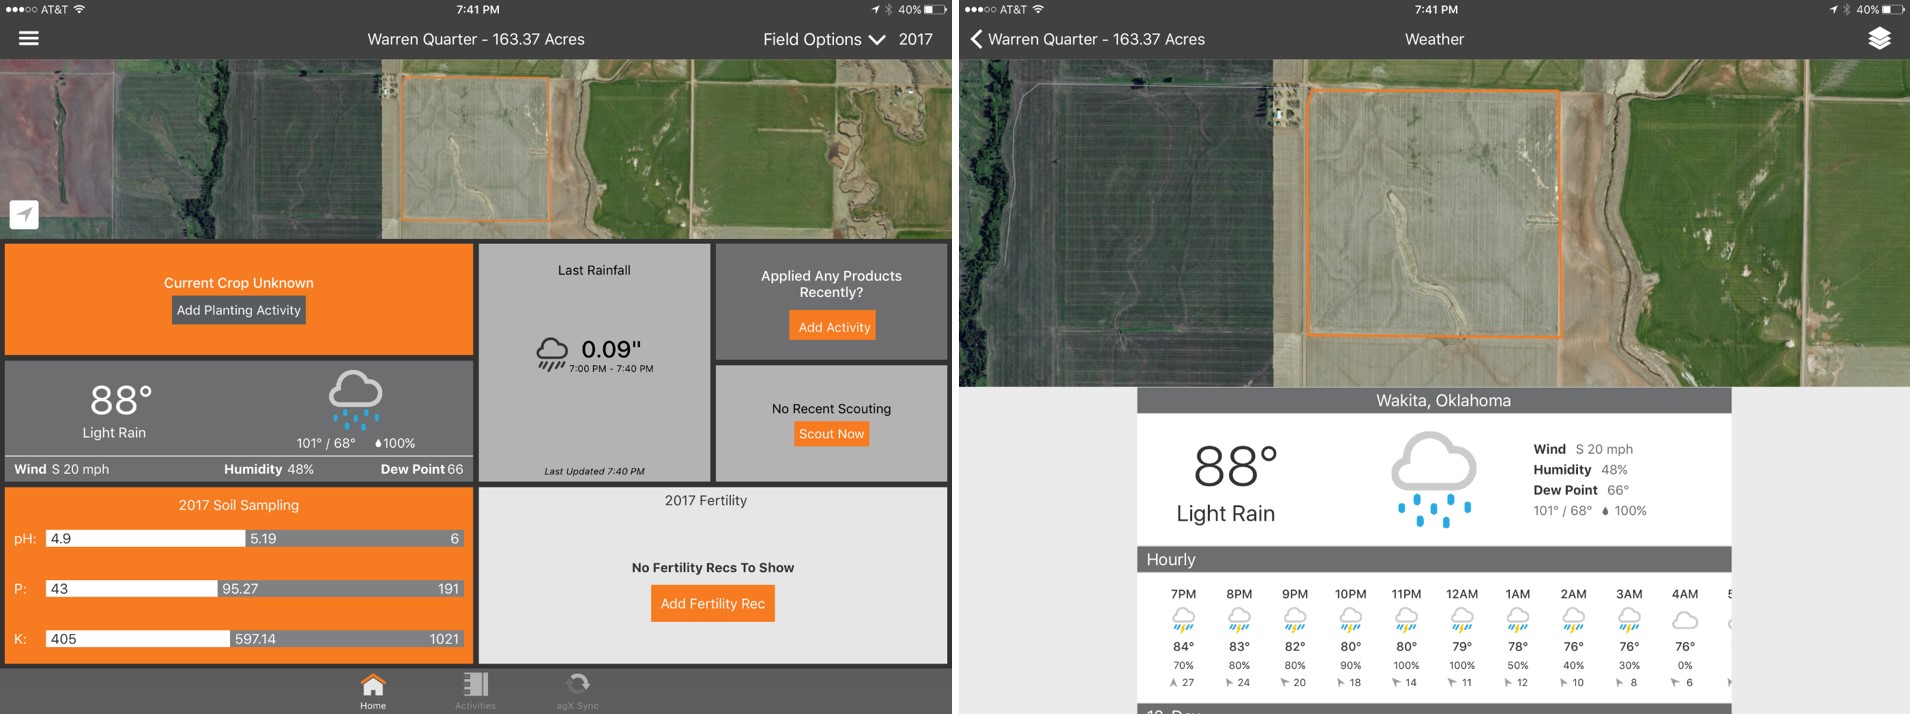
Sirrus shows current weather on the fields home screen with the option to look at hourly and 10 day forecast along with historical precip data.

Climate provides current weather, hourly and 6 day forecast along with seasonal weather data based upon field planting date.
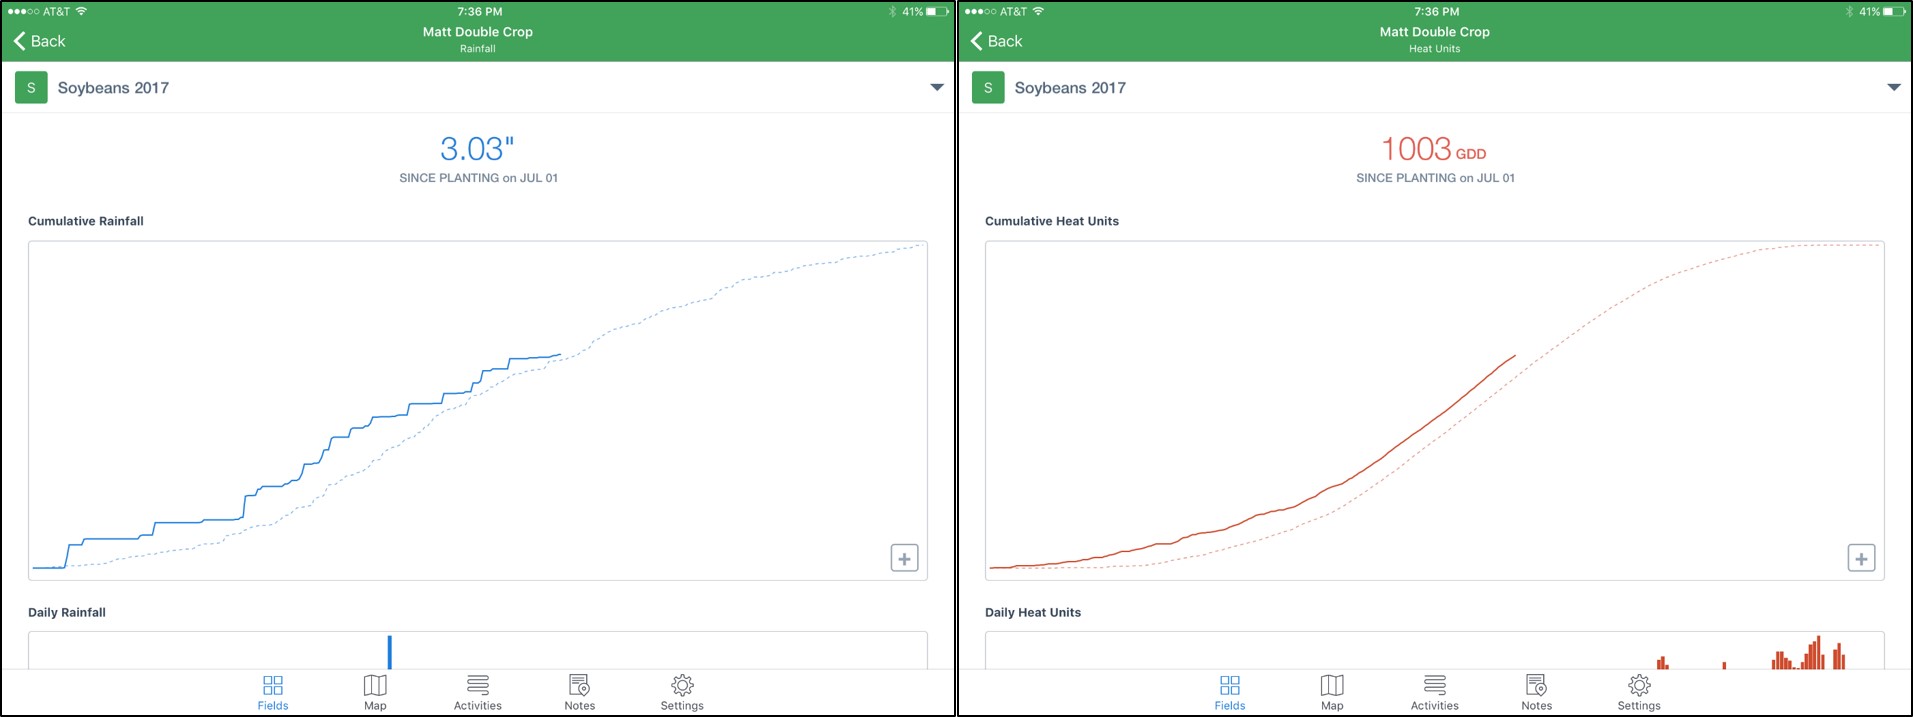
FarmLogs scouting app graphed the rainfall and GDD heat unit accumulation over the growing period
Within the Scouting Section I was looking for in field functionality of collecting information and sharing. As expected, all apps provided the ability to drop pins via GPS and add notes and images. Some apps also allowed the user to select the location to drop pins. I liked the ability to add stand counts and a few applications actually allowed the users to collect multiple sampling points and provide an average. This is a nice function that promotes proper sampling techniques. Both Agrian and Sirrus provide directed sampling functions, I specifically liked being able to set up a grid on site and sample immediately. From the aspect of a private consultant, I felt it would be extremely important to be able to share scouting reports and recommendations from the application in-field. Some of these were very simplistic emails others send PDFs.

This list shows the scouting functions of the applications reviewed.
As far as just “cleanness” and functionality of scouting goes, I personally really liked the scouting layout provided by OpenScout. I also gave good marks to AgraScout and Agrian for their user friendly interfaces.

The Open Scout layout during scouting was quite clean.
Personally I am a big fan of having pictures of the pest. Aker Scouts function of having images with their pick list was nice and I could see it really coming in handy. Better yet, when the pest was selected a detailed description was presented. AgraScout also had a nice function that when a pest was selected from the picklist an image of the pest would pop up. Unfortunately, at the time of testing this app had a bug and in the insect picklist the wrong insect often came up.
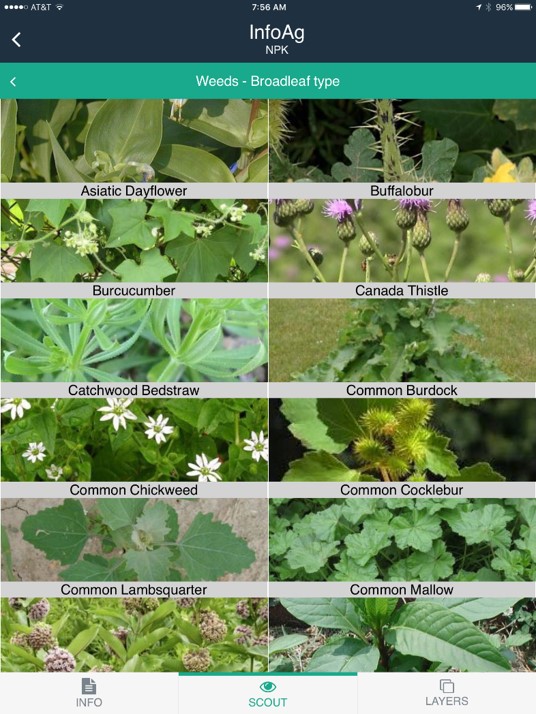
Aker Scout had images with each of its pest options.
First look at the ScoutPro I loved its function of a step wise pest selection tool to get too my problem. That said, after a few times it wore me out. I did not need this process to identify pigweed and johnsongrass, and felt it was forcing me to make more clicks than necessary.

Scout Pro takes users through a ID tool to help select proper pest.
The final function hearkens back to my precision ag background. Four of the applications provided the opportunity to build management zones, and from what I could determine from my versions, three of the applications could build and export shapefiles for application. With the image arms race so active right now, I also looked at which applications included satellite imagery. The five listed below are the ones that actively promote the purchase of imagery within the mobile or desktop applications.
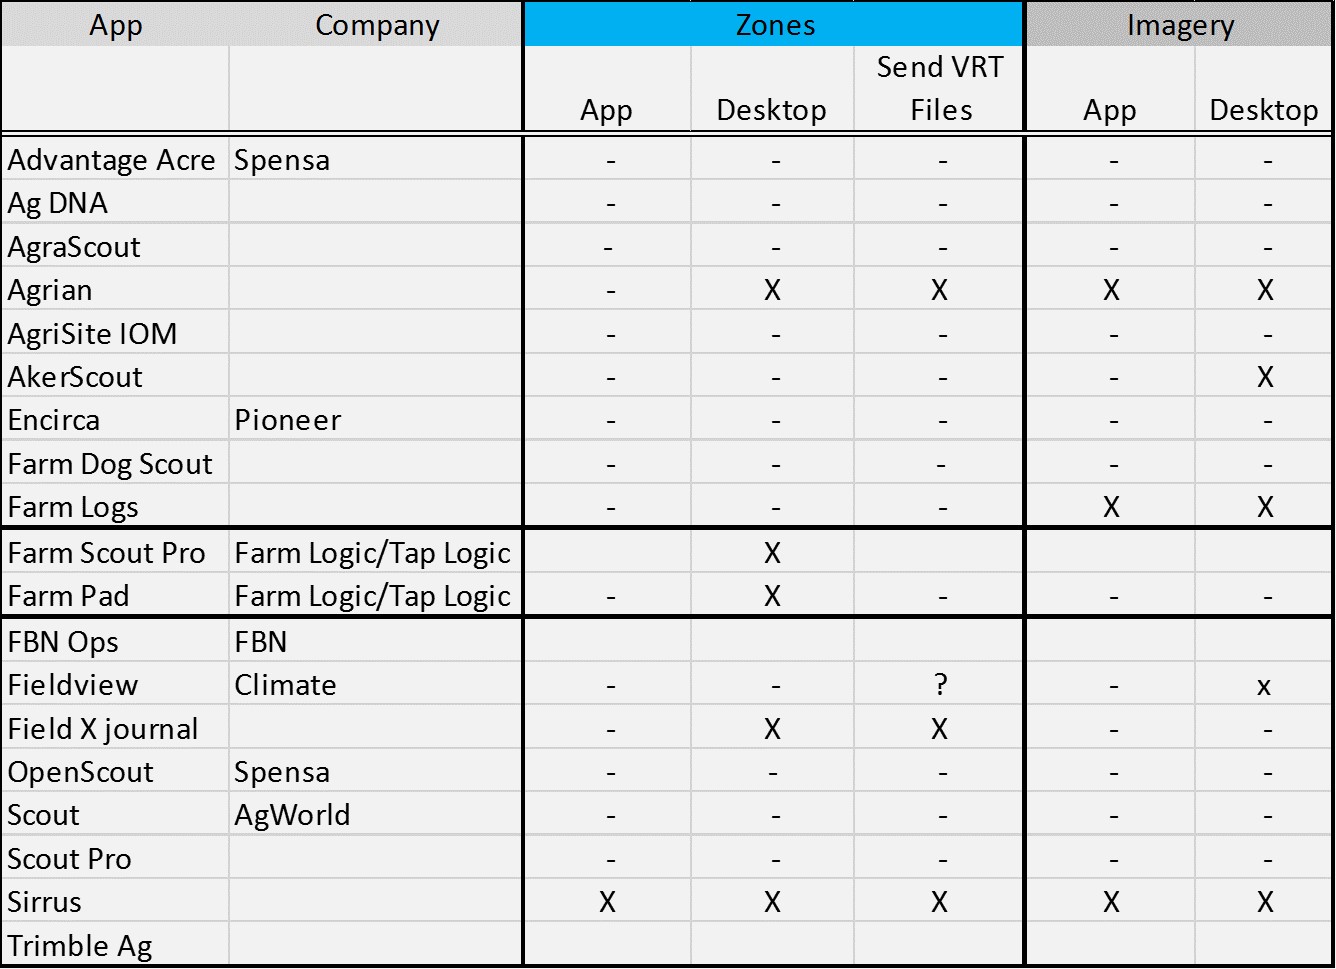
This table list the applications with can create management zones, send VRT files, and have access to satellite imagery.
The following are comments taken directly from my observations. I have left all notes in this, and in some cases you can see where I could not find a function, then later made a note that it was found.
- Advantage Acre
- Field Select, Auto via image or drop points.
- Nice desktop weather.
- In-field crop info limited.
- Like mobile app scouting functionality
- AgDNA
- Trying to set up activity, app shut down
- Cant set up activity without machinery
- Took a while to set up boundaries on app, figured out later.
- List incomplete, no Crabgrass
- No search items (weeds/pest)
- Has a way to document impassable spots
- Recording software. Does a great job of recording activities.
- AgraScout
- Can only add crop and planting date
- Looks like you can schedule scouting from desktop
- Dropping pins not that precise.
- If adding in field, cannot scout immediately as it needs assignment.
- Don’t save unless done, locks out event
- Touch issues with corn ear worm (did not bring up ear worm)
- Thinks a lot
- I like the image showing up after the select
- Agronomic Manager App, not one would suggest for private consultant.
- Agrian
- Email notes on single pin,
- does not look like whole scouting trip.
- emails nice PDF
- Finding SURGO Not Easy
- Label available.
- CCA Ready
- AgriSite IPM
- Added fields easily,
- Trouble saving notes Growth Stage was blank, image loading errors.
- Did not always save notes
- Not very intuitive
- Option list was very short.
- Not a fan of the annotations noting method.
- Has Temp and Wind speed on screen
- AkerScout
- Seems like a good Manager/agronomist app.
- But not allow on the go field set up is a challenge.
- Farm Dog Scout
- Drops pins, not sure about after fact edit.
- While entering field data if you hit outside of box, you lose.
- Easily adds fields on site
- Has insect and disease list, no weeds.
- Farm Logs
- In App Auto field select.
- Not easy to edit.
- Shows soil type up front when adding field
- Can do from Ipad hooked to internet.
- Really like the image with item search Send Scout via web
- Financial Threat interesting
- Enicira
- Send notes
- Crazy long load time in web.
- Farm Dog Scout
- Drops pins, not sure about after fact edit.
- While entering field data if you hit outside of box, you lose.
- Easily adds fields on site
- Has insect and disease list, no weeds.
- Farm Logs
- In App Auto field select.
- Not easy to edit.
- Shows soil type up front when adding field
- Really nice data trends for rainfall and GDD
- Farm Pad-Tap Logic
- Don’t typically have demos, offered 1 few week then charge card.
- Did offer to provide a developers demo
- A bit clunky in app and Desktop but good functionality.
- FieldView
- Auto Selects boundaries, can not easily edit lines.
- In app adding Nitrogen Application cannot see N source, wont let save
- Field X
- Full Field Note taking,
- Geo Note a point reference app in beta.
- Manager Picklist, Extremely Extensive list.
- But Have to create pick list.
- OpenScout
- Needs internet to add from location.
- Very nice scouting function
- Nice infield use.
- AgWorld Scout
- 30 day fre trial.
- satellite view in app moves fast
- Desktop drops a pin, but think it needs shapefile.
- barcode scan
- Needs attributes set up by manager.
- Scout Pro
- Short period
- Love the ID, if I don’t know what I have,
- Don’t like going through steps to Get to something I know.
- Cant Select from Library
- Sirrus
- Has a buddy app, that the producer can use to see fields.
- Labels available
- Like the grid soil sample summary on field view
- Performs well for what I would expect a consultant to need,
- would work in a larger comp also.
- CCA ready.
- Sends PDF via email.
My final take home from this task was that I don’t want to have to do this again. It was a wonderful challenge that took a lot of time and energy, and I still only looked at 50% of the available applications. My comments to those looking for an app, reach out and try as many as possible. Every app has its own fit and there is no one size fits all. If you find one or two you like TAKE THE TRAINING, I know I missed aspects of many of these applications, but I was testing the intuitive nature of the programs. My comments to application developers, don’t forget the private consultant. I really don’t feel like many of the applications I tested had the independent consultant in mind. Instead they are targeting large groups, and this is understandable from a marketing stand point. Consider adding a function that, when a scout leaves the field, a note is sent to the producer notifying them that the field has been checked. I can see this being a great value added product, allowing the producer to immediately know that their scout is taking care of them.
Time to re-post an old post. Sorghum injuries from Pre-Emerge Herbicides
Based on a few recent text messages and emails I think it is time to revisit an older post about Corn and Sorghum injuries from pre-plant herbicides.
Direct link to the original post Recent Weather Causing Corn (and Sorghum) Injury From Pre-emerge Herbicides
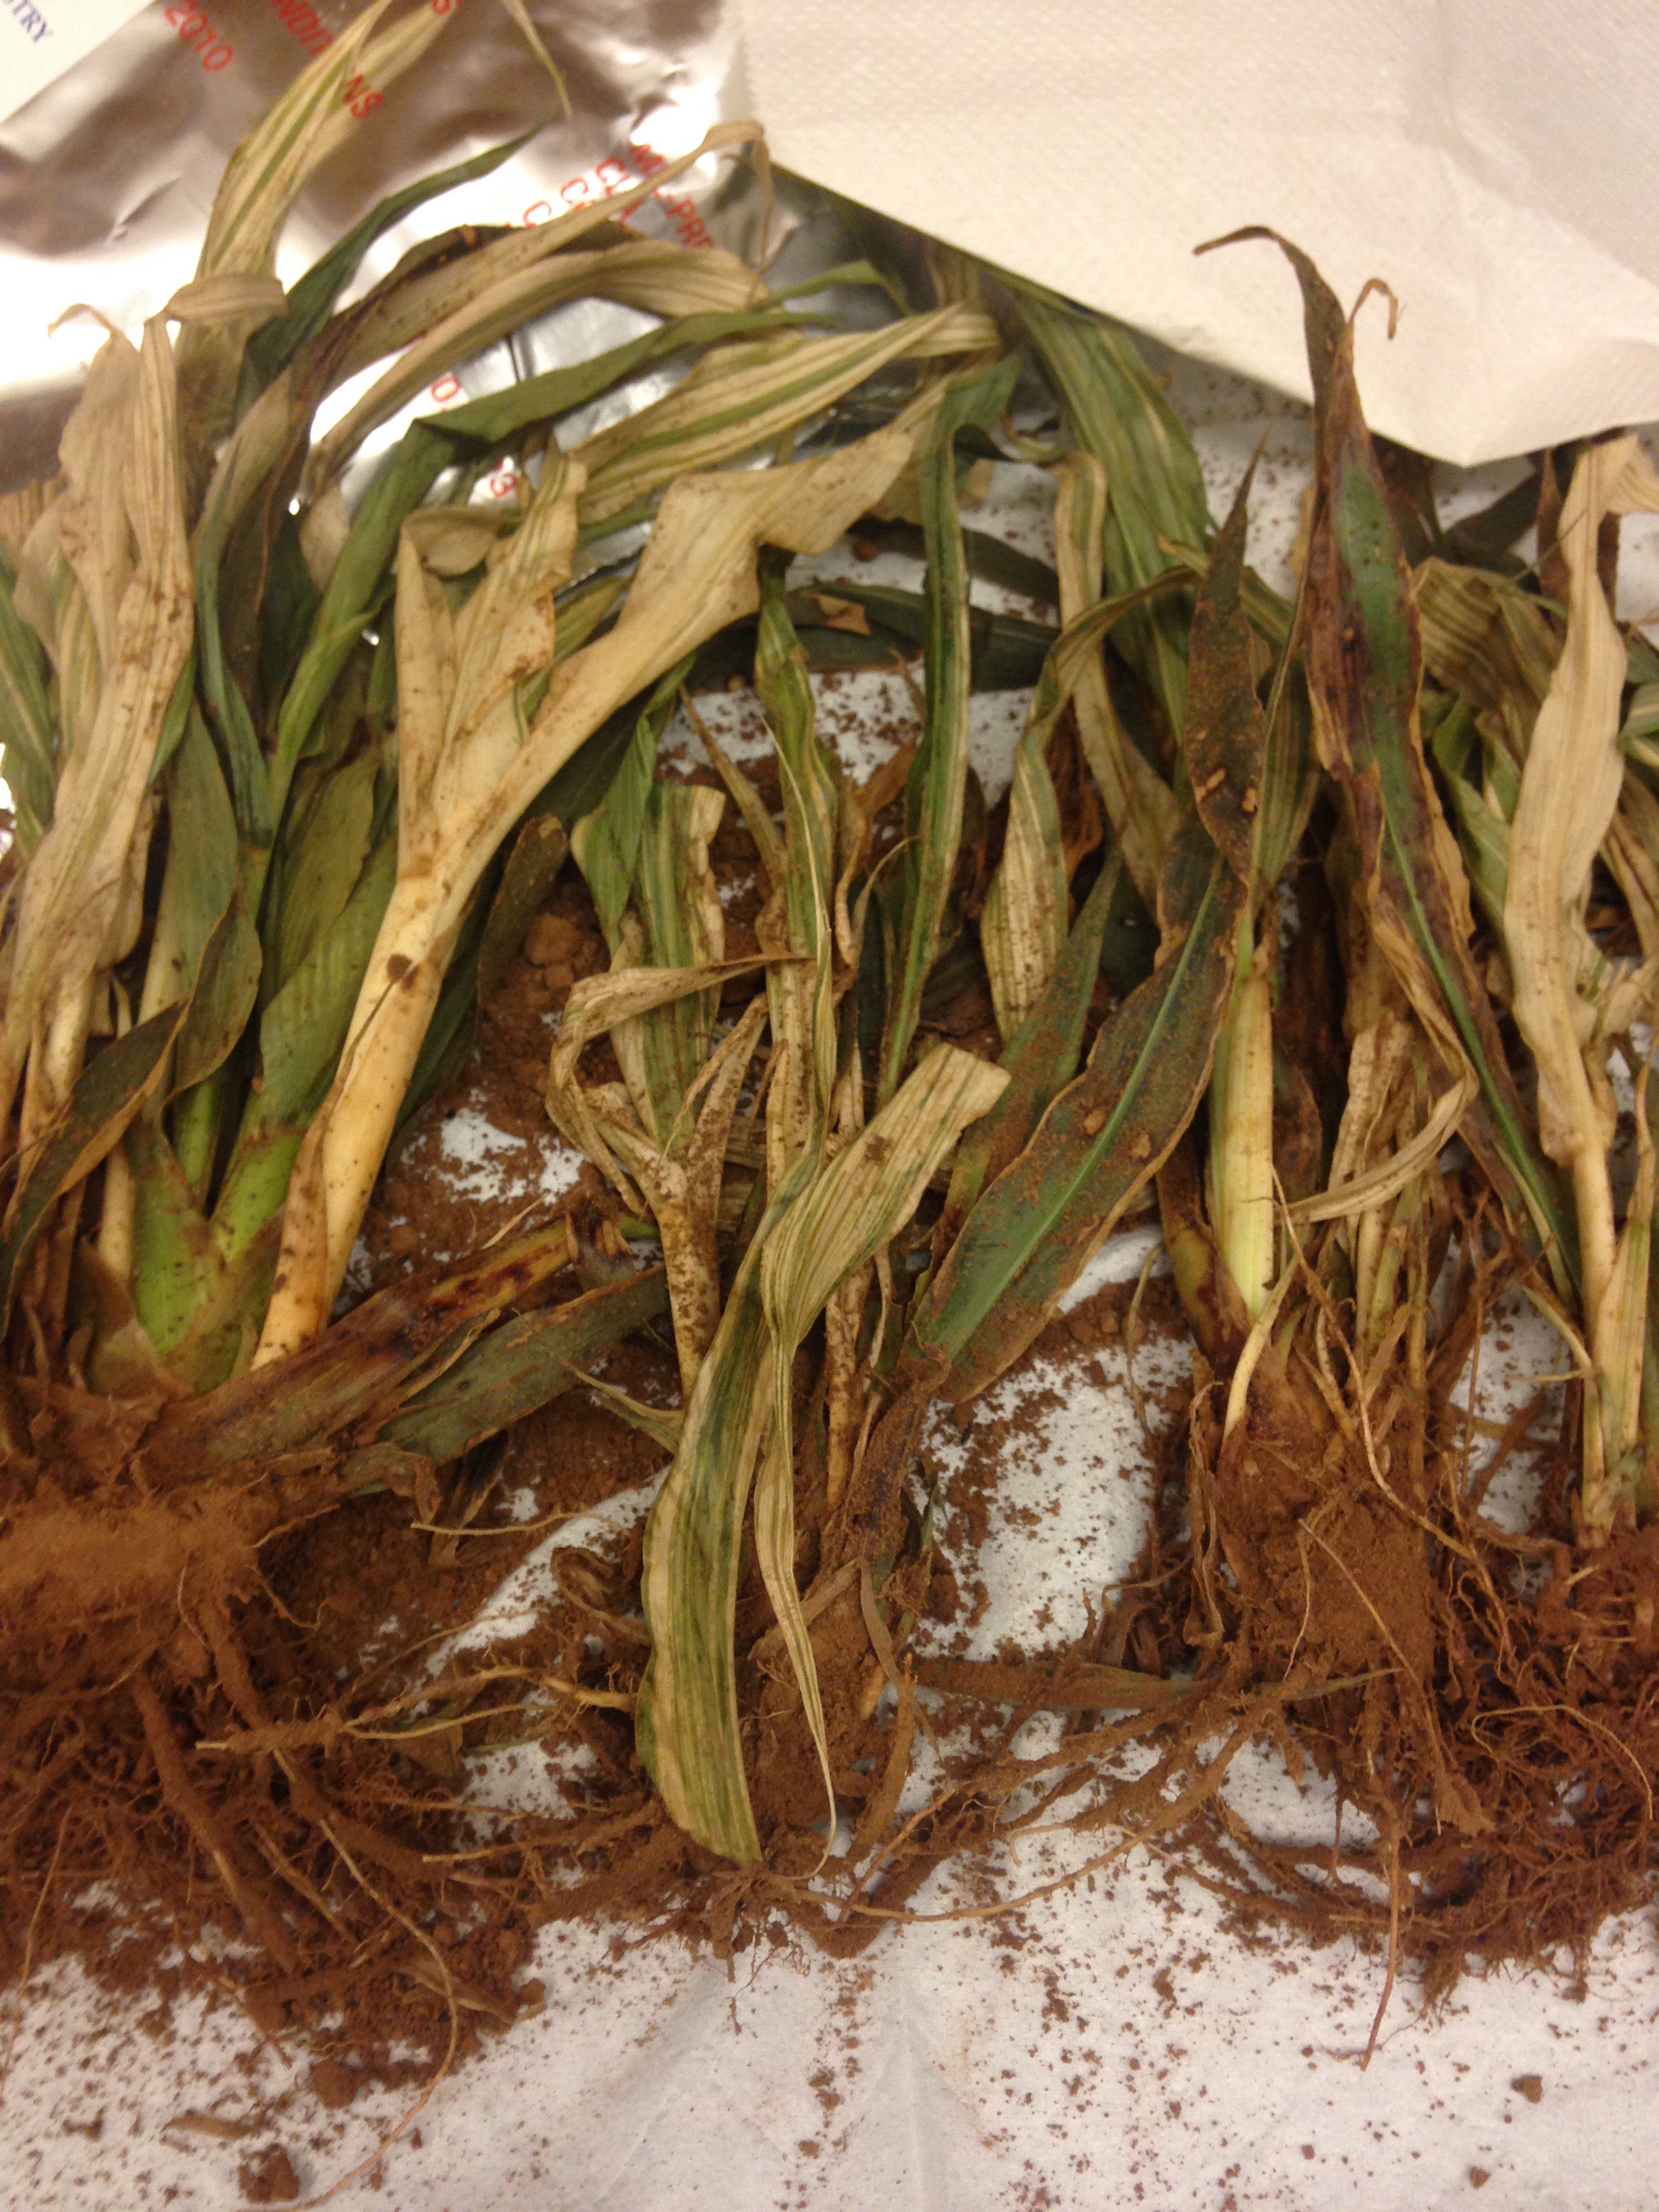
Sorghum with likely atrazine injury. Image courtesy Jana Slaughter

Comparing Ortho/Poly-Phosphate Ratios for In-Furrow Seed Safe Starter Fertilizer
Guest Author, Dr. Jake Vossenkemper; Agronomy Lead, Liquid Grow Fertilizer
New Research Comparing Ortho/Poly-Phosphate Ratios for In-Furrow Seed Safe Starter Fertilizers
Article Summary
- Ortho-phosphates are 100% plant available, but a high percentage of poly-phosphates in starter fertilizers convert to ortho-phosphate within just two days of application.
- This quick conversion from poly- to ortho-phosphate suggests expensive “high” ortho starter fertilizers are not likely to result in increased corn yields compared to seed-safe fluid starters containing a higher percentage of poly-phosphate.
- A field study conducted near Traer, IA in the 2016 growing season found less than 1 bu/ac yield difference between a 50/50 ortho:poly starter and high ortho-phosphate starter.
- High ortho starters cost more per acer than 50/50 ortho:poly starters, but do not increase corn grain yields.
Poly-phosphates Rapidly Convert to Plant available Ortho-Phosphates
Given poly-phosphates are not immediately plant available and ortho-phosphates are immediately plant available, this gives the promoters of “high” ortho-phosphate starters ample opportunity to muddy the waters. Nevertheless, the facts are that poly-phosphates are rather rapidly hydrolyzed (converted to) into ortho-phosphates once applied to soils, and this hydrolysis process generally takes just 48 hours or so to complete.
In Sept. of 2015, I posted a blog discussing some of the more technical reasons why the ratio of ortho- to poly-phosphates in starter fertilizers should have no impact on corn yields. For those that are interested in those more technical details, I encourage you to follow this link to the Sept. 2015 blog post: https://www.liqui-grow.com/farm-journal/.
While I was relatively certain that the ratio of ortho- to poly-phosphates in liquid starters should have no effect on corn yields, I decide to “test” this idea with a field trial in the 2016 growing season conducted near Traer, IA.
How the Field Trial Was Conducted
In this field trial, we used two starter products applied in-furrow at 6 gal/ac. Each starter had an NPK nutrient analysis of 6-24-6. The only difference between these two starters was the ratio of ortho- to poly-phosphate. One of these starters contained 80% ortho-phosphate and the other contained just 50% ortho-phosphate with the remainder of the phosphorous source in each of these two starters being poly-phosphate. Each plot was planted with a 24-row planter (Picture 1) and plot lengths were nearly 2400 ft. long. In total, there were 5 side-by-side comparisons of the two starter fertilizers that contained different ratios of ortho- to poly-phosphates.
Field Trial Results
In general, there were no large differences in yield between the two starters in any of the 5 side-by-side comparisons, except for comparison number 5 (Figure 1). In comparison number 5, the 50% ortho/50% poly-phosphate starter actually yielded 6 bu/ac more than the high ortho starter. But averaged over the 5 side-by-side comparisons, there was less than 1 bu/ac yield difference between the high and low ortho starters (P=0.6712).
In addition to finding no differences in grain yield between these two starters, the high ortho starters generally cost about $1 more per gallon (so $6/ac at a 6 gal/ac rate) than the low ortho starters. So the more expensive high ortho starter clearly did not “pay” its way in our 2016 field trial.
More Trials Planned for 2017
While our findings agree with other research-comparing ortho- and poly-phosphate starter fertilizers (Frazen and Gerwing. 1997), we want to be absolutely certain that our fertilizer offerings are the most economically viable products on the market. Therefore, I have decided to run this same field trial at one location in northern Illinois in 2017, and at one location in central Iowa in 2017. Stay tuned for those research results this fall.

Picture 1
Planting starter fertilizer trials near Traer, IA in the growing season of 2016.
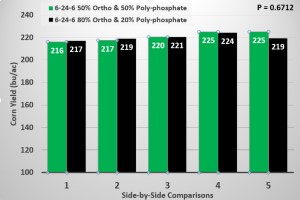
5 side-by-side comparisons of corn yield from two 6-24-6 starter fertilizers that contained either 50% ortho & 50% poly-phosphate or 80% ortho and 20% poly-phosphate. The field trial was conducted near Traer, IA in the growing season of 2016.
References
Franzen D. and J. Gerwing. 2007. Effectiveness of using low rates of plant nutrients. North Central regional research publication No. 341. http://www.extension.umn.edu/agriculture/nutrient-management/fertilizer-management/docs/Feb-97-1.pdf (accessed 8 of Sept 2015).
Nitrogen source selection, the dollars and cents.
A common question most soil fertility specialist receive goes along the lines of “Where anhydrous ammonia has been one of the cheapest N formulations available, dry fertilizers can also be competitive. From a cost and effectiveness perspective, which is going to be the better deal this year?” This question was recently posed to Agronomist Fields Notes of The Wheat Farmer/Row Crop Farmer produced by Layton Ehmke. What follows is a more in depth version of the response I provide to Layton.

WAKO NH3 applicator used for in-season application.
Unfortunately if all angles are considered this is not an easy answer as determining which nitrogen product is a multi-faceted issue.
First there is the easy aspect, N price. At the time of writing this the local quote at Two Rivers Link is
NH3: 82-0-0 $490 a ton / .30 $ lb N
Urea: 46-0-0 $340 a ton / .37 $ lb N
UAN: 28-0-0 $230 a ton / .41 $ lb N
So on the outside looking in at just the price per 100 pounds of N applied NH3 is $7.00 cheaper than Urea and $11.00 less than UAN.
However the second part of the equation is application cost. Looking at the custom rate for 2015-2016 provide in the OSU Current Report 205 which outlines Oklahoma Farm and Ranch Custom Rates. While these are higher than if the producer owns the equipment it is still a good estimate which accounts for time, service, and repair. The average NH3 application cost is $13.75 while spreading dry fertilizer is $5.41 per acre. The cost of running a sprayer is similar to sprMy Siteeader per acre. So if application and N cost is taken into account at 100 lbs N per acre NH3 is $1.34 cheaper. However the amount of N really impacts this last calculation at 50 lbs of N per acre urea is $4.84 per acre cheaper while at 200 lbs NH3 is $5.66 per acre cheaper.
The third consideration should be the efficiency of the fertilizer. I could and should right a blog solely on the efficiency of nitrogen fertilizer applications. However that is a big mud hole I do not quite have the time to get into. So what follows are a few general consideration. Spring applied urea on no-till will have a significantly higher potential for N loss, from urea volatilization, than NH3 knifed in. Surface applied urea not quickly incorporated in via rain or tillage (added cost) is easily subject to losses greater than 33%. While NH3 applied with proper soil moisture and good seal will have losses in the single digits. The losses from UAN is somewhere between Urea and NH3 as only 50% of the N in UAN is urea. Also method (steamer/flat fan), percent canopy coverage, residue level, and weather will play a part. However is all in is applied pre-plant and NH3 but urea or UAN is applied in season there may be more losses from NH3. The loss of N should be taken into account and added to the cost of N. Lost in could be estimated in two ways, the cost of replacing lost N or the cost of lost yield. To figure replacement take the pounds of N needed (100 lbs) divide by the efficiency, in this case lets say you will lose 20% so 100/.8 = 125. So to get 100 lbs of N to the crop you much apply 125, which increased total N cost to $46.25 per acre. On the flip side if you lose 20% of 100 lbs and needed all 100 lbs of N then you stand to lose (20 lbs N / 2 lbs N per bushel) 10 bushel at $4.00 per bushel.
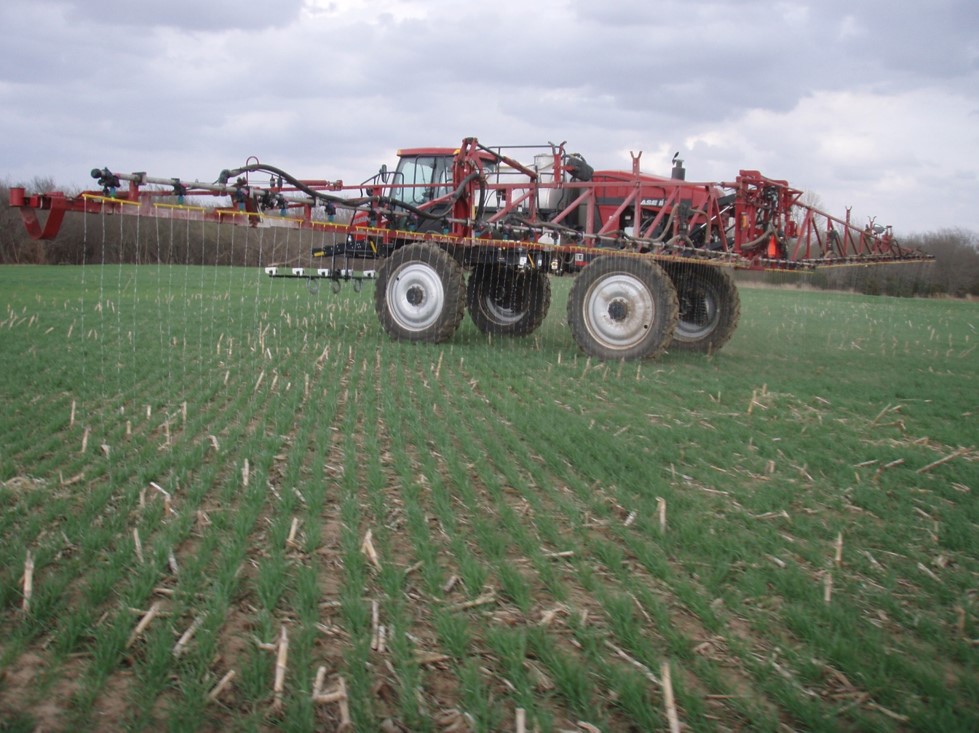
High clearance sprayer out fitted with streamer bars for UAN application and GreenSeeker RT-200 optical sensors for on the go variable rate nitrogen application.
The final consideration is the ease and or efficiency of use. Some will choose a high priced product because they would prefer not to work with NH3 due to its challenging properties. The ease of use is also where the liquids (UAN) shine. On sight storage of UAN requires the least amount of infrastructure and transport is fairly easy.
The application cost of liquid is nearly the same as dry so considering the prices above 100 lbs of N as UAN will cost $4.00 per acre more. However a 100’ sprayer can cover approximately 30 acres per hour more than a spreader with a 60’ swath (Iowa State Pub). Below is a table that provides a few common applicator widths and speeds. If you consider the average NH3 rig will run 6 mph while spinners commonly run at 12 mph, you can cover significantly more ground with urea. Add to the equation a big sprayer and flat long field and applicators can covers a lot of ground quickly with UAN. So if time is of the essences it makes perfect sense to spend more per pound of N to get it on faster.

Acres covered per hour based on width and speed. High speed not applicable for NH3 application.
In the end the right source often comes down to the specific situation, time, and personal preferences. If you take all of the variables into account, you will be making best decision possible based upon the information available.
If you have any questions or comments please feel free to contact me.
Brian Arnall
Precision Nutrient Management
b.arnall@okstate.edu
Using the GreenSeeker after Freeze Damage
After discussions with producers in southern Kansas I felt the need to bring back this past blog. It seems that much of (not all) the early planted wheat lost a significant amount of biomass during the winter and the N-Rich Strip GreenSeeker approach is producing what looks to be low yield potentials and N-Rate recommendations. This should be treated much like we do grazed wheat and the planting date should be adjusted, see below. It is also important to note that in the past year a new wheat calculator was added to the NUE Site. http://nue.okstate.edu/SBNRC/mesonet.php. Number 1 is the original OSU SBNRC but the #2 is calculator produced by a KSU/OSU cooperative project. This is the SBNRC I recommend for use in Kansas and much of the norther tier of counties in OK.
Original Blog on Freeze Damage and the GreenSeeker.
Dr. Jeff Edwards “OSUWheat” wrote about winter wheat freeze injury in a receive blog on World of Wheat, http://osuwheat.com/2013/12/19/freeze-injury/. As Dr. Edwards notes injury at this stage rarely impact yield, therefore the fertility requirements of the crop has not significantly changed. What will be impacted is how the N-Rich Strip and GreenSeeker™ sensor will be used. This not suggesting abandoning the technology in fact time has shown it can be just as accurate after tissue damage. It should be noted GreenSeeker™ NDVI readings should not be collected on a field that has recently been damaged.
A producer using the N-Rich Strip, GreenSeeker™, Sensor Based N-Rate Calculator approach on a field with freeze damage will need to consider a few points. First there need to be a recovery period after significant tissue damage; this may be one to two weeks of good growth. Sense areas that have had the same degree of damage as elevation and landscape position often impacts the level of damage. It would be misleading to sense a area in the N-Rich strip that was not significantly damaged but an area in the Farmer Practice that took a great deal of tissue loss.
Finally we must consider how the SBNRC, available online at http://nue.okstate.edu/SBNRC/mesonet.php, works. The calculator uses NDVI to estimate wheat biomass, which is directly related to grain yield. This predicted grain yield is then used to calculate nitrogen (N) rate. So if biomass is reduced, yield potential is reduced and N rate reduced. The same issue is seen in dual purpose whet production. So the approach that I recommend for the dual purpose guys is the same that I will recommend for those who experienced significant freeze damage. This should not be used for wheat with just minimal tip burn.
To account for the loss of biomass, but not yield, planting date needs to be adjusted to “trick” the calculator into thinking the crop is younger and has greater potential. Planting date should be move forward 7 or 14 days dependent For example the first screen shot shows what the SBNRC would recommend using the real planting date. In this case the potential yield is significantly underestimated.
The second and third screen shots show the impact of moving the planting date forward by 7 and 14 days respectively. Note the increase in yield potential, which is the agronomically correct potential for field considering soil and plant condition, and increase in recommended N-rate recommendation. Adjust the planting date, within the 7 to 14 day window, so that the yield potential YPN is at a level suitable to the field the yield condition and environment. The number of days adjusted is related to the size and amount of loss. The larger the wheat and or greater the biomass loss the further forward the planting date should be moved. In the example below YPN goes from 37 bu ac on the true planting date to 45 bu ac with a 14 day correction. The N-rate changes from 31 lbs to 38 lbs, this change may not be as much as you might expect. That is because YP0, yield without additional N, also increases from 26 to 32 bushel.
 Image 1. Planting date 9/1/2013. YPN 37 bu ac-1 and N-Rec 31 lbs ac-1.
 Image 2. Planting date 9/8/2013. YPN 40 bu ac-1 and N-Rec 34 lbs ac-1.
 Image 3. Planting date 9/15/2013. YPN 45 bu ac-1 and N-Rec 38 lbs ac-1.
This adjustment is only to be made when tissue has been lost or removed, not when you disagree with the yield potential. If you have any questions about N-Rich Strips, the GreenSeeker™, or the online SBNRC please feel free to contact me at b.arnall@okstate.edu or 405.744.1722.
The Sufficiency versus Replacement tipping point.
Being educated in the realm of Soil Fertility at Oklahoma State University by the likes of Dr Gordon Johnson and Dr. Bill Raun, Brays Nutrient Mobility Concept and Mitscherlich’s Percent Sufficiency Concept are ingrained in my psyche. In class the concept of Build and Maintain for phosphorus fertilizer management was just briefly visited and not discussed as a viable option. For anyone in the corn belt, and some Okies, reading this that may seem unusual. But when I was in school on average in Oklahoma there was about 100-200 K acres of 100 120 bpa (bushel per acre) corn, 300-400 K acres of 40-50 bpa sorghum, and over 5 million acres of 20-30 bpa wheat. In a state with those average yields, replacing P removed by the crop was not a major concern.
But times are changing. There is more corn and soybean planted and the achievable yields of all crop are increasing. While the average winter wheat producer should not be worried about replacement rates of P there is a growing group of producers that should. This blog will discuss the scenarios in which sufficiency rates are best and those in which replacement should be considered. The OSU factsheet PSS-2266 goes in-depth on each of these methods.
Applying P based on sufficiency will increase soil test P levels in a low yielding environment. For example on a 20 bpa wheat field that starts out with a soil test P level of 0. Using the sufficiency recommendation each year the soil test value will reach 20 ppm (40 STP) in 20 years. A 30 bpa field would take 30 years. Yes that is a long time but the soil test value is increasing a little each year. The point of 20 ppm is important because at that level the crop is 95% sufficient, meaning if no P is added the crop will only reach 95% of the fields yield potential.
Using a mass balance approach we can determine at what point does the crop remove more than we can supply with in or near furrow starter fertilizer. Table 1 shows the values I am using for the discussion. The first column is just the average amount of P removed per bushel of grain, most of our grains fall in the .4 to .5 lbs P per bushel range. The second column is the soil test value at which P level is said to be at 90% sufficient. The reason this column is included is that the P2O5 reccomendation for this P level fits into the starter rate for all crops. The low high starter rates are the typical range of P2O5 that is delivered within the safe range (N based) and what I see as the common rates. These values may be above or below what you use.

Table 1. Values used to create Table 2. Phosphorus per bushel of grain. Mehlich 3 soil test value (ppm) at which crop is determined to be 90% sufficient, typical range of P2O5 applied with starter fertilizers, recommended P2O5 rate when soil test P is at 90% sufficiency.
Table 2 is pretty simple but it is the center point of this article. The one caveat I need to add is this assumes strip till or 2*2 / 3*2 is not being used. Table 2 is using the starter range and removal value to determine the yield level the starter can support. The first take on this table may provide some hint on why in a state with 5 million acres of wheat averaging 36 BPA the state soil fertility specialist didn’t focus on replacement rates. In fact for most for most the the wheat ground P application is higher than removal and P levels are slowly increasing. The big take home from this table should be is my yield level outside this window? If so do not immediately go out in crease your P rates but do take a close look at your system as a whole. Take a close look at your cropping system, not just one seasons but look at a three or four year cycle. Add up P applied and P removed, are you positive or negative net balance? If you are negative take a long hard look at your soil test over time. Some soils can supply a large amount of P even if you are removing more than you apply. Other soils will be rapidly drawn down. Regualr soil testing allows for producers to keep an eye on these values.

Table 2. Yield level (bushels per acre) at which P removal is equal to P added in starter fertilizer application.
In the end even if the production warrants the use of replacement rates, the current market may not. For more on that read https://osunpk.com/2016/08/27/now-may-not-be-the-time-for-replacement/.
Speaking of market currently both soybeans and cotton are getting a lot of attention due to how the economics is penciling out. Soybean is a “heavy” P crop pulls .8 lbs per bpa while cotton removes 13 lbs per bales. Both of these crops are salt sensitive and the rate of inforrow is typically quite low providing only about 6 lbs when on 30″ rows. If you are growing beans or cotton make sure you account for their removal when you talley up your system.
Below is a table that I wanted to add, well because I like it. This table illustrates that buildup, and drawdown, rate is heavily impacted by existing soil test value. In short it takes a lot more fertilizer P to raise soil test p levels in a very low P testing field than it does when soil test P is closer to optimum, 19 lbs per 1 lb at STP of 10 and 5 lbs per lb when STP is 65. The exact rate changes by soil type and the same holds true to drawn down via crop removal.

Amount of P2O5 above crop removal needed to increase soil test phosphorous based upon initial soil test results.
Adapted From http://www.spectrumanalytic.com/support/library/ff/Soil_test_P_and_K_buildup_and_drawdown.htm “Drawdown of Soil Test Phosphorus and Potassium Levels by Alfalfa, K.L. Wells & J.E. Dollarhide, Univ. of Kentucky, Soil Science News & Views, Vol. 21, No. 3, 2000”
Any questions or comments? Feel free to contact me at b.arnall@okstate.edu
Components of a variable rate nitrogen recomendation
I recently wrote a article for the Crops and Soils magazine on the components of a Variable Rate Nitrogen Recommendation. The people at the American Society of Agronomy headquarters were kind enough to make it open access. What follows in this blog is just a highlight reel. For the full article visit https://dl.sciencesocieties.org/publications/cns/articles/49/6/24
Components of a variable rate nitrogen recommendation
Variable-rate nitrogen management (VRN) is a fairly hot topic right now. The outcome of VRN promises improved efficiencies, economics, yields, and environmental sustainability. As the scientific community learns more about the crop’s response to fertilizer nitrogen and the soil’s ability to provide nitrogen, the complexity of providing VRN recommendations, which both maximize profitability and minimize environmental risk, becomes more evident.
The components of nitrogen fertilizer recommendations are the same whether it is for a field flat rate or a variable-rate map. The basis for all N recommendations can be traced back to the Stanford equation (Stanford, 1973). At first glance, the Stanford equation is very basic and fairly elegant with only three variables in the equation.

Historically, this was accomplished on a field level through yield goal estimates and soil test nitrate values. The generalized conversions such as 1.2 lb N/bu of corn and 2.0 lb N/bu of winter wheat took account for Ncrop and efert to simplify the process.
NCrop
The basis for Ncrop is grain yield × grain N concentration. As grain N is fairly consistent, the goal of VRN methods is to identify grain yield. This is achieved through yield monitor data, remote sensing and crop models.
NSoil
The N provided by, or in some cases removed by, the soil is dynamic and often weather dependent. Kindred et al. (2014) documented the amount of N supplied by the soil varied spatially by 107, 67, and 54 lb/ac across three studies. Much of the soil N concentration is controlled by OM. For every 1% OM in the top 6 inches of the soil profile, there is approximately 1,000 lb N/ac.
efert
Historically, the efficiency at which N fertilizer is utilized was integrated into N recommendations and not provided as an input option, e.g., the general conversion factor for corn of 1.2 lb N/bu. Nitrogen concentration in corn grain ranges from 1.23–1.46% with an average of 1.31% (Heckman et al., 2003) or 0.73 lb N/bu. Therefore, the 1.2-lb value is assuming a 60% fertilizer use efficiency. More recently, recommendations have been to incorporate application method or timing factors in attempt to account for efficiencies.
Summary
While a VRN strategy that works across all regions, landscapes, and cropping systems has yet to be developed, the process of nitrogen management has greatly improved and is evolving almost daily. Those methods that are capable of determining the three inputs of the Stanford equation while incorporating regional specificity will capture the greatest level of accuracy and precision. Ferguson et al. (2002) suggested that improved recommendation algorithms may often need to be combined with methods (such as remote sensing) to detect crop N status at early, critical growth stages followed by carefully timed, spatially adjusted supplemental fertilization to achieve optimum N use efficiency. As information and data are gathered and incorporated and data-processing systems improve in both capacity and speed, the likelihood of significantly increasing nitrogen use efficiency for the benefit of the society and industry improves. The goal of all practitioners is to improve upon the efficiencies and economics of the system, and this should be kept in mind as new techniques and methods are evaluated. This improvement can be as small as a few percentages
This article is published in the Crops and Soils Magazine doi:10.2134/cs2016-49-0609. The full article includes more details on the components plus concepts of integration.
Precision Nutrient Management in Forage Systems
Published in Progressive Forage http://www.progressiveforage.com/ 9.1.2016
First, let’s agree the term “precision” is relative. Forage is a diverse system with an even more diverse set of management strategies. Regardless, every manager should be constantly striving to improve the precision in which nutrients are managed. The ultimate goal of any precision nutrient management tool should be this: producing the highest quality output (in this case forage) with the least amount of input – ultimately, optimizing efficiencies and maximizing profits. Within this readership there are those who are soil sampling at a 1-acre resolution and others who have likely not pulled a soil sample in the past decade. For both spectrums we can make improvements – let’s start basic and move forward.
A soil sample should the basis for all nutrient management decisions. Is soil testing a perfected science? No, far from it. However, there must be a starting point. A soil sample is that first bit of information we can start with and the basic data collection for precision ag to make improved management decisions. When fertilizer is applied without a recent soil sample, it is done based upon pure guesswork. How many other management decisions are made on a farm or ranch by a guess?
The composite soil sample is a great start, but it is just that – a start. While there are some soils that are very uniform most are extremely variable. In a survey of 178 fields in the southern Great Plains on average the soil pH was 6.12; phosphorus (Mehlich 3 phosphorus [M3P] and Bray 1 phosphorus [B1P]) was 28 ppm while soil test potassium averaged 196 ppm. So on the average the primary components of soil fertility were okay. However, on average the 178 fields had a range in soil pH of 1.8 units, M3P and B1P both had range of a 52 ppm and STK had a range of 180 ppm.
Table 1 shows the minimum and maximum soil test values for the 178 fields.
| Average | Range | Min | Max | |
| Soil pH | 6.12 | 1.77 | 5.23 | 7.01 |
| Phosphorus | 28 | 52 | 2 | 54 |
| Potassium | 197 | 180 | 107 | 287 |
| Sulfur | 15 | 24 | 3 | 27 |
| Organic matter | 1.9 | 1.2 | 1.3 | 2.5 |
This data helps support the concept that we should find ways to increase the resolution or decrease the number of acres represented by a single soil sample. Increasing soil sample resolution is typically done using one or two methods – zone or by grid.
Zone sampling
The basis of a zone sample is creating a smaller field. The biggest question with zones is how to draw the lines. There are dozens, if not hundreds, of possible methods, each having their own reasons and benefits. My basic recommendation is that before lines are drawn goals have to be established. For example, if phosphorus or soil pH management is important, the basis for the lines should be soil based. This could be based on soils map, soil texture, slope and on and on. If the target is improved nitrogen management, then the reason for drawing lines should be yield based. This could be based on yield maps, aerial images, historic knowledge or many soil parameters.
Why does it matter? Two reasons: First, across the broad spectrum of soils and environments two nutrients are hardly spatially correlated, which means the zone that is best at describing phosphorus variability does an extremely poor job describing potassium variability. Second, more theoretically the demand for nutrients are driven by different factors. Phosphorus (a soil immobile nutrient) fertilizer need is driven by the soil P concentration (look up Brays Sufficiency Concept). Many use yield as a parameter for phosphorus application, but this is not a plant need or even a yield maximizing practice. Fertilizing based on removal is done to prevent nutrient mining. However, nitrogen (a nutrient mobile in the soil) fertilizer need is based on yield and crop removal. Hence, the common Land Grant University N and sulfur recommendations are yield goal based.
Grid sampling
To be honest even the experts disagree on the hows, whys and ifs of grid sampling. I like data, therefore I naturally lean towards grid sampling if the field warrants it. For me, the biggest benefit of grid over zone sampling is that soils data from zone samples are biased to whatever parameter was set for the zone and therefore any resulting map for all nutrients must reflect the original zones. In a grid, each data point is independent therefore the maps of each nutrient can be independent, and (the science tells us) in most cases nutrients are independent of each other.
Ideally two pieces of information are available for determining whether a field is grid sampled or not. The first piece of information is a yield map from any previous crop. If yield is fairly uniform, I question the need for variable rate management, much less the expense of grid sampling. Regardless of the sampling method zone or grid, the discussion is moot if spatial variability does not exist across the field. However, many forage producers may not have access to this kind of data.
One of the most useful decision aid tools for grid sampling is the composite soil sample. The reason is simple statistics: A composite sample should be a representative average of the field. If the data is normally distributed, that means half of the field is above and half the field is below the sample average. So the optimum fields to grid are those in which an input falls at the point in which the benefit of applying is in question, because it suggests that approximately half the field needs the inputs while the other half likely does not. It is in this scenario that the return on investment can be greatest. As with pH, for example, fields with a very low value should have a flat broadcast application and should be sampled again at a later date. Fields with a composite pH well above 6.0 will unlikely have enough acres needing lime to warrant sending out an applicator.
Is grid sampling a lifelong activity? No. The initial activity of grid sampling will provide both an indicator of the variability level and overall needs of the field. From that point, decisions can be made and actions taken. Identify the greatest limiting factor in the field based on the samples, and focus on impacting change upon it. Zone sampling in subsequent years can be utilized to document change. When that issue is resolved, move to the next factor. It may require grid sampling again or using the original grid to develop new management zones. For instance, if the greatest issue first identified on the field is soil acidity then after the soil pH is neutralized the field should be grid sampled again. The reason is for this is that changing soil pH will influence many nutrients and the amount of change is not consistent but dependent upon many other factors.
In precision ag we tend to look at layers, yield, soil, etc. However, none of these tell the whole story independently. An area in a field may have moderate soil fertility and be under producing. Using the data collected the decision may be made to increase inputs; yet, the issue is a shallow restrictive layer limiting production. Therefore, the extra inputs will be of no benefit and could even further reduce production. It is at this point I like to bring out the importance of “getting dirty.” There is no technology that can take the place of “boots on the ground” agronomy.
For producers who have historically preformed intensive soil sampling there is still room for improvement. Soil testing and nutrient management is not an exact science; in fact, it was originally built for broad sweeping, statewide recommendations. As technology advances and inputs can be applied at sub-acre resolutions, all of the environment (weather, soil) by genotype inactions becomes more evident.
The next step in precision ag is to develop recommendations by upon site specific crop responses. This is where nutrient response strips can further improve nutrient use efficiencies and crop production. In Oklahoma, nitrogen-rich strips are applied across fields (grain and forage) to determine in-season nitrogen needs. Having a strip in the field with 50 to 100 extra units of N acts as a management tool which takes into account soil, environment and plant need. If the strip is visible the field or zone needs more N, if it is not visible then the crop is not deficient and at that point in the season does not need more N. Producers have taken this approach for N and adopted it for P and K with strips across the field with a zero and high rate of either nutrient. After a few seasons, responsive and non-responsive zones are developed and P and K applications are managed accordingly.
One misconception of precision ag is that the end result should be a field with uniform yield from one corner to the other. This is often not the case; in fact, in many cases the variability in production across the field can be increased. Theoretically, precision ag is applying inputs at the right rate in the right place. This means areas of the field which are yield limited due to underlying factors which cannot be managed have a reduction in inputs with no effect on yield. Other areas of the field have not been managed for maximum production therefore an increase inputs result in increasing yield widening the gap between the low and high yield levels.
Regardless of where a producer currently sets on the technology curve, there are potential ways to increase productivity and efficiency. There is nothing wrong with taking baby steps; it is often the simple things that lead to the greatest return.

