Home » Precision Ag
Category Archives: Precision Ag

Using soil moisture trend values from moisture sensors for irrigation decisions
Sumit Sharma, Extension Specialist for High Plains Irrigation and Water Management
Kevin Wagner, Director, Oklahoma Water Resources Center
Sumon Datta, Irrigation Engineer, BAE.
Sensor based and data driven irrigation scheduling has gained interest in irrigated agriculture around the world, especially in semi-arid areas because of the easy availability of commercial irrigation scheduler technology such as soil moisture sensors and crop models. Moisture sensing has particularly gained interest among the agriculture community due to ease of availability of the sensors to the producers, affordable costs, and easy to use graphical user interface. Economic potential of sensors in saving irrigation costs, data interpretation training through extension education programs, and policy initiatives have also helped with adoption of the sensors, especially in the United States. However, sensor adoption and efficient use can still be challenging due to poor data interpretation, steep learning curves, overly high expectations and subscription costs. This blog briefly discusses scenarios where sensors can be helpful in irrigated agriculture. For moisture sensor types, functioning and installation, readers are referred to BAE-1543 OSU extension factsheet.

Irrigation Scheduling
Irrigation scheduling with soil moisture sensors follows traditional principles of field capacity (FC), plant available water, maximum allowable depletion (MAD), and permanent wilting point (PWP). Figure 1 shows the transition of soil moisture level from field capacity to MAD, and to permanent wilting point in a typical soil. The maximum amount of water that a soil can hold after draining the excess moisture is called field capacity. At this point, all the water in soil is available to the plants. As the moisture content in the soil declines, it becomes more difficult for the plants to extract moisture from the soil. The soil moisture level below which the available moisture in soil cannot meet the plant’s water requirement is called the MAD. The water stress that occurs once moisture level goes below this moisture level can cause yield reductions in crops. Therefore, irrigation should be triggered as soon as the soil moisture level approaches this point (MAD) to avoid any yield losses (for detailed information on MAD, its value for different soils and crops, and irrigation scheduling, readers are referred to BAE-1537). Modern soil moisture sensors can come self-calibrated and are equipped with water stress threshold levels for different crops to avoid water stress or overwatering (Figure 2). These decisions are useful in furrow and drip irrigation systems where irrigation triggers can be synchronized with MAD values.


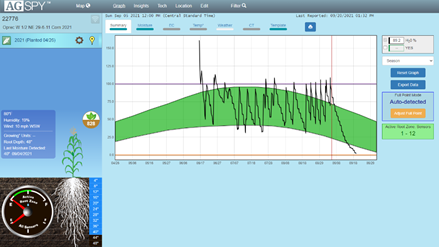
Figure 2: Screenshots of graphic user interface of three sensors a) GroGuru b) Sentek c) Aquaspy (Top to bottom) with threshold levels for soil moisture conditions. Aquspy and Sentek credits: Sumit Sharma. GroGuru image credits: groguru.com
Soil Moisture Trends and Irrigation Depths
Soil moisture sensors can help make data-informed decisions about scheduling irrigation. Previous studies have shown that the moisture values may vary from one sensor to the other and may not represent the exact moisture levels in soil. However, all soil moisture sensors exhibit trends in recharge and decline in soil moisture conditions. These real time soil moisture trends can be used to make informed decisions to adjust irrigation and improve water use efficiency. In high ET demand environments of Oklahoma, pivots are usually not turned off during the peak growing season, yet sensors can help in making decisions for early as well as late growing periods.
One of the easiest adjustments that could be made using soil moisture sensor data is the adjustment of irrigation depth. In an ideal situation, every irrigation event should recharge the soil profile to field capacity; however, this is often limited by the crops’ water demand and the well/irrigation capacity to replenish soil moisture levels. Each peak in soil moisture detected by sensors shows irrigation or rain, which ideally should be bringing moisture to same level after irrigation. However, reduction in moisture peaks in the soil moisture profile with every irrigation often indicates greater crop water demand than what is replenished with irrigation. In such scenarios, as allowed by capacity and infiltration rates, the irrigation depth can be increased. These trend values are particularly useful for center pivot irrigation systems, where triggering irrigation based on MAD might lag due to time and space bound rotations of the pivots in Oklahoma weather conditions.

Figure 3: A screenshot from Aquaspy agspy moisture sensor showing moisture at 8” (blue) and 28” (red) with each irrigation event. Data and image credit: Sumit Sharma
Last irrigation can be a tricky decision to end the cropping season. For summer crops, this is the time when crop ET demand is declining due to decline in green biomass and cooler weather patterns. Similar moisture trends can be used to make decisions for the last irrigation events, which can be skipped or reduced if the profile moisture is good, or can be provided if profile moisture is low. This is important because in an ideal situation, one would want to end the season with a relatively drier profile to capture and store off-season rains. Additionally, saving water on last irrigation can save operational cost and potentially cover the cost of moisture sensor subscriptions.
These decisions can be illustrated with Figure 3, which shows the trends of declining and recharging in a soil profile under corn at 8- and 28-inch depth. This field was irrigated with a center pivot irrigation system which was putting 1-1.25 inches of water with each irrigation event; however, the peak water recharge rate at both depths was declining with each irrigation. This coincided with peak growth period indicating rising ET demand of the crop than what was replenished by the irrigation. Later, two rain events, in addition to irrigation, replenished soil moisture in both layers. As the pivot was already running at a slow speed, slowing it further was not an option without triggering runoff for this soil type and this well capacity. Further in the season, when the crop started to senesce and ET demand declined, each irrigation event added to the moisture level of the soil. This allowed the producer to shut down the pivot between 70% starch line and physiological maturity for the crop to sustain at a relatively wet soil profile and leave the soil in relatively drier profile for the off-season.
In high ET demanding conditions of Western Oklahoma, crops often rely on moisture stored in deep soil profiles during the peak ET period when well capacities can’t keep up with crop water demand. In the high ET demanding environments of Oklahoma, irrigated agriculture depends heavily on profile moisture storage. Declining soil profile moisture is common during peak ET periods in high water demanding crops such as corn. These observations are useful if one starts the season with considerable moisture in the soil profile, however such trends may be absent if the season is started with a dry soil profile. Dry soil profiles can be recharged early in the season with pre-irrigation or deeper early irrigations (if allowed by the infiltration rate of the soil), when crop ET demand is low, to build the soil moisture profile. As such, sensors can be used in reducing the irrigation depth or skipping irrigation in early cropping systems if one starts with a full profile. This usually allows root growth through the profile to chase the moisture in deeper layers. It should be noted that the roots will grow and chase moisture only if there is a wet profile, and not through a dry soil profile.
Sensor installation and calibration are important for efficient use of these devices in irrigation decision making. Poor installation can often lead to poor data and wrong decision making. Although modern sensors are self/factory calibrated, some do provide the option to adjust threshold levels manually based on field observations. Early installation of sensors can be useful in making informed decisions as soon as the season starts. For a more detailed analysis of proper sensor installation, refer to BAE-1543. Producers are encouraged to integrate other means of irrigation planning with soil moisture sensing, such as a push rob to probe the soil profile or OSU Mesonet’s irrigation planner to further validate the sensor data. Further, the cliente should consider their irrigation capacities before investing in soil moisture sensors, as sensors may always show a deficit in low well capacities which cannot meet crop’s water demand.
References:
Taghvaeian, S., D. Porter, J. Aguilar. 20221. Soil moisture-sensing systems for improving irrigation scheduling. BAE-1543. Oklahoma State Cooperative Extension. Available at: https://extension.okstate.edu/fact-sheets/soil-moisture-sensing-systems-for-improving-irrigation-scheduling.html
Datta, S., S. Taghvaeian, J. Stivers. Understanding soil water content and thresholds for irrigation management. BAE-1537. Oklahoma State Cooperative Extension. Available at: https://extension.okstate.edu/fact-sheets/understanding-soil-water-content-and-thresholds-for-irrigation-management.html
For more information please contact Sumit Sharma sumit.sharma@okstate.edu

Top-dress Wheat with P and K ??
Brian Arnall, Precision Nutrient Management Extension Specialist
Hunter Lovewell, Past PNM MS student.
Original Blog Name: Managing P and K in a wheat Double-crop Soybean System.
I planned to wait until the soybean yields came in to share the data from this project, but the wheat results are just too interesting this year.
So the trial posed the question, when is the best time to apply the phosphorus (P) and potassium (K) for the soybean crop in a wheat double crop soybean system, if any is needed above what is applied for the wheat crop. We applied the wheat’s P&K at establishment, but the soybeans P&K was applied either at wheat establishment, top-dress wheat timing, or post wheat harvest pre soybean planting. We used the sources of granular triple super phosphate (0-46-0) and potash (0-0-60) for all applications. We hypothesized the wheat crop would not benefit from the soybeans portion of P&K and that the top-dress application timing for the soybeans P&K would result in the greatest soybean yields.

So far, we have six site years with completed cycles with locations at the Eastern Research Station (ERS) near Haskell, Oklahoma, Ballagh Family Research Farm (BF) near Newkirk, Oklahoma, Skagg Family Farm (SF) near Lamont, Oklahoma, and Lake Carl Blackwell Research Farm (LCB) near Perry, Oklahoma. The research was conducted during the 2019-2020 growing season and the 2020-2021 growing season. For the 2021-2022 cycle we added two more locations one again on the Skagg Family farm and the second on a new cooperator, O’Neil Farms (OF) near Ponca City. For all locations no P or K was applied by the farmers at any point, but they did manage IPM. See location descriptions below.

The first two years of work is written up in Mr. Hunter Lovewell’s thesis titled “EFFECTS OF PHOSPHOROUS AND POTASSIUM APPLICATION TIMING ON A WHEAT DOUBLE-CROP SOYBEAN SYSTEM” which I can share with those interested. To be honest, Hunter had a couple tough seasons. Basically where wheat did well, beans typically failed and where you had good beans the previous wheat had failed. All the same he had some interesting results. What follows is pulled from his conclusions.
“While a significant response to the application of P and K was limited, the results show that there are environments in which the wheat crop can benefit from additional P and K fertilizer applied for the soybean crop. In the case of the soil (SF-SH) with low M3P and an acidic soil pH, the additional P applied during the winter wheat growing season, intended for soybeans, alleviated the aluminum toxicity issues with acidic pH, increasing wheat yields. Beyond the single location with low soil test P and pH no other significant response was found to the addition of and P. This may be explained in that most locations were only marginally deficient P and the majority of the varieties used in the study were considered to have acid soil tolerance. Penn and Arnall (2015) found that cultivars with aluminum tolerance had increased P use efficiency. The BF location showed a significant wheat grain yield response to the K fertilization, but the additional K applied for the soybean crop showed no benefit for the wheat crop. While there was no significant increase in soybean grain yield to the additional K fertilizer observations suggest that the application of K fertilizer for soybeans may be of benefit. As was mentioned before the double-crop system is susceptible to yield-limiting conditions, heat, and moisture, due to the maturity of the crop during the peak summer months. The soybean grain yields achieved in this study were all below the previous five-year yield average for all the locations. The low achieved yields and crop stress may have limited this study’s ability to identify a significant response to the application of fertilizer. “
So, one of the most interesting finding from the first six sites was that topdressing P increased yield of the wheat crop on the soil that had low pH and P. And since the P recs applied were only considering STP values and not soil pH, we had underapplied P for the wheat.
Now moving on to the 2021-22 season. Well as most of the famers know, this season has been a doozy. That said, we were not able to establish the treatments until February 1st. Therefor in the case of the 2021-22 wheat season the first application of P&K was made at top-dress timing and then the second application was made post wheat harvest. So, we are unable to say how a preplant wheat P&K application would have performed. But the wheat grain yield response to P&K was better than I could have ever imagined.

The rain post application (Feb 1st) was marginal but better than other areas in the central/southern Plains. There was about 1” of precipitation in February, almost 3” in March and under 0.2” in April. May rains for the OF site near Burbank aided in allowing the yields to climb, maxed out at 82 bushels per acre, while the SF-Nfld missed out on many of the late rains and yields topped out at 39 bushels.

At both sites there is a clear and distinct response to P fertilizer. Note the N and NK treatments significantly lower than all other treatments. The last column on each figure title NPK is the average of all other treatments that only received the wheats P&K rate and had yet had the soybeans P&K applications.
We were able to statistically analyze the locations together by calculating a relative yield for each location. This is done by dividing the yield of each plot by the yield of the N only treatment, we did this for each replication. We then ran a t-test to look at significant treatment difference, so below any treatments that has the letters above the columns, such as an ab and b, are not statistically different at a 95% level.

The relative yield data was able to confirm that across both locations an application of P in February significantly increased yields at a consistent level of 30-50%. It is interesting that while the NP+K+ treatment almost sorts out as being statistically the highest.
While I am not even close to suggesting that you should delay application of P fertilizer in wheat production, I am a big fan of in-furrow applications, this work does point to opportunities. Such as the ability to return to the field after the wheat is up and apply broadcast P if perhaps you could not at planting. But specifically, the potential for in-season Variable Rate phosphorus based upon crop response, maybe a P-Rich strip. What I can tell you this means is that I have more work to do. First, I need a better understand of when and where this is possible. Then it is time to figure out how to use this to our advantage to more efficiently use P fertilizer.
I do want to reiterate, I am not suggesting to move away from Preplant P nor in-furrow.
Keep an eye out for the soybean data because hopefully we catch a few good rains and find out if the timing of P&K will impact the double crop yields.
I want to send a big Thank you to all the cooperators who have put up with me and my time over years to get this data and the Oklahoma Soybean Board for their continued support of this project.
Feel free to send any questions for comments my way at b.arnall@okstate.edu

Utilizing N fixing biologicals.
In the past couple years significant efforts have been made to produce N fixing microorganisms that can be utilized in an agriculture system. The atmosphere is 78% N2 and prokaryotic microorganisms such as the bacteria species Azotobacter, Bacillus, Clostridium, and Klebsiella take that N2 gas and turn it into plant available NH4. These organisms have been around providing nitrogen for plants, for as long as there has been plants. In agriculture we have heavily utilized their relationship with legumes however have struggled bringing them into other realms of production. Naturally they tend to be found in areas that are very low levels of nitrogen. For example, prokaryotes were found in the un-fertilized check of the 130-year-old Magruder Plots but are not found any other treatment that receives fertilizer organic or commercial.

Now there are several products marketed as containing N fixing microorganisms suited for use in today’s corn, sorghum, and wheat production. While I have an active research program evaluating the use of such materials in Oklahoma, this blog will not address what works or how well. This blog will touch upon my thoughts on how to utilize a technology such as this if you pull the trigger to implement.
So there is one key to getting a ROI on products that create plant available nitrogen, and it’s a really simple key.
Under Apply Nitrogen
If you apply enough or more N than the crops needs, then there is ZERO value in a product that creates more N. For example, applying one of these products in your 250-bushel yield goal corn after you’ve already laid down 300 lbs of N preplant. Unless you lose it all to leaching, your probability of seeing a ROI on your biological investment is pretty poor. I have a hard time understanding the thought process behind paying for a N fixing product and not lowering your fertilizer rate. I can see one of two reasons. 1) You believe you historically under apply N and are losing yield because of such 2) Are in an environment which has a high potential of late season N losses, and you are unable to make recovery applications.
So what to do if using a N Fixer? I do not have the confidence yet to say, “Apply X product, it will produce Y lbs of N, so cut your rate by Y lbs”. That uncertainty is one of the greatest challenges, not knowing will I get 10 lbs or 40 lbs? If I did, then I would just subtract that off my planned rate. Side note, as someone who has been doing on farm N rate studies for a decade plus, I would have to add that most were likely over applying by that much and could cut back anyways. For me the use of the N Fixers should force your hand into utilizing in-season N applications, regardless the crop. So that you can better predict or determine impact of the product.
This is where the use of a refence strip (N-Rich or Zero N) is the golden ticket. We need a way to quickly evaluate the amount of N the crop has access to. The N-Rich method works best when preplant N is drawn way back. I would add that reduced pre-plant is a great scenario for N Fixers. The N-Rich in comparison to the rest of the field will provide you guidance towards your in-season goals. If the N-Fixers are doing a great job the N-Rich will not be showing up any time soon and you can make your N rate adjustments accordingly. If you are a Pre-plant or die kind of farmer, then I say you need to pull back the reins on the preplant rate but give the N Fixers some room to add value and add in your Zero N strips. These will again let you observe what is happening in the soil apart from your fertilizer. If it is getting on the late side of in-season N and you cannot find your zero, might be a good time to walk away and hang up the fertilizer applicator keys. I have lots of blogs and pubs on the use of reference strip so send me a note if you want to dive further into these approaches.
Feel free to reach out with questions or comments. B.arnall@okstate.edu
Related Blogs
The Easy Button for Nitrogen…….
Brian Arnall, Precision Nutrient Management Extension Specialist.
The basics for nitrogen (N) fertilizer rate determination can be described in a mechanistic approach by the Stanford Equation NFert = ( NCrop – NSoil ) / Neff. This equations states that the N fertilizer rate is equal to the amount of nitrogen taken up by the crop minus the amount of nitrogen supply by the soil, divided by the efficiency of the nitrogen fertilizer used. I outline the importance of this equation in the blog “Components of a variable rate nitrogen recommendations“.

There are nitrogen “Easy Buttons” which utilizes averages collected over diverse environments to create accurate N rate recommendations. The best example of this is the yield goal rules of thumb such as wheats 2.0 lbs N per yield goal bushel minus soil test nitrate. Yield goals are generally calculated as the average of the best 3 out of 5 years, or the 5-year average times 20%. Also, the 2.0 lbs of N is more than what is in a bushel as it also adds in an efficiency factor or a 0.5 lbs per bushel cushion. This method and others like it provide an accurate N rate with slight probability of yield loss. However, the rec is often highly imprecise. Meaning that if I apply the method to 100 fields the average will be spot on, however if I look at the performance of the recommendation on a single field, I will likely be disappointed.

When it comes to nitrogen recommendations the Easy button method will use components which help ensure that the rate prescribed will maximize yield 90-95% of the time. For example, take the data presented in Figure 2. Over fifteen years of the long-term winter wheat fertility study near Lahoma, Oklahoma the average pounds of N per bushel to reach economic optimum nitrogen rate (EONR) was 1.6, however if 2.0 of N was applied per bushel yield would have been maximized 13 out of the 15 years. While 2.0 lbs. of N per bushel would have been quite accurate for maximizing yield, it would be highly imprecise as over the 15 years optimum pounds of N per bushel ranged from 0.0 to 3.2.

The trick to improving your N rate recommendation closer to a precise and accurate system is to obtain representative site-specific values for the Stanford Equation NFert = (NCrop – NSoil) / Neff.
Looking at the 15-year long-term data above the yields range from a low of 27 to a high of 88 bushels. Of those 15 years, I personally planted multiple years, usually sometime in October, and many of those years while sowing I could have guessed a range of 55-60 bushel, which just happened to be just above the 15-year average. It was not until February and March when the yield potential really started to express itself. Why, well there is a lot of weather between Oct to March, a lot of environmental positive and negative impacts on that final grain yield. This is the best timing to go out with approaches, models, or techniques to estimate yield potential for N rate recs.
While I am a big fan of soil testing, pre-plant soil samples for N are just a snap shot in time. But the While I am a big fan of soil testing, pre-plant soil samples for N are just a snapshot in time, but the nitrogen cycle Figure 3, will roar on after the soil sample is collected. Organic matter (OM) is the central component of this cycle and drives availability of NH4 and NO3 in the system. For each 1% OM in the top 6″ of the soil there is approximately 1000 lbs of organically bound N. The amount of N going into and out of OM pool is driven by C:N ratio of residues, soil temperature and soil moisture. While we very well what the mechanisms of the cycle are and can model the reactions quite well. Our inability to predict long term weather patterns is the greatest factor limiting our ability to predict future availability of NSoil.

This is where the reader should be asking “how can we get better site specific data” and I begin the discussion on why I have been promoting the of the Sensor Based Nitrogen Rate Calculator (SBNRC) and N-Rich strip method.
Lets talk about how the approach follows Stanford’s mechanistic approach to N management. First the Yield Potential component of the SBNRC which is related to NCrop. In effect researchers have built models over the past two decades that can correlate the NDVI collected from a sensor, such as the GreenSeeker, with the crops biomass and chlorophyll content. If given the number of days the crop has been growing it is possible to use the NDVI collected from the crop as a tool to predict final grain yield. The closer the wheat gets to hollow stem, or the corn gets to tassel, the better the prediction. One reason is that we have allowed more “environmental influence” to happen. Dr. Bill Raun, a founder of the SBNRC concept kept great discussion and data sets on his NUE.OKSTATE.edu website. On the “NUE Website on YP” he provides information on how yield prediction work while on the “NUE Website YP Library” he has not listed every algorithm created, and the math behind them, but also a recipe book for how anyone can create their own algorithm. While there are a lot post sensing stresses that can bring down final grain yield, the models that have been built and continually improved, do quite a good job on predicting final grain yield in-season. Resulting a much more site specific value for NCrop. The blog”Sensing the N-Rich Strip and Using the SBNRC” goes into a further discussion of using the online SBNRC.
That now leaves NSoil, which I will argue is at least as important as NCrop. As weather so greatly influences the nitrogen cycle it would be nice to have a weather station on every field paired with a 0-4 ft soil description which could be incorporated into a model. Given those might be out of reach we have found the the use of a reference strip, high N or low N, really provides an site specific estimate the of nitrogen the crop has access to. If the high N reference (N-Rich) strip is showing up that means the remainder of the field is N deficient. This may be due to losses or lack of mineralization, either way more N is needed. If the N-Rich strip is not evident then the crop is finding enough N outside of the reference strip to support its current growth. This could be that residual N or mineralization is high, or it could mean that crop growth and therefore N demand is low. Having the N check strip in each field allows for a season long evaluation. We can use NDVI to characterize how big or little of a response we have to N. We call this the Response Index (RI). An RI of 1.8 means that we could increase yield by 80% if we add adequate N, if the RI is 1.05 then we are looking at a potential increase of 5%. I have a previous blog which goes into the application of the reference strip. “Nitrogen Rich Strips, a Reminder“
Finally we combine the two, YP and RI. By predicting the yield of the area out side the N-Rich strip we can determine environmental yield potential, YP0. Basically what can the field yield if nothing is added. We multiple YP0 by the RI to get the yield potential with added N, YPN. Then its as simple as N rate = (YPN – YP0 ) x N needed per bushel. So for example if YP0 is 40 bushel RI =2, then YPN is 80 bushel. I need to fertilize the additional 40 bushels of wheat and I can use the 2.0 N per bushel can come up with a top-dress rate of 80 lbs N per acre. We are now incorporating site specific in-season NCrop and NSoil data.
And just a reminder for those of you new to my blog, I have a lot of research documenting that it is not only OK, but often best if we wait on N application in wheat and other crops. Value of In-Season N blog.
Every step we take towards the easy button is often a step towards site specific imprecision due to the use of generalized terms or models. Depending on your goals this very well could be acceptable for your operation, but with nitrogen prices as volatile as they are, should we not be considering pushing the easy button to the side, for now. Let’s add a bit of site-specific data so that we can take advantage of the N the system may be giving us, or the yield we did not expect. Let the N-Rich Strip be that first step.
Relevant Peer Review Publications.
If you have any questions please feel free to contact me @ b.arnall@okstate.edu
Nitrogen Rich Strips, a Reminder
With the recent increase in fertilizer prices just prior to winter wheat planting season I felt it was a good opportunity to bring this older post back up and give it an update. Since the blog was originally written in 2013 there has been a lot of work done both to better understand the nitrogen fertilizer need / timing of winter wheat and efforts to updated and improve the algorithms behind the Sensor Based Nitrogen Rate Calculator.
The Nitrogen Rich Strip, or N-Rich Strip, is a technique/tool/process that I spend a great deal of time working with and talking about. It is one of the most simplistic forms of precision agriculture a producer can adopt. The concept of the N-Rich strip is to have an area in the field that has more nitrogen (N) than the rest. In recent years we have been utilizing Zero-N strips in corn. The approach to some may be new but at one point most producers have had N-Rich Strips in their fields, albeit accidentally. Before the days of auto-steer it was not uncommon, and honestly still is not, to see a area in the field that the fertilizer applicator either doubled up on or skipped. In our pastures and dual purpose/graze out wheat every spring we can see the tell-tale signs of livestock deposits. When over laps or “Cow Pox” become visible we can assume the rest of the field is behind in nitrogen. The goal of an N-Rich Strip is to let the field tell you when it needs more N. Research has shown wheat can be yellow and recover completely and it may even be a benefit. See the link for the Value of In-season Nitrogen at the end of this blog.

What I like most about the N-Rich Strip approach is its Simplicity. The N-Rich Strip is applied and; Scenario 1. The N-Rich Strip becomes visible (Greener) you APPLY NITROGEN, Scenario 2. The strip is not visible you Option A. DON’T APPLY NITROGEN Option B. Apply Nitrogen Anyways. The conclusion to apply N or not is based on the reasoning that the only difference between the N-Rich Strip and the area 10 ft from it is nitrogen, so if the strip is greener the rest of the field needs nitrogen. If there is no difference N is not limiting and our research shows N does not have to be applied. However producers who decide to be risk adverse (in terms of yield) can apply N but it would be advised to do so at a reduce the rate. Now is a good time to note that the N-Rich Strip alone provides a Yes or No, not rate recommendation. At OSU we use the GreenSeeker optical sensor and Sensor Based Nitrogen Rate Calculator (SBNRC) to determine the rate, but that discussion will come later. I equate the change from using yield goal N rate recs to the N-Rich Strip as to going from foam markers to light bars on a sprayer. Not 100% accurate but a great improvement.


Now that we have covered the WHY, lets get down to the nuts and bolts HOW, WHEN, WHERE.
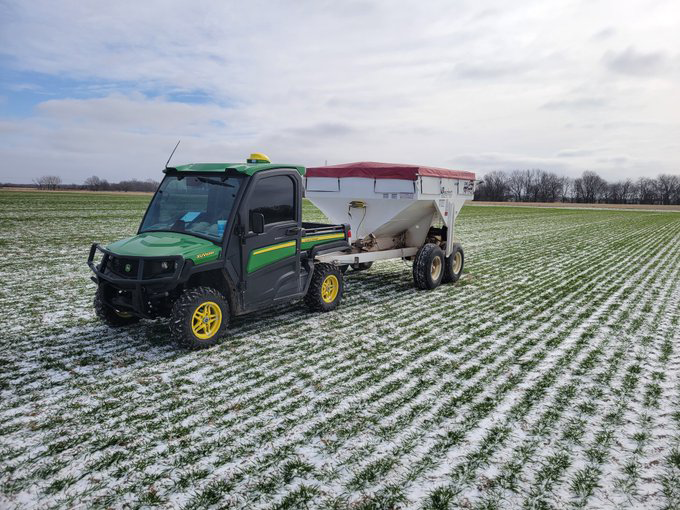
How the strip is applied has more to do with convenience and availability than anything else but there are a few criteria I suggest be met. The strip should be at least 10 ft wide and 300 ft long. The rate should be 40 to 50 lbs N (above the rest of the field) for grain only wheat and canola, 80 lbs N for dual purpose wheat. The normal recommendation is that when applying pre-plant either have a second, higher rate programmed into the applicator or make a second pass over an area already fertilized. Many will choose to rent a pull type spreader with urea for a day, hitting each field.
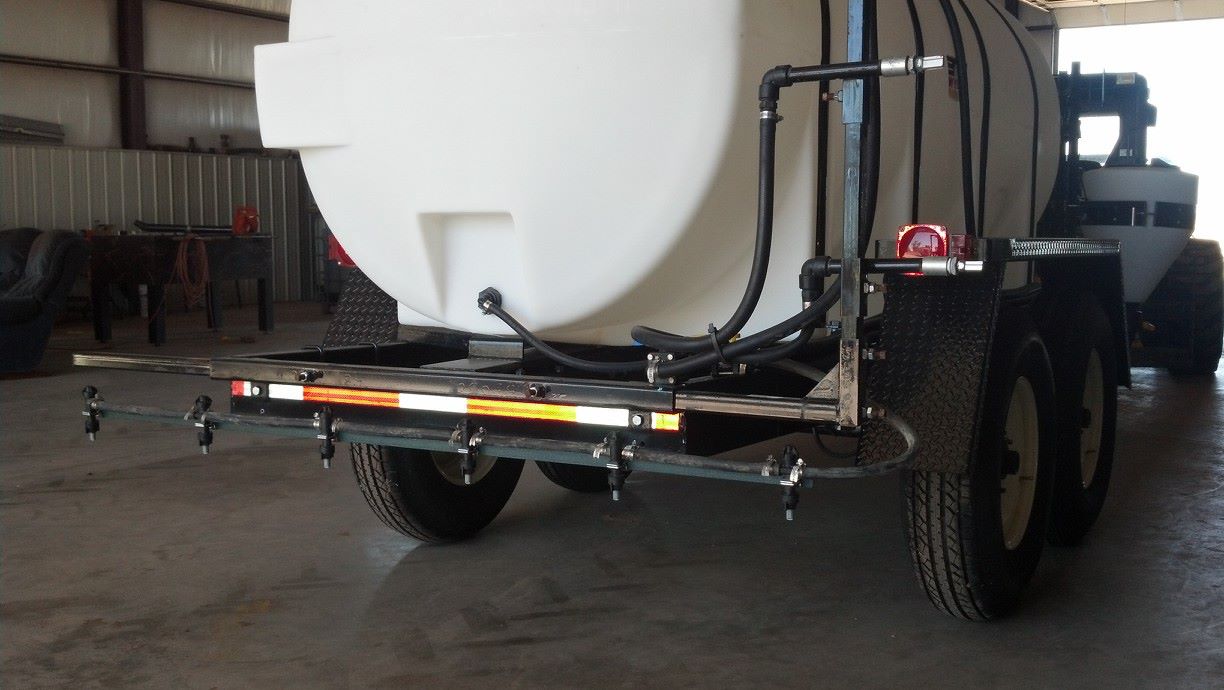
Also popular are applicators made or adapted for this specific use. ATV sprayers are the most common as they can be multi-purpose. In most cases a 20-25 gallon tank with a 1 gpm pump is placed on the ATV with an 8-10ft breakover boom. The third applicator is a ride away sprayer with a boom running along the rear of the trailer. In all cases when liquid is the source I recommend some form of streamer nozzle.
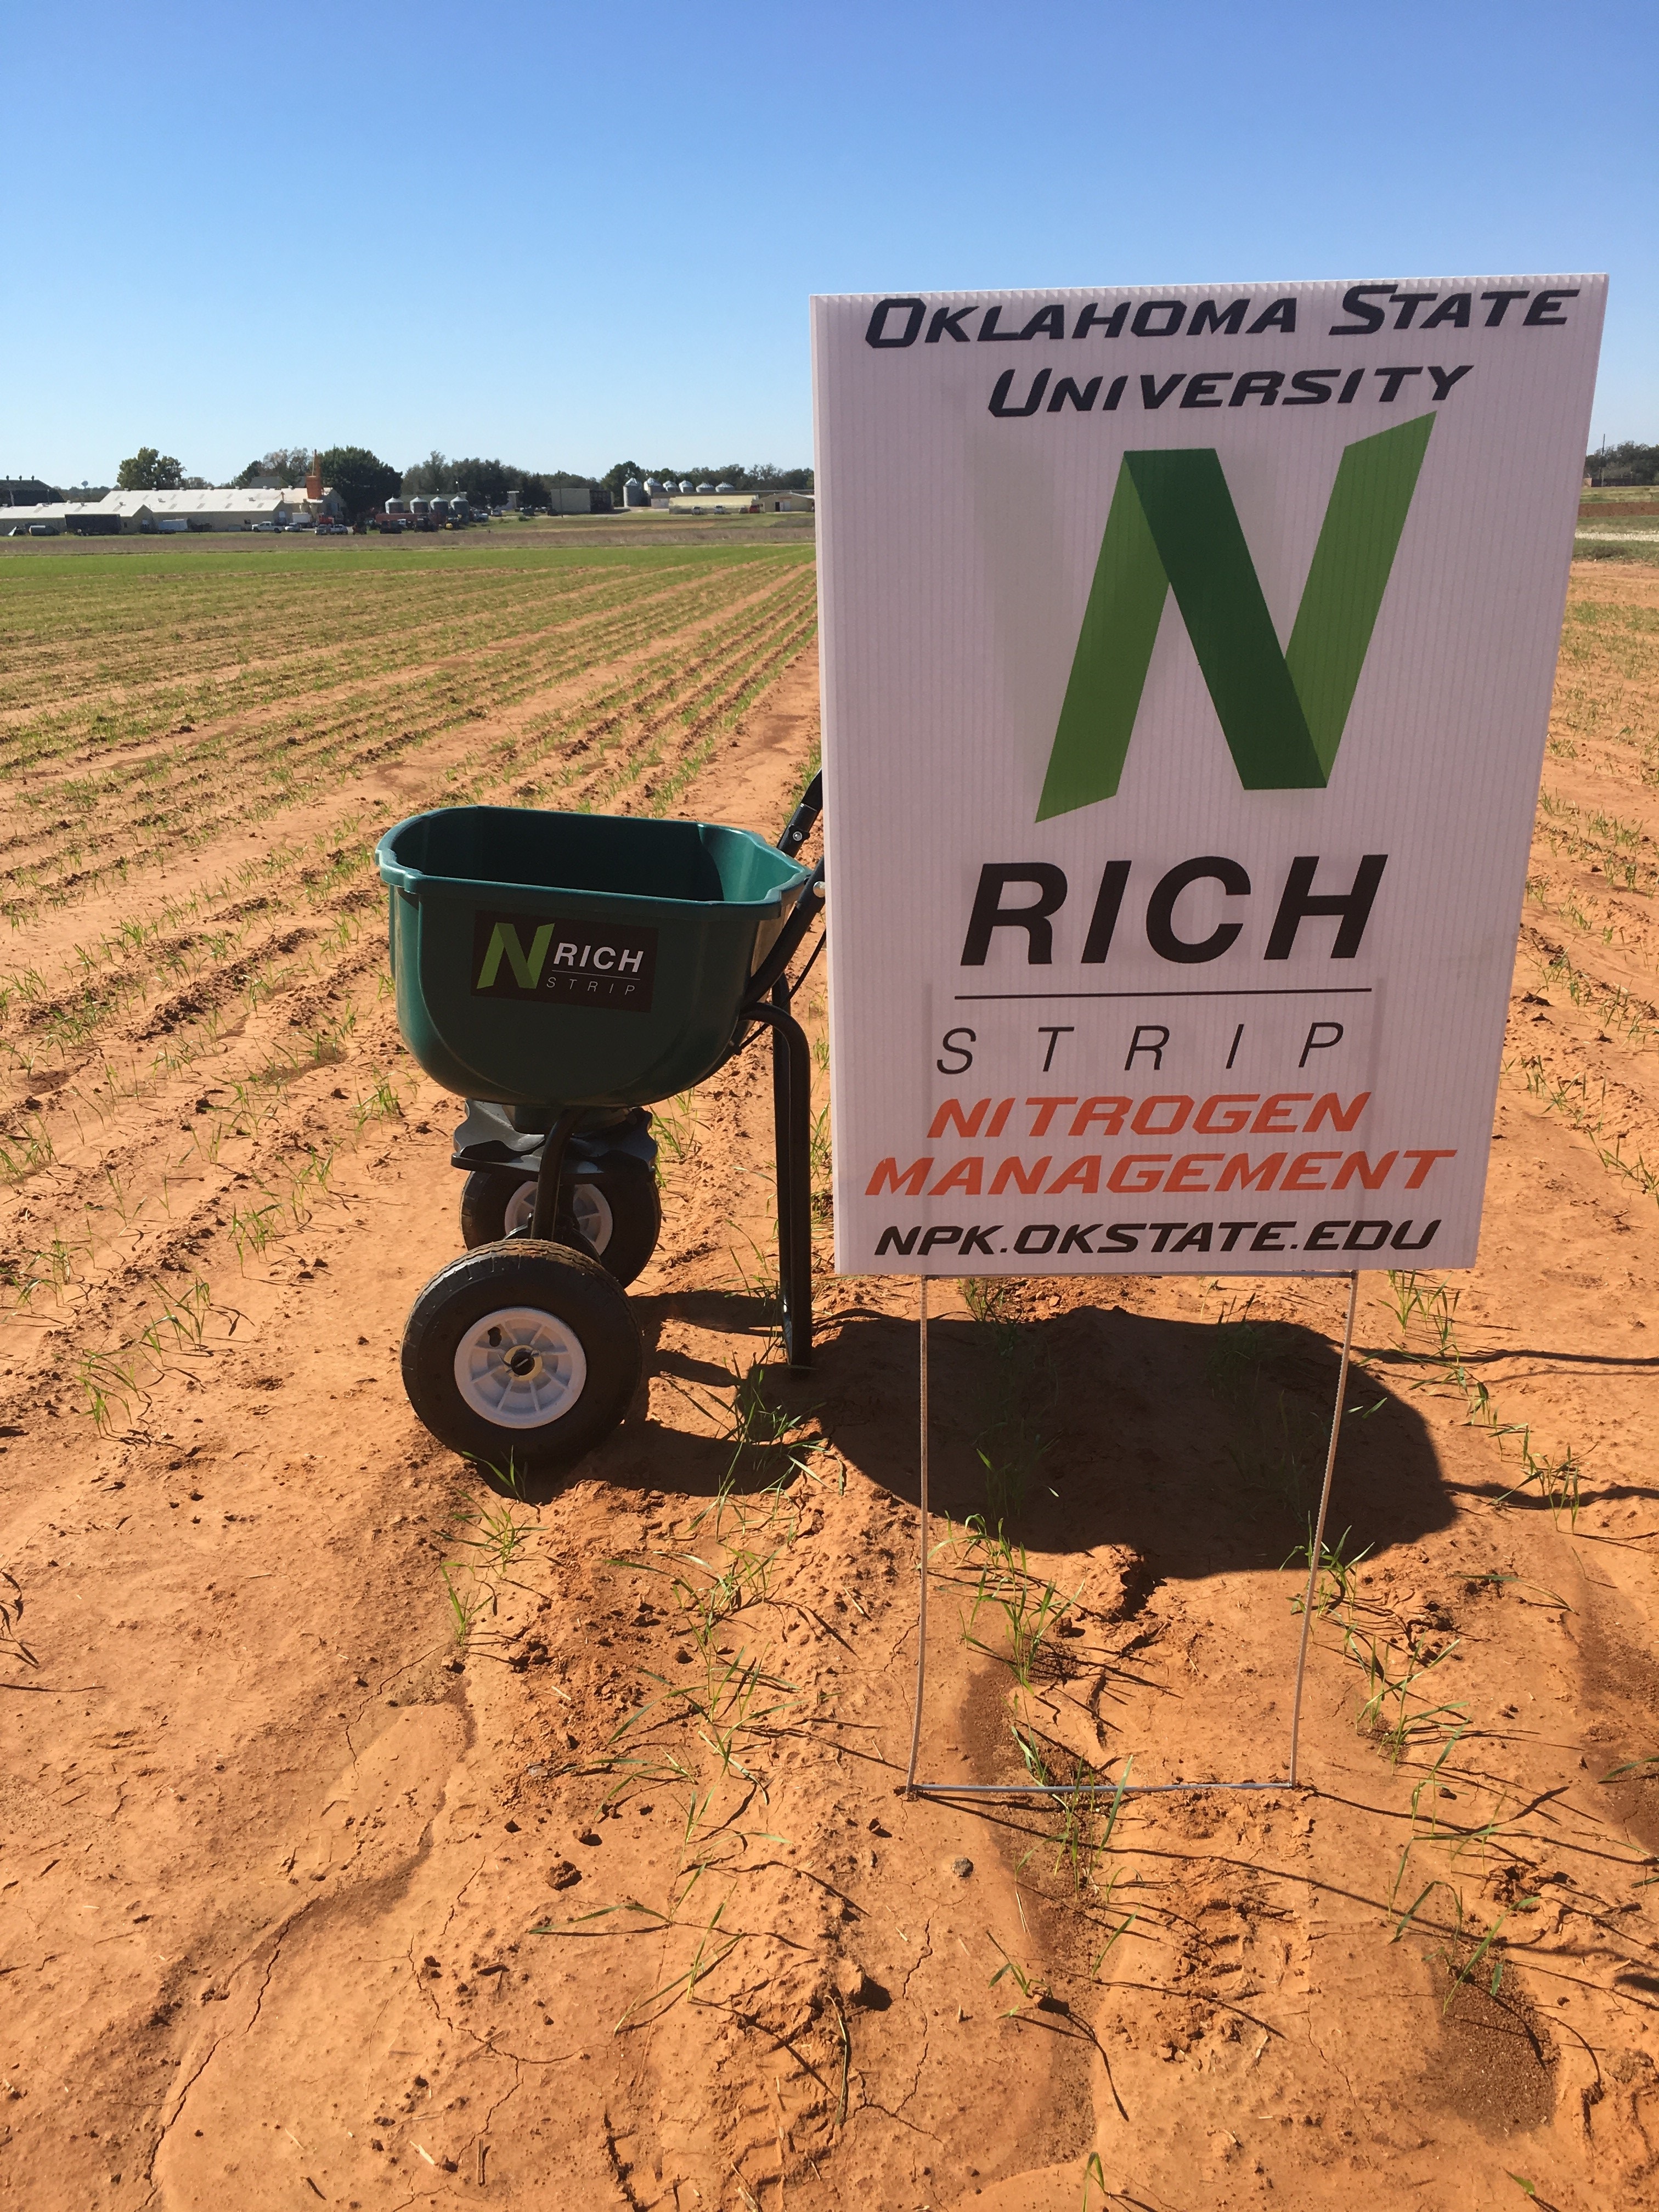
If this all sounds like to much then the easiest application method might just be a push spreader. No need for trailer or even a truck. In most cases I recommend whichever N source is the easiest, cheapest, and most convenient to apply.

When the strip is applied in winter crops proper timing is regionally dependent. For the Central Great Plains, ideally the fertilizer should be applied pre-plant or soon after. However, in most cases as long as the fertilizer is down by December or even January everything works. Timing is more about how much the wheat is growing. If it is slow growing fall, timing can be delayed. When the N-Rich Strip approach is used on the Eastern Shore in Virginia and Maryland the strips have to be applied at green up. We have been trying this in Oklahoma and Kansas with good success. It is always important to make the tools fit your specific regional needs and practices and not the other way around.
Where is actually the biggest unknown. The basic answer is to place the N-Rich Strip in the area that best represents the field. Many people question this as it doesn’t account for spatial variability in the field, and they are correct. But my response is that in this case spatial variability is not the goal, temporal variability is. Keeping in mind the goal is to take a field which has been receiving a flat yield goal recommendation for the last 30+ years and make a better flat rate recommendation. My typically request is that on a field with significant variability either apply a strip long enough to cross the zones or apply smaller strips in each significant area. This allows for in-season decisions. I have seen some make the choice to ignore the variability in the field, made evident by the strip, and apply one rate and others choose the address the variability by applying two or more rates. One key to the placement of N-Rich Strips is record keeping. Either via notes or GPS, record the location of every strip. This allows for the strips to be easily located at non-response sites. It is also recommended to move the strip each year to avoid overloading the area with N.
For more information on N-Rich Strips
Factsheets
https://extension.okstate.edu/fact-sheets/applying-nitrogen-rich-strips.html
Related Blogs
YouTube Videos
Using the GreenSeeker after Freeze Damage
After discussions with producers in southern Kansas I felt the need to bring back this past blog. It seems that much of (not all) the early planted wheat lost a significant amount of biomass during the winter and the N-Rich Strip GreenSeeker approach is producing what looks to be low yield potentials and N-Rate recommendations. This should be treated much like we do grazed wheat and the planting date should be adjusted, see below. It is also important to note that in the past year a new wheat calculator was added to the NUE Site. http://nue.okstate.edu/SBNRC/mesonet.php. Number 1 is the original OSU SBNRC but the #2 is calculator produced by a KSU/OSU cooperative project. This is the SBNRC I recommend for use in Kansas and much of the norther tier of counties in OK.
Original Blog on Freeze Damage and the GreenSeeker.
Dr. Jeff Edwards “OSUWheat” wrote about winter wheat freeze injury in a receive blog on World of Wheat, http://osuwheat.com/2013/12/19/freeze-injury/. As Dr. Edwards notes injury at this stage rarely impact yield, therefore the fertility requirements of the crop has not significantly changed. What will be impacted is how the N-Rich Strip and GreenSeeker™ sensor will be used. This not suggesting abandoning the technology in fact time has shown it can be just as accurate after tissue damage. It should be noted GreenSeeker™ NDVI readings should not be collected on a field that has recently been damaged.
A producer using the N-Rich Strip, GreenSeeker™, Sensor Based N-Rate Calculator approach on a field with freeze damage will need to consider a few points. First there need to be a recovery period after significant tissue damage; this may be one to two weeks of good growth. Sense areas that have had the same degree of damage as elevation and landscape position often impacts the level of damage. It would be misleading to sense a area in the N-Rich strip that was not significantly damaged but an area in the Farmer Practice that took a great deal of tissue loss.
Finally we must consider how the SBNRC, available online at http://nue.okstate.edu/SBNRC/mesonet.php, works. The calculator uses NDVI to estimate wheat biomass, which is directly related to grain yield. This predicted grain yield is then used to calculate nitrogen (N) rate. So if biomass is reduced, yield potential is reduced and N rate reduced. The same issue is seen in dual purpose whet production. So the approach that I recommend for the dual purpose guys is the same that I will recommend for those who experienced significant freeze damage. This should not be used for wheat with just minimal tip burn.
To account for the loss of biomass, but not yield, planting date needs to be adjusted to “trick” the calculator into thinking the crop is younger and has greater potential. Planting date should be move forward 7 or 14 days dependent For example the first screen shot shows what the SBNRC would recommend using the real planting date. In this case the potential yield is significantly underestimated.
The second and third screen shots show the impact of moving the planting date forward by 7 and 14 days respectively. Note the increase in yield potential, which is the agronomically correct potential for field considering soil and plant condition, and increase in recommended N-rate recommendation. Adjust the planting date, within the 7 to 14 day window, so that the yield potential YPN is at a level suitable to the field the yield condition and environment. The number of days adjusted is related to the size and amount of loss. The larger the wheat and or greater the biomass loss the further forward the planting date should be moved. In the example below YPN goes from 37 bu ac on the true planting date to 45 bu ac with a 14 day correction. The N-rate changes from 31 lbs to 38 lbs, this change may not be as much as you might expect. That is because YP0, yield without additional N, also increases from 26 to 32 bushel.
 Image 1. Planting date 9/1/2013. YPN 37 bu ac-1 and N-Rec 31 lbs ac-1.
 Image 2. Planting date 9/8/2013. YPN 40 bu ac-1 and N-Rec 34 lbs ac-1.
 Image 3. Planting date 9/15/2013. YPN 45 bu ac-1 and N-Rec 38 lbs ac-1.
This adjustment is only to be made when tissue has been lost or removed, not when you disagree with the yield potential. If you have any questions about N-Rich Strips, the GreenSeeker™, or the online SBNRC please feel free to contact me at b.arnall@okstate.edu or 405.744.1722.
Components of a variable rate nitrogen recomendation
I recently wrote a article for the Crops and Soils magazine on the components of a Variable Rate Nitrogen Recommendation. The people at the American Society of Agronomy headquarters were kind enough to make it open access. What follows in this blog is just a highlight reel. For the full article visit https://dl.sciencesocieties.org/publications/cns/articles/49/6/24
Components of a variable rate nitrogen recommendation
Variable-rate nitrogen management (VRN) is a fairly hot topic right now. The outcome of VRN promises improved efficiencies, economics, yields, and environmental sustainability. As the scientific community learns more about the crop’s response to fertilizer nitrogen and the soil’s ability to provide nitrogen, the complexity of providing VRN recommendations, which both maximize profitability and minimize environmental risk, becomes more evident.
The components of nitrogen fertilizer recommendations are the same whether it is for a field flat rate or a variable-rate map. The basis for all N recommendations can be traced back to the Stanford equation (Stanford, 1973). At first glance, the Stanford equation is very basic and fairly elegant with only three variables in the equation.

Historically, this was accomplished on a field level through yield goal estimates and soil test nitrate values. The generalized conversions such as 1.2 lb N/bu of corn and 2.0 lb N/bu of winter wheat took account for Ncrop and efert to simplify the process.
NCrop
The basis for Ncrop is grain yield × grain N concentration. As grain N is fairly consistent, the goal of VRN methods is to identify grain yield. This is achieved through yield monitor data, remote sensing and crop models.
NSoil
The N provided by, or in some cases removed by, the soil is dynamic and often weather dependent. Kindred et al. (2014) documented the amount of N supplied by the soil varied spatially by 107, 67, and 54 lb/ac across three studies. Much of the soil N concentration is controlled by OM. For every 1% OM in the top 6 inches of the soil profile, there is approximately 1,000 lb N/ac.
efert
Historically, the efficiency at which N fertilizer is utilized was integrated into N recommendations and not provided as an input option, e.g., the general conversion factor for corn of 1.2 lb N/bu. Nitrogen concentration in corn grain ranges from 1.23–1.46% with an average of 1.31% (Heckman et al., 2003) or 0.73 lb N/bu. Therefore, the 1.2-lb value is assuming a 60% fertilizer use efficiency. More recently, recommendations have been to incorporate application method or timing factors in attempt to account for efficiencies.
Summary
While a VRN strategy that works across all regions, landscapes, and cropping systems has yet to be developed, the process of nitrogen management has greatly improved and is evolving almost daily. Those methods that are capable of determining the three inputs of the Stanford equation while incorporating regional specificity will capture the greatest level of accuracy and precision. Ferguson et al. (2002) suggested that improved recommendation algorithms may often need to be combined with methods (such as remote sensing) to detect crop N status at early, critical growth stages followed by carefully timed, spatially adjusted supplemental fertilization to achieve optimum N use efficiency. As information and data are gathered and incorporated and data-processing systems improve in both capacity and speed, the likelihood of significantly increasing nitrogen use efficiency for the benefit of the society and industry improves. The goal of all practitioners is to improve upon the efficiencies and economics of the system, and this should be kept in mind as new techniques and methods are evaluated. This improvement can be as small as a few percentages
This article is published in the Crops and Soils Magazine doi:10.2134/cs2016-49-0609. The full article includes more details on the components plus concepts of integration.
Precision Nutrient Management in Forage Systems
Published in Progressive Forage http://www.progressiveforage.com/ 9.1.2016
First, let’s agree the term “precision” is relative. Forage is a diverse system with an even more diverse set of management strategies. Regardless, every manager should be constantly striving to improve the precision in which nutrients are managed. The ultimate goal of any precision nutrient management tool should be this: producing the highest quality output (in this case forage) with the least amount of input – ultimately, optimizing efficiencies and maximizing profits. Within this readership there are those who are soil sampling at a 1-acre resolution and others who have likely not pulled a soil sample in the past decade. For both spectrums we can make improvements – let’s start basic and move forward.
A soil sample should the basis for all nutrient management decisions. Is soil testing a perfected science? No, far from it. However, there must be a starting point. A soil sample is that first bit of information we can start with and the basic data collection for precision ag to make improved management decisions. When fertilizer is applied without a recent soil sample, it is done based upon pure guesswork. How many other management decisions are made on a farm or ranch by a guess?
The composite soil sample is a great start, but it is just that – a start. While there are some soils that are very uniform most are extremely variable. In a survey of 178 fields in the southern Great Plains on average the soil pH was 6.12; phosphorus (Mehlich 3 phosphorus [M3P] and Bray 1 phosphorus [B1P]) was 28 ppm while soil test potassium averaged 196 ppm. So on the average the primary components of soil fertility were okay. However, on average the 178 fields had a range in soil pH of 1.8 units, M3P and B1P both had range of a 52 ppm and STK had a range of 180 ppm.
Table 1 shows the minimum and maximum soil test values for the 178 fields.
| Average | Range | Min | Max | |
| Soil pH | 6.12 | 1.77 | 5.23 | 7.01 |
| Phosphorus | 28 | 52 | 2 | 54 |
| Potassium | 197 | 180 | 107 | 287 |
| Sulfur | 15 | 24 | 3 | 27 |
| Organic matter | 1.9 | 1.2 | 1.3 | 2.5 |
This data helps support the concept that we should find ways to increase the resolution or decrease the number of acres represented by a single soil sample. Increasing soil sample resolution is typically done using one or two methods – zone or by grid.
Zone sampling
The basis of a zone sample is creating a smaller field. The biggest question with zones is how to draw the lines. There are dozens, if not hundreds, of possible methods, each having their own reasons and benefits. My basic recommendation is that before lines are drawn goals have to be established. For example, if phosphorus or soil pH management is important, the basis for the lines should be soil based. This could be based on soils map, soil texture, slope and on and on. If the target is improved nitrogen management, then the reason for drawing lines should be yield based. This could be based on yield maps, aerial images, historic knowledge or many soil parameters.
Why does it matter? Two reasons: First, across the broad spectrum of soils and environments two nutrients are hardly spatially correlated, which means the zone that is best at describing phosphorus variability does an extremely poor job describing potassium variability. Second, more theoretically the demand for nutrients are driven by different factors. Phosphorus (a soil immobile nutrient) fertilizer need is driven by the soil P concentration (look up Brays Sufficiency Concept). Many use yield as a parameter for phosphorus application, but this is not a plant need or even a yield maximizing practice. Fertilizing based on removal is done to prevent nutrient mining. However, nitrogen (a nutrient mobile in the soil) fertilizer need is based on yield and crop removal. Hence, the common Land Grant University N and sulfur recommendations are yield goal based.
Grid sampling
To be honest even the experts disagree on the hows, whys and ifs of grid sampling. I like data, therefore I naturally lean towards grid sampling if the field warrants it. For me, the biggest benefit of grid over zone sampling is that soils data from zone samples are biased to whatever parameter was set for the zone and therefore any resulting map for all nutrients must reflect the original zones. In a grid, each data point is independent therefore the maps of each nutrient can be independent, and (the science tells us) in most cases nutrients are independent of each other.
Ideally two pieces of information are available for determining whether a field is grid sampled or not. The first piece of information is a yield map from any previous crop. If yield is fairly uniform, I question the need for variable rate management, much less the expense of grid sampling. Regardless of the sampling method zone or grid, the discussion is moot if spatial variability does not exist across the field. However, many forage producers may not have access to this kind of data.
One of the most useful decision aid tools for grid sampling is the composite soil sample. The reason is simple statistics: A composite sample should be a representative average of the field. If the data is normally distributed, that means half of the field is above and half the field is below the sample average. So the optimum fields to grid are those in which an input falls at the point in which the benefit of applying is in question, because it suggests that approximately half the field needs the inputs while the other half likely does not. It is in this scenario that the return on investment can be greatest. As with pH, for example, fields with a very low value should have a flat broadcast application and should be sampled again at a later date. Fields with a composite pH well above 6.0 will unlikely have enough acres needing lime to warrant sending out an applicator.
Is grid sampling a lifelong activity? No. The initial activity of grid sampling will provide both an indicator of the variability level and overall needs of the field. From that point, decisions can be made and actions taken. Identify the greatest limiting factor in the field based on the samples, and focus on impacting change upon it. Zone sampling in subsequent years can be utilized to document change. When that issue is resolved, move to the next factor. It may require grid sampling again or using the original grid to develop new management zones. For instance, if the greatest issue first identified on the field is soil acidity then after the soil pH is neutralized the field should be grid sampled again. The reason is for this is that changing soil pH will influence many nutrients and the amount of change is not consistent but dependent upon many other factors.
In precision ag we tend to look at layers, yield, soil, etc. However, none of these tell the whole story independently. An area in a field may have moderate soil fertility and be under producing. Using the data collected the decision may be made to increase inputs; yet, the issue is a shallow restrictive layer limiting production. Therefore, the extra inputs will be of no benefit and could even further reduce production. It is at this point I like to bring out the importance of “getting dirty.” There is no technology that can take the place of “boots on the ground” agronomy.
For producers who have historically preformed intensive soil sampling there is still room for improvement. Soil testing and nutrient management is not an exact science; in fact, it was originally built for broad sweeping, statewide recommendations. As technology advances and inputs can be applied at sub-acre resolutions, all of the environment (weather, soil) by genotype inactions becomes more evident.
The next step in precision ag is to develop recommendations by upon site specific crop responses. This is where nutrient response strips can further improve nutrient use efficiencies and crop production. In Oklahoma, nitrogen-rich strips are applied across fields (grain and forage) to determine in-season nitrogen needs. Having a strip in the field with 50 to 100 extra units of N acts as a management tool which takes into account soil, environment and plant need. If the strip is visible the field or zone needs more N, if it is not visible then the crop is not deficient and at that point in the season does not need more N. Producers have taken this approach for N and adopted it for P and K with strips across the field with a zero and high rate of either nutrient. After a few seasons, responsive and non-responsive zones are developed and P and K applications are managed accordingly.
One misconception of precision ag is that the end result should be a field with uniform yield from one corner to the other. This is often not the case; in fact, in many cases the variability in production across the field can be increased. Theoretically, precision ag is applying inputs at the right rate in the right place. This means areas of the field which are yield limited due to underlying factors which cannot be managed have a reduction in inputs with no effect on yield. Other areas of the field have not been managed for maximum production therefore an increase inputs result in increasing yield widening the gap between the low and high yield levels.
Regardless of where a producer currently sets on the technology curve, there are potential ways to increase productivity and efficiency. There is nothing wrong with taking baby steps; it is often the simple things that lead to the greatest return.
NDVI, Its not all the same.
With the most recent FAA UAV announcement my phone has been ringing with excited potential UAV users. Two points always comes up in the conversation. NDVI (normalized difference vegetation index) and image resolution. This blog will address the use of NDVI, resolution will come later. Before getting into the discussion, what NDVI is should be addressed. As described by Wikipedia, NDVI is a simple graphical indicator that can be used to analyze remote sensing measurements, typically but not necessarily from a space platform, and access whether the target being observed contains live green vegetation or not. NDVI is a mathematical function of the reflectance values of two wavelengths regions, near-infrared (NIR) and visable (commonly red).

Calculation for NDVI. Any visible wavelegnth can be substituted for the red wavelength.
The index NDVI has been tied to a great number of crop factors, the most important being biomass. Biomass being important as most things in the plant world impact biomass and biomass is related to yield. The most challenging issue with NDVI is it is highly correlated with biomass and a plants biomass is impacted by EVERYTHING!!!! Think about it, how many things can impact how a plant grows in a field.

Image showing the impact of nitrogen on a potted plants spectral reflectance pattern. The yellow line has 0 Nitrogen and the orange line had 100 lbs. The higher the line the more that wavelength is reflected. Note Photosynthetic wavelength are absorbed more (reflected less) when the plant is bigger but the NIR (right side) is absorbed less by the healthier plants.

The kicker that most do not know is that all NDVI’s values are not created equal. The source of the reflectance makes a big difference.
Measuring reflectance requires a light source, this is where the two forms of NDVI separate. Passive sensors measure reflectance using the sun (natural light) as a light source while active sensors measure the reflectance from a known light source (artificial light). The GreenSeeker is a good example of a active sensor, it emits its own light using LEDs in the sensor while satellite imagery is the classic passive sensor.

Picture representation of satellite remote sensing. http://www.crisp.nus.edu.sg/~research/tutorial/optical.htm

Graphic of how a active sensor emits light and detects light.
The challenge with passive remote sensing lies within the source of the light. Solar radiation and the amount of reflectance is impacted by atmospheric condition and sun angle to name a few things. That means without constant calibration, typically achieved through white plate measurements, the values are not consistent over time and space. This is the case whether the sensor is on a satellite or held held. In my research plots where I am collecting passive sensor data, so that I can measure all wavelength, I have found it necessary to collected a white plate calibration reading every 10 to 15 minutes of sensing. This is the only way I can remove the impacts of sun angle and cloud cover. When using the active sensors as long as the crop does not change the value is calibrated and repeatable.
What does this mean for those wanting to use NDVI collected from a passive sensor (satellite, plane, or UAV)? Not much if the user wants to distinguish or identify high biomass and low biomass areas. Passive NDVI is a great relative measurement for good and bad. However many who look at the measurements over time notice the values can change significantly from one day to the next. The best example I have for passive NDVI is a yield map with no legend. Even the magnitude of change between high and low is difficult to determine.

Passive un-calibrated NDVI is a relative value. Providing relative highs and lows.
Passive NDVI in the hands of an agronomist or crop scout can be a great tool to identify zones of productivity. It becomes more complicated when decisions are made solely upon these values. One issue is this is a measure of plant biomass. It does nothing to tell us why the biomass production is different from one area to the next. That is why even with an active sensor OSU utilizes N-Rich Strips (N-Rich Strip Blog). The N-Rich Strip tells us if the difference is due to nitrogen or some other variable. We are also looking into utilizing P, K, and lime strips throughout fields. Again a good agronomist can utilize the passive NDVI data by directing sampling of the high and low biomass areas to identify the underling issues creating the differences.
OkState has been approached by many UAV companies to incorporate our nitrogen rate recommendation into their systems. This is an even greater challenge. Our sensor based nitrogen rate calculator (SBNRC blog) utilizes NDVI to predict yield based upon a model built over that last 20 years. That means to correctly work the NDVI must be calibrated and accurate to a minimum of 0.05 level (NDVI runs from 0.0 to 1.0). To date none have been able to provide a mechanism in which the NDVI could be calibrated well enough.
Take Home
NDVI values collected with a passive sensor, regardless of the platform the sensor is on, has agronomic value. However its value is limited if the user is trying to make recommendations. As with any technology, to use NDVI you should have a goal in mind. It may be to identify zones or to make recommendations. Know the limitations of the technology, they all have limitations, and use the information accordingly.
