Home » Soil Sampling
Category Archives: Soil Sampling

How Much Nitrogen Does Double Crop Corn Need in Oklahoma?
Kelby Linn, MS Precision Nutrient Management
Emily Staton, MS Precision Nutrient Management
Josh Lofton, Cropping Systems Management
Brian Arnall, Precision Nutrient Management
Double crop (DC) corn is gaining attention in Oklahoma as producers look for opportunities to increase productivity following wheat harvest. While DC soybeans and sorghum remain common options, corn can serve as an alternative when planting windows are missed or when producers want to diversify their rotation. In Oklahoma systems, it is suggested DC corn is followed by a full season soybean crop the next year. This allows producers to maintain an intensive cropping system while maximizing land use. However, managing fertility in DC corn can be challenging because the crop is grown under a different environment than full season corn. One of the questions producers ask is how much nitrogen (N) is needed to maximize returns. Nitrogen is typically the largest fertilizer expense in corn production, but applying more N does not always result in higher yields. Recent Oklahoma research suggests DC corn may require less N than many would expect.
Understanding the System
To evaluate N requirements under Oklahoma DC conditions, field trials were conducted across 11 site years during the 2024 and 2025 growing seasons (Table 1). Corn was planted directly into wheat residue following harvest, creating a true DC production system. Nitrogen was applied as urea (46-0-0) at 13 rates ranging from 0 to 180 lbs N/acre in 15 lb N increments. The following data was collected: biomass production, grain yield, and grain quality responses across environments. The goal was to identify how much N is needed to maximize yield and profitability in Oklahoma DC corn.
Table 1. Field study locations for the 2024 and 2025 double crop corn trials in Oklahoma. Each location is listed with respective planting dates, corn varieties, planting populations and harvest date.
| Location | Planting | Variety | Population | Harvest |
| Perkins | 6/28/2024 | DK119-30 | 20k | 11/9/2024 |
| 7/11/2025 | DKC117-27RIB | 20k | 11/14/2025 | |
| Stillwater | 6/30/2024 | DK119-30 | 20k | 11/11/2024 |
| 7/12/2025 | DKC117-27RIB | 20k | 11/13/2025 | |
| Perry | 6/28/2024 | DK119-30 | 20k | 11/16/2024 |
| 7/7/2025 | DKC117-27RIB | 20k | 11/12/2025 | |
| Perry (Irrigated) | 7/7/2025 | DKC117-27RIB | 28K | 11/12/2025 |
| Lahoma | 7/9/2025 | DKC117-27RIB | 20k | 11/18/2025 |
| Fort Cobb (Irrigated) | 7/2/2025 | DKC117-27RIB | 28K | 11/15/2025 |
Yield Response: Nitrogen Helped, But Only to a Point
Across all harvested site years, N applications significantly influenced grain yield when environment was not the limiting factor. Average yields ranged from 40 to 94 bu/ac, demonstrating how variable DC corn performance can be from year to year and field to field (Staton, 2026) (Figure 1). While some locations responded positively to N fertilizer, others showed little response even when rates reached 180 lbs N/ac. The consistent finding was yield responses often plateaued around 60 lbs N/ac. Once this point was reached, additional fertilizer rarely produced enough additional grain to justify the added cost. Across two Oklahoma studies representing 11 site-years, unfertilized double-crop corn averaged approximately 52 bu/ac. That finding highlights just how much nitrogen can be supplied by the soil through residual nitrate and mineralization before fertilizer is applied. These results suggesting existing soil N and nutrient mineralization contributed significantly to crop demand (Staton, 2026).
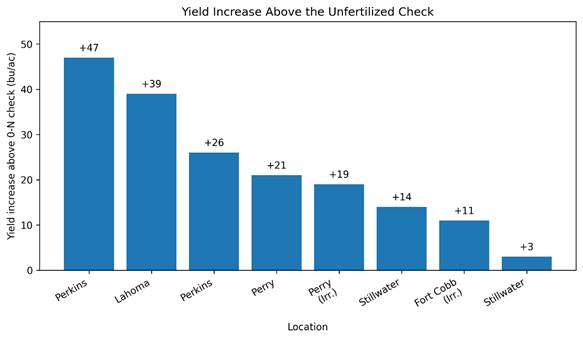
Figure 1. Increase in yield of the highest yielding treatment as compared to the non-fertilized check yields of each location. Adapted from Staton (2026)
The Real Story: Return on Investment
While producers naturally focus on maximizing yield, these fertilizer decisions should be based on profitability. Average economic return peaked near 60 lb N/ac. Beyond that rate, additional fertilizer consistently reduced profit (Figure 2). Although individual economic returns varied among environments, the agronomic data suggest producers should approach DC corn fertility programs with realistic yield expectations. Unlike high yielding full season corn, DC systems often encounter environmental limitations that reduce the return on additional fertilizer investment.
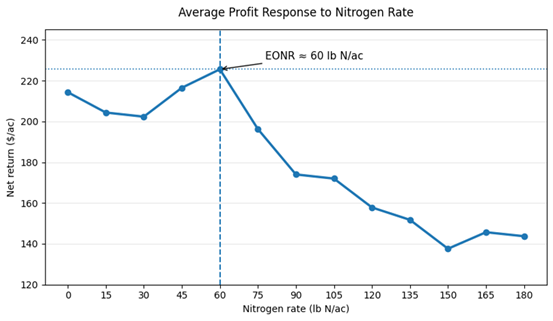
Figure 2. Average profit response to nitrogen rate in US dollars (USD)/ac. Adapted from Staton (2026).
What This Means for Oklahoma Producers
The results from this study closely align with previous Oklahoma research evaluating N response in DC corn. Wyma (2022) reported approximately one additional bushel of grain for every 1.8 lbs N applied above the unfertilized control, similar to Staton (2026) who observed one additional bushel for every 1.7 lbs N in responsive environments. Together these studies suggest Oklahoma DC corn requires approximately 1.75 lbs N for every additional bushel of expected yield above 50 bu ac-1.
The goal of nitrogen management is not to apply the most fertilizer, it is to apply the right amount. Two independent Oklahoma studies now indicate that double-crop corn often requires substantially less N than full-season corn. Matching N rates to realistic yield potential can improve profitability while reducing unnecessary fertilizer costs.
Take Home
- Double crop corn is a economically viable option in Oklahoma.
- Use lower total N rates than full-season corn.
- Across two independent studies’, the unfertilized corn averaged about 50 bushels per acre.
- 1.75 lb N per expected additional bushel above the unfertilized expectation.
- Base final N rates on realistic yield potential and expected moisture.
- Consider residual soil nitrate following wheat before increasing fertilizer rates.
- Avoid applying N beyond expected crop demand.
References
Alcoz, Mercedes M., Frank M. Hons, and Vincent A. Haby. 1993. “Nitrogen Fertilization Timing Effect on Wheat Production, Nitrogen Uptake Efficiency, and Residual Soil Nitrogen.” Agronomy Journal 85(6):1198–1203. doi:10.2134/agronj1993.00021962008500060020x.
Chang, Jen-Hu. 1981. “Corn Yield in Relation to Photoperiod, Night Temperature, and Solar Radiation.” Agricultural Meteorology 24:253–62. doi:10.1016/0002-1571(81)90049-2.
Kravchenko, Anatoliy G., and Kurt D. Thelen. 2007. “Effect of Winter Wheat Crop Residue on No-Till Corn Growth and Development.” Agronomy Journal 99(2):549–55. doi:10.2134/agronj2006.0192.
Liu, Zheng, Jia Gao, Fei Gao, Shuting Dong, Peng Liu, Bin Zhao, and Jiwang Zhang. 2018. “Integrated Agronomic Practices Management Improve Yield and Nitrogen Balance in Double Cropping of Winter Wheat-Summer Maize.” Field Crops Research 221:196–206. doi:10.1016/j.fcr.2018.03.001.
Staton, Emily. 2026. “Nitrogen Management in Double Crop Corn” M.S., Oklahoma State University, United States — Oklahoma.
Wyma, Rhiannon Nichole. 2022. “Corn Grain Yield Response to Nitrogen Rate and Plant Population in Full and Double-Crop Systems.” M.S., Oklahoma State University, United States — Oklahoma.
Banding P for Acidic Soils: Its not the time to be paying for poor practice.
I am bringing this topic back to the surface now with the current outlook on phosphorus fertilizer. If you have heard its not only becoming more expensive but the supply is short and will likely stay short through summer into the fall, which wont help prices. So this year’s wheat crop, we need to be prepared to be smart with Phosphorus, and applying an extra 30lbs to band aid for soil acidity should not be in the cards. Look at it this way, if the phosphorus was at $0.66 a lb that $20 that could be spent on a ton of lime. That lime will last 3-5 years, while that P needs to be added every year. Not only that, but the lime will help root growth (better when we dry up), produce significantly more biomass, and make the phosphorus you’ve applied in the past available again for plant uptake. So make the plans now to soil sample as soon as this crop is off, you can get a soil test recommendation and plan for the lime trucks. This is also not the year to just apply phosphorus for the sake of applying. Soil tests are inexpensive relative to buying excess fertilizer.
Current quotes on 4.24.26 are at $0.54 + per lbs P2O5 with DAP at $830 a ton.
Quick Fertilizer Price Calculation:
Urea at $860 a ton means N is $0.93 a lbs.
DAP at $830 has $334 worth of $0.93 nitrogen and $495 of phosphorus at $0.54 a lb.
Banding P as a band-aid for soil acidity, not so cheap now.
Original Blog Posted in 2021
Whoi Cho, PhD student Ag Economics advised by Dr. Wade Brorsen
Raedan Sharry, PhD Student Soil Science advised by Dr. Brian Arnall
Brian Arnall, Precision Nutrient Management Extension.
In 2014 I wrote the blog Banding P as a Band-Aid for low-pH soils. Banding phosphate to alleviate soil acidity has been a long practiced approach in the southern Great Plains. The blog that follows is a summary of a recent publication that re-evaluated this practices economic viability.
Many Oklahoma wheat fields are impacted by soil acidity and the associated aluminum (Al) toxicity that comes with the low soil pH. The increased availability of the toxic AL3+ leads to reduced grain and forage yields by impacting the ability of the plant to reach important nutrients and moisture by inhibiting root growth. Aluminum can also tie up phosphorus in the soil, further intensifying the negative effects of soil acidity. More on the causes and implication of soil acidity can be found in factsheet PSS-2239 or here (https://extension.okstate.edu/fact-sheets/cause-and-effects-of-soil-acidity.html). The acidification of many of Oklahoma’s fields has left producers with important choices on how to best manage their fields to maximize profit.

Two specific management strategies are widely utilized in Oklahoma to counter the negative impacts of soil acidification: Lime application and banding phosphorus (P) fertilizer with seed. While banding P with seed ties up Al allowing the crop to grow, this effect is only temporary, and application will be required every year. The effects of liming are longer lasting and corrects soil acidity instead of just relieving Al toxicity. Historically banding P has been a popular alternative to liming largely due to the much lower initial cost of application. However, as P fertilizers continue to increase in cost the choice between banding P and liming needed to be reconsidered.
A recent study by Cho et al.,2020 compared the profitability of liming versus banding P in a continuous wheat system considering the impacts that lime cost, wheat price and yield goal has on the comparison. This work compared the net present value (NPV) of lime and banded P. The study considered yield goal level (40 and 60 bu/ac) as well as the price of P2O5 fertilizer and Ag Lime. The price of P2O5 used in this study was $0.43 lb-1 while lime price was dictated by distance from quarry, close to quarry being approximately $43 ton-1 and far being $81 ton-1. For all intents and purposes these lime values are equivalent to total lime cost including application. Wheat prices utilized in the study were $5.10 bu-1 and $7.91 bu-1. It is important to note that baseline yield level was not considered sustainable under banded P management in this analysis. This resulted in a decrease in yield of approximately 3.2 bu ac-1 per year. This is attributable to the expected continued decline in pH when banding P is the management technique of choice.
The analysis in this work showed that lime application is cost prohibitive in the short term (1 year) when compared with banding P regardless of lime cost, yield goal level, and wheat value (within the scope of this study). This same result can be seen over a two-year span when yield is at the lower level (40 bu ac-1). While in the short-term banding P was shown to be a viable alternative to liming, as producers are able to control ground longer lime application becomes the more appealing option, especially when producers can plan for more than 3 years of future production. In fact, under no set of circumstances did banding P provide greater economic return than liming regardless of crop value, yield, or liming cost when more than 3 years of production were considered and only under one scenario did banded P provide a higher NPV in a 3-year planning horizon.
While historically banding P was a profitable alternative to lime application for many wheat producers the situation has likely drastically changed. At the time of writing this blog (09/17/2021) Diammonium Phosphate (DAP) at the Two Rivers Cooperative was priced at $0.78 lb-1. of P2O5. This is a drastic increase in P cost over the last year or so since Cho et al. was published in 2020. With P fertilizer prices remaining high it will be important for producers to continue to consider the value of liming compared to banded P. This is particularly crucial for those producers who can make plans over a longer time frame, especially those more than 3 years.
Addendum: As fertilizer prices have continued to rise a quick analysis utilizing the $0.78 lb-1 of P2O5was completed to consider the higher P fertilizer cost. Under this analysis an estimated decrease in NPV of approximately $38 an acre for P banding occurred. When considering this change in NPV, lime application becomes the more profitable option for alleviation of soil acidity symptoms even in the short term (assuming lime price values are equivalent to the previous analysis). This underlines the fact that it is imperative to consider the impact on profitability of the liming vs. banding P decision in the current economic climate for agricultural inputs.
Link to the Open Access Peer Reviewed publication “Banding of phosphorus as an alternative to lime for wheat in acid soil” https://doi.org/10.1002/agg2.20071
The Mechanics of Soil Fertility: Use of Sugar in Field Crops
Jolee Derrick, Precision Nutrient Management Ph. D. Student
Grace Williams, Soil Microbiology Ph. D. Candidate
Brian Arnall, Precision Nutrient Management Specialist
Recently, there has been increased interest in adding sugar to spray tank mixes, whether for post-emergence weed control or foliar nutrient applications. While there is limited work on impact of sugar inclusion in herbicide applications, some papers have posed potential enhancement (Devine and Hall, 1990). But since this is coming from a soil science group, we will only focus on soil impact. Following up the last blog, unlike humic substances, which represent more complex and relatively stable carbon forms, sugar is a highly labile carbon source. This rapid utilization of simple carbon sources is well documented to stimulate microbial activity and growth (Kuzyakov and Blagodatskaya, 2015). The general idea of utilizing sugar applications is that sugar has the capacity to improve spray performance, stimulate biological activity, increase organic matter mineralization, and ultimately result in improved yields.
Sugar additions can influence soil processes differently depending on system conditions. In systems with higher residual nitrogen and organic matter, responses may differ from those observed in Oklahoma production environments, where soils are typically lower in organic matter and microbial activity can occur for much of the year. Understanding how sugar functions in these systems requires a basic discussion of carbon dynamics. Sugar itself is almost entirely carbon and is readily consumed by microbes. It’s a simple molecule, which allows it to dissolve easily in water and be quickly utilized in the soil system. Crop residues, like wheat straw, are also carbon-rich but much more complex. They contain cellulose, hemicellulose, and lignin which are long carbon chains that take time to break down because microbes need specialized enzymes to access them.
For the sake of simplicity, we can group carbon into two key pools: labile carbon and particulate organic matter (POM). Labile carbon includes easily decomposed materials, which include the previously mentioned simple sugars that microbes can metabolize rapidly. These pools differ in turnover time and microbial accessibility, with labile carbon driving short-term microbial responses (Cotrufo et al. 2013). POM breaks down more slowly and serves as a longer-term nitrogen source through residue breakdown.
Soil microorganisms require both carbon and nitrogen to grow and maintain biomass, typically at a ratio of approximately 24 parts carbon to 1 part nitrogen. When readily available carbon is abundant, but nitrogen is limited, microbes increase their nitrogen demand and begin scavenging nitrogen from the surrounding soil. This process, better known as nitrogen immobilization, temporarily reduces nitrogen availability to crops. Additions of readily available carbon sources have consistently been shown to increase microbial nitrogen immobilization in soil systems (Recous et al. 1990).
In systems where sufficient nitrogen is present, microbial populations can expand rapidly. Fast-growing microbial species may dominate, continuing to immobilize nitrogen within their biomass. Eventually, when nitrogen becomes limiting, microbial populations decline to levels the system can support. This boom-and-bust cycle can disrupt nitrogen availability during critical stages of crop growth. These rapid shifts in microbial population and activity following carbon inputs are commonly observed in soil systems receiving easily decomposable substrates (Blagodatskaya and Kuzyakov, 2008).
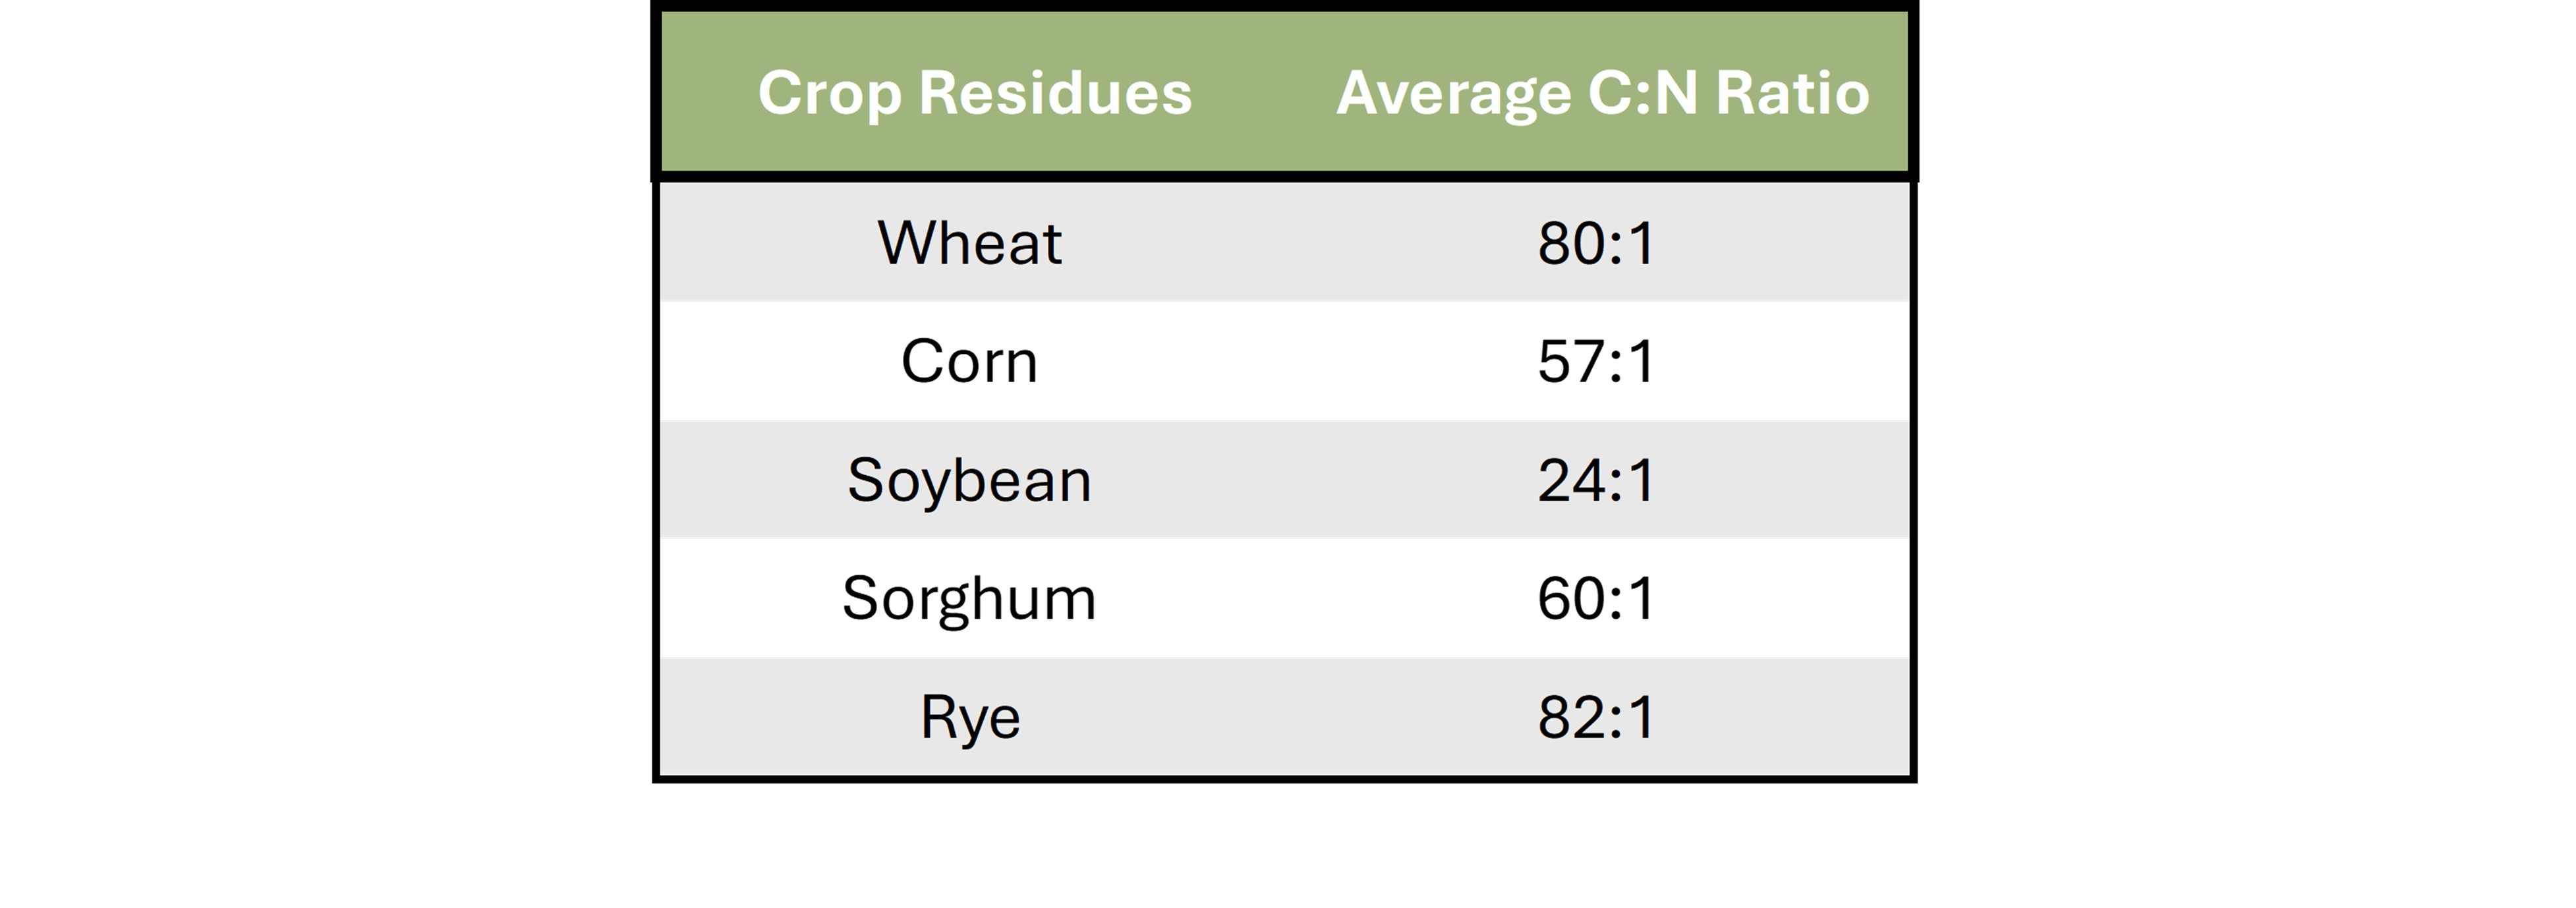
This dynamic becomes especially relevant when considering residue management practices common in Oklahoma. Under no-till or limited-tillage systems, the crop residues have wide carbon-to-nitrogen (C:N) ratios, creating conditions where nitrogen immobilization can occur during the growing season.
Table 1 provides approximate C:N ratios for several crops commonly grown in Oklahoma. When additional carbon is introduced into these systems without accompanying nitrogen, the likelihood of microbial immobilization increases. While immobilization is not bad, it does create a question mark as Oklahoma’s variable climate means the following release of nutrients will be unpredictable.
Table 1. Table depicting the range of C:N ratios for residues of commonly utilized crops in Oklahoma. Ratios were obtained from Brady, N. C., & Weil, R. R. (2017). The Nature and Properties of Soils (15th ed.)
Now consider conventional tillage systems. In Oklahoma, no-till systems typically contain 2 to 3 percent organic matter, which is relatively high given our climate and extended periods of microbial activity. Conventional tillage systems often fall between 0.75 and 2.25 percent organic matter. Because soil organic matter is approximately 58 percent carbon, this represents a substantial difference in the soil carbon pool.
Tillage can temporarily enhance microbial access to both previously mentioned carbon pools. When tillage exposes previously protected carbon, microbial activity increases rapidly. This initial flush can temporarily increase nitrogen mineralization as organic nitrogen is converted to plant-available forms. However, this phase is short-lived. As microbial populations expand, nitrogen demand increases, leading to immobilization and reduced nitrogen availability.
Hypothetically, increased microbial growth and activity would rapidly mineralize organic matter, trigger a surge in NO₃⁻, deplete soil organic matter, and as resources become limiting and the environment can no longer sustain elevated microbial populations, this boom would be followed by a population crash. This relationship is ultimately driven by the soil C:N ratio, which introduces an interesting additional complexity of residue. Different residues bring very different carbon-to-nitrogen balances into the system, and microbes respond accordingly. High carbon residues give microbes plenty of energy but very little nitrogen, so they pull N out of the soil to meet their needs. Residues with lower C:N ratios (soybean, alfalfa, etc.) do opposite, releasing nitrogen as they break down. Now the real question becomes where the critical point sits, and when does management push the system from the threshold of immobilization and mineralization.
These hypotheses form the foundation for new research currently underway through the Precision Nutrient Management Program. Initial proof-of-concept work has already been completed, providing a necessary steppingstone to address these questions.
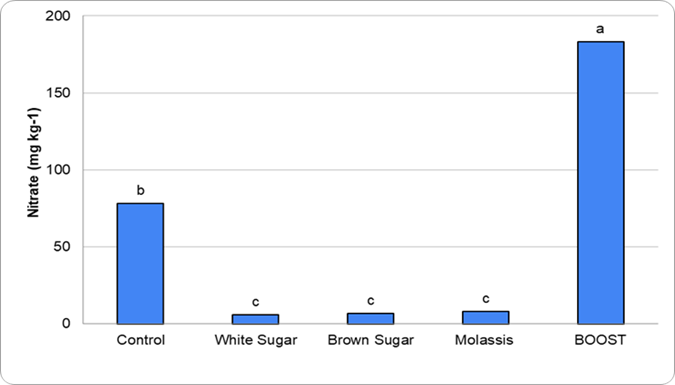
Figure 1. Graph depicting the different concentrations of nitrate leached corresponding to applied treatments in the proof-of-concept work
The preliminary work (Figure 1) evaluated different sugar sources applied alongside a high-nitrogen product to assess the extent of nitrogen immobilization. Although these studies were conducted using potting soils, clear trends were apparent. Treatments containing sugar consistently showed greater nitrogen immobilization compared to treatments without sugar. This response is consistent with studies showing that additions of simple carbon substrates stimulate microbial growth and increase nitrogen immobilization (Dendooven et al. 2006). Building on this work, an active field-based research project is underway to evaluate how sugar additions influence nitrogen availability and microbial dynamics under real-world Oklahoma production conditions.
From an agronomic standpoint, sugar functions primarily as a readily available carbon source that stimulates microbial growth. In nitrogen-limited systems, this response increases the likelihood that nitrogen will be incorporated into microbial biomass rather than remaining immediately available for crop uptake.
Finally, we conclude with a conceptual consideration. If increased OM mineralization leads to greater plant biomass, this process may partially offset losses of OM. Greater biomass production could return more residues to the soil, contributing to the OM pool in the upper soil profile. Therefore, the system may compensate for OM mineralization through the rebuilding of organic matter via plant inputs. However, the stabilization of this carbon depends on microbial processing and physical protection within the soil matrix (Cotrufo et al. 2015)
However, while the underlying logic is sound, this concept has not been extensively studied within Oklahoma cropping systems. This blog does not address the impact of sugar applications on residue breakdown, and the potential impact of such. Future research through the Precision Nutrient Management Program will further investigate the mineralization process to better understand carbon dynamics within these systems.
Take Home:
- Oklahoma production systems generally have lower residual N and high carbon residues, creating conditions conducive to N immobilization
- Adding sugar increases microbial growth, creating population booms that will momentarily increase mineralization, but then immediately immobilize residual nitrogen.
- Tillage can amplify the negative effects of sugar by exposing more carbon and reducing soil organic matter
- Proof-of-concept work shows sugar triggered a net nitrogen immobilization in a carbon heavy environment
- Proof-of-concept work also suggests that when additional nitrogen is present, sugar additions may shift the system toward net mineralization rather than immobilization.
Work Cited:
Blagodatskaya, E., & Kuzyakov, Y. (2008). Mechanisms of real and apparent priming effects. Biology and Fertility of Soils, 45, 115–131.
Brady, N. C., and R. R. Weil. “The Nature and Properties of Soils, 15th Edn (eBook).” (2017).
Cotrufo, M. F., Wallenstein, M. D., Boot, C. M., Denef, K., & Paul, E. (2013). The Microbial Efficiency-Matrix Stabilization (MEMS) framework. Global Change Biology, 19, 988–995.
Cotrufo, M. F., Soong, J. L., Horton, A. J., Campbell, E. E., Haddix, M. L., Wall, D. H., & Parton, W. J. (2015). Formation of soil organic matter via biochemical and physical pathways of litter mass loss. Nature Geoscience, 8(10), 776–779.
Dendooven, L., Verhulst, N., Luna-Guido, M., & Ceballos-Ramírez, J. M. (2006). Dynamics of inorganic nitrogen in nitrate- and glucose-amended alkaline–saline soil. Plant and Soil, 283(1–2), 321–333.
Devine, M. D., & Hall, L. M. (1990). Implications of sucrose transport mechanisms for the translocation of herbicides. Weed Science, 38(3), 299–304.
Kuzyakov, Y., & Blagodatskaya, E. (2015). Microbial hotspots and hot moments in soil: Concept & review. Soil Biology and Biochemistry, 83, 184–199.
Recous, S., Mary, B., & Faurie, G. (1990). Microbial immobilization of ammonium and nitrate in cultivated soils. Soil Biology and Biochemistry, 22, 913–922.
Mechanics of Soil Fertility: Understanding Humic and Fulvic Acids
Brian Arnall, Oklahoma State University, Precision Nutrient Management Extension Specialist
Oliver Li, Oklahoma State University, Soil Chemistry
Interest in humic and fulvic acid products has increased substantially in agricultural production systems during the past two decades. These materials are frequently promoted as tools for improving soil biology, increasing nutrient availability, enhancing fertilizer efficiency, and stimulating plant growth. Because humic substances are known to be important components of soil organic matter, it is reasonable to ask whether adding humic or fulvic products to soil can meaningfully influence soil fertility.
As with many soil fertility questions, the answer depends on understanding two key factors: the mechanism involved and the magnitude of that mechanism relative to the soil system. Soil processes operate within large natural pools of organic matter, nutrients, and microbial activity. Therefore, evaluating the potential effects of humic products requires examining both how these compounds function chemically and biologically and how their application rates compare with the soils organic matter.
What Are Humic and Fulvic Acids?
Humic substances are heterogeneous organic compounds formed during the decomposition and transformation of plant and microbial residues. Historically, soil scientists have divided these materials into three operational fractions based on their solubility behavior: humic acid, fulvic acid, and humin (Stevenson, 1994; Tan, 2014). Humic acids are relatively large molecules that are insoluble under acidic conditions but dissolve in alkaline solutions. Fulvic acids are smaller molecules that remain soluble across the entire pH range, which allows them to move more freely in soil solution.
Both humic and fulvic acids contain numerous functional groups, particularly carboxyl and phenolic groups, which carry negative charge. These functional groups allow humic substances to interact with metal ions and nutrient cations and contribute to several important soil properties, including cation exchange capacity, buffering capacity, and metal complexation (Stevenson, 1994; Lehmann and Kleber, 2015). Because these materials originate from decomposed organic residues, they represent one portion of the complex mixture that collectively makes up soil organic matter. The distribution of the soil organic matter fractions varies among soil types and land uses, but fulvic acids and humic acids are each typically estimated to comprise approximately 10–35% of total soil organic matter (Guimarães et al., 2013).
Nutrient Retention and the Role of Cation Exchange
One of the most commonly cited mechanisms associated with humic substances is their ability to retain nutrients through cation exchange. The negatively charged functional groups present on humic molecules attract positively charged ions in soil solution. Through this electrostatic attraction, humic materials can retain several plant nutrients, including ammonium, potassium, calcium, magnesium, and certain micronutrients such as zinc and copper (Stevenson, 1994; Tan, 2014). This mechanism functions in the same manner as cation exchange on clay minerals. Of course, negatively charged surfaces do not retain negatively charged ions. As a result, nutrients such as nitrate are not held by humic substances and remain mobile in soil solution.
Laboratory measurements indicate that humic materials may possess relatively high cation exchange capacity on a mass basis. Reported values commonly range from approximately 300 to 600 cmolc kg⁻¹ depending on the source material and extraction method (Stevenson, 1994; Tan, 2014). These values demonstrate that humic substances can retain a large amount of cationic nutrients. A question that can be posed, however, is how this capacity compares with the nutrient retention already provided by soil organic matter.
Understanding the magnitude of humic additions requires comparing product application rates with the organic matter already present in soil. Calculations based on typical cation exchange values suggest that one pound of humic material with a CEC of 300–600 cmolc kg⁻¹ could theoretically retain approximately 0.04 to 0.08 pounds of ammonium-nitrogen. When viewed in isolation this number may appear meaningful. However, agricultural soils already contain large quantities of organic matter. An acre furrow slice, representing approximately the upper six inches of soil, weighs roughly two million pounds. Soil containing one percent organic matter therefore contains about 20,000 pounds of organic material per acre (Brady and Weil, 2016). Humified organic matter typically has cation exchange capacities ranging between 150 and 300 cmolc kg⁻¹ (Stevenson, 1994), meaning that the exchange capacity associated with native soil organic matter is already substantial. To put this into perspective, one pound of humic material can retain roughly 0.04 to 0.08 pounds of cation charge. Ammonium and potassium carry a single positive charge, while calcium carries two, meaning two ammoniums can be held for every two calcium. To provide contrast to the application of a humic substance, increasing soil organic matter by just 0.1% equivalent to about 2,000 pounds of additional organic material per acre can provide the capacity to retain approximately 40 to 80 pounds of cation charge or 40 to 80 pounds of ammonium.
The key point is not that humic materials cannot retain nutrients. They clearly can. Rather, the scale of material already present in soil is extremely large compared with the few ounces or pounds of humic products typically applied in agricultural systems. Consequently, the nutrient retention capacity associated with soil organic matter overwhelmingly dominates the soil system.
Micronutrient Complexation
Humic and fulvic substances are also known to interact with micronutrients through metal complexation reactions (also known as ‘chelation’). Carboxyl and phenolic functional groups can coordinate with metal ions such as iron, zinc, copper, and manganese to form organic complexes (Stevenson, 1994; Tan, 2014). These complexes can influence micronutrient mobility and availability in soils.
Fulvic acids are particularly effective at forming soluble complexes because they remain dissolved across the full range of soil pH. In some cases, these complexes may increase micronutrient mobility and transport within the soil solution. This mechanism has been well documented in soil chemistry research and may explain some responses observed in systems where micronutrient availability is limited.
Effects on Plant Physiology
In addition to soil chemical interactions, humic substances may influence plant growth through physiological mechanisms occurring in the rhizosphere. Several studies have shown that humic substances can stimulate root development, including increases in root elongation, lateral root formation, and root hair production (Nardi et al., 2002; Canellas and Olivares, 2014).
Research suggests that these responses may involve interactions with plant hormonal pathways and membrane transport processes. Humic substances have been shown to activate plasma membrane H⁺-ATPase enzymes, which are involved in proton pumping and nutrient uptake across root membranes (Canellas et al., 2002; Trevisan et al., 2010). Activation of these transport systems can enhance nutrient absorption and influence root architecture.
These physiological effects appear to occur primarily at the root–soil interface, where dissolved organic molecules interact directly with plant tissues. As a result, the responses observed in plant growth experiments are often attributed to rhizosphere signaling processes rather than large changes in bulk soil fertility.
Microbial Responses to Humic and Fulvic Compounds
Soil microorganisms respond strongly to carbon availability, and different carbon sources can produce very different microbial responses. Simple carbohydrates such as glucose and sucrose are readily metabolized by soil microbes and therefore produce rapid increases in microbial respiration and biomass. Humic substances, in contrast, consist of chemically complex and partially oxidized organic compounds that decompose much more slowly (Lehmann and Kleber, 2015).
Experimental studies comparing carbon sources consistently show that microbial respiration increases dramatically when simple sugars are added to soil, whereas humic substances produce smaller responses (Blagodatskaya and Kuzyakov, 2008). This difference reflects the relative degradability of these compounds as microbial energy sources.
Carbon Inputs from Humic Products Compared with Natural Soil Carbon
Soil microbial activity is largely driven by carbon supplied from plants through root exudation, residue decomposition, and organic matter turnover. The carbon pools already present in soil are therefore important for understanding the potential influence of humic product additions. A soil containing one percent organic matter holds approximately 11,600 pounds of carbon per acre (Brady and Weil, 2016).
Research on plant–soil carbon cycling indicates that living roots release significant quantities of organic carbon into soil each growing season through root exudation and rhizodeposition (Kuzyakov and Domanski, 2000). These plant-derived carbon inputs commonly amount to hundreds of pounds of carbon per acre and serve as a major energy source for soil microbial communities. Viewed in this context, humic product applications represent extremely small additions to the soil carbon pool. Consequently, microbial stimulation in agricultural soils is dominated by carbon inputs from plant residues and root exudates rather than by small additions of humic materials.
Building Organic Matter in the Central Plains
Increasing soil OM in the central Great Plains is achievable, but the magnitude of change is governed primarily by carbon inputs and water availability rather than any single management practice. Systems that combine no-till, increased residue return, diversified crop rotations, and where feasible cover crops or manure inputs are the most effective because they simultaneously increase carbon inputs and reduce decomposition losses (Lyon et al., 2007; Mikha et al., 2013; Nielsen et al., 2016). In semi-arid systems, realistic rates of OM increase are modest: over a 5-year period, changes are often small, approximately +0.05 to 0.1% OM, but significant in relation to the system which is often at total OM levels between 0.7 and 1.25 prior to establishment of conservation practices. The increase is confined to the top inch of the soil surface (Mikha et al., 2013; Saha et al., 2024). Mechanistically, these gains occur through greater residue and root-derived carbon inputs, reduced soil disturbance which slows microbial oxidation, and improved aggregation that physically protects organic matter from decomposition (Six et al., 2002; Lehmann and Kleber, 2015). However, as emphasized throughout this discussion, the scale of change is small relative to the large existing organic matter pool, and meaningful increases require long-term, system-level management focused on maximizing biomass production rather than relying on small external carbon additions such as commercial products.
Take-Home Points
- Humic and fulvic acids can retain cations, chelate micronutrients, and influence plant and microbial processes.
- Typical application rates are small relative to existing soil organic matter, so whole-soil impacts are limited.
- Most observed effects are localized in the rhizosphere, not broad changes in soil fertility.
- Evaluating both mechanism and scale is key to understanding their role in nutrient management.
References
Blagodatskaya, E., & Kuzyakov, Y. (2008). Mechanisms of real and apparent priming effects and their dependence on soil microbial biomass and community structure. Biology and Fertility of Soils, 45(2), 115–131.
Brady, N. C., & Weil, R. R. (2016). The nature and properties of soils (15th ed.). Pearson.
Canellas, L. P., Olivares, F. L., Okorokova-Façanha, A. L., & Façanha, A. R. (2002). Humic acids isolated from earthworm compost enhance root elongation and lateral root emergence in maize. Plant Physiology, 130(4), 1951–1957.
Canellas, L. P., & Olivares, F. L. (2014). Physiological responses to humic substances as plant growth promoters. Chemical and Biological Technologies in Agriculture, 1, 3.
Guimarães, D. V., Gonzaga, M. I. S., Silva, T. O., Silva, T. L., Dias, N. S., & Matias, M. I. S. (2013). Soil organic matter pools and carbon fractions in soil under different land uses. Soil and Tillage Research, 126, 177–182.
Kuzyakov, Y., & Domanski, G. (2000). Carbon input by plants into the soil: Review. Journal of Plant Nutrition and Soil Science, 163(4), 421–431.
Lehmann, J., & Kleber, M. (2015). The contentious nature of soil organic matter. Nature, 528(7580), 60–68.
Lovley, D. R., Coates, J. D., Blunt-Harris, E. L., Phillips, E. J. P., & Woodward, J. C. (1996). Humic substances as electron acceptors for microbial respiration. Nature, 382, 445–448.
Lyon, D. J., Stroup, W. W., & Brown, R. E. (2007). Crop production and soil water storage in long-term winter wheat–fallow tillage experiments. Soil and Tillage Research, 94(2), 387–397.
Mikha, M. M., Vigil, M. F., Benjamin, J. G., & Sauer, T. J. (2013). Cropping system influences on soil carbon and nitrogen stocks in the Central Great Plains. Soil Science Society of America Journal, 77(2), 702–710.
Nardi, S., Pizzeghello, D., Muscolo, A., & Vianello, A. (2002). Physiological effects of humic substances on higher plants. Soil Biology and Biochemistry, 34(11), 1527–1536.
Nielsen, D. C., Lyon, D. J., Hergert, G. W., Higgins, R. K., Calderón, F. J., & Vigil, M. F. (2016). Cover crop mixtures do not use water differently than single-species plantings. Agronomy Journal, 108(3), 1025–1038.
Saha, D., Kukal, S. S., & Bawa, S. S. (2024). Long-term impacts of conservation agriculture practices on soil organic carbon and aggregation. Soil Science Society of America Journal.
Six, J., Conant, R. T., Paul, E. A., & Paustian, K. (2002). Stabilization mechanisms of soil organic matter: Implications for C saturation of soils. Plant and Soil, 241(2), 155–176.
Stevenson, F. J. (1994). Humus chemistry: Genesis, composition, reactions (2nd ed.). Wiley.
Tan, K. H. (2014). Humic matter in soil and the environment. CRC Press.
Trevisan, S., Francioso, O., Quaggiotti, S., & Nardi, S. (2010). Humic substances biological activity at the plant–soil interface. Plant Signaling & Behavior, 5(6), 635–643.
For any questions or commments please feel free to reach out to Brian Anrall, b.arnall@okstate.edu
How do you handle your soil sample….
It’s that time of year where wheat producers are in all stages of prep across the state, the graze out folks are wondering when the rains will hit to get the dusted in wheat up and the grain only folks are prepping grain drills or dealing with summer crop harvest. While this blog is focused on the wheat producers it should be acknowledged as a work of caution for anyone who pulls soil samples in environments where the temps during sampling can be above the mid 80’s.
Following some fantastic work by our Wild Cat Soil Fertility Counterparts (see blog) we dug into the same question of how does soil sample handling post collection impact the results. Dr. Ruiz-Diaz results on the impact of storage on nitrogen values was not surprising. But we wanted to go the next step and add in sample bag type.
Our Project
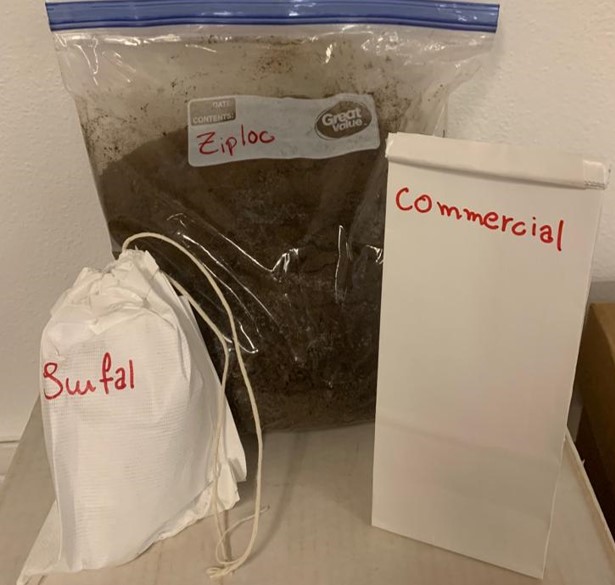
We collected a soil ground and homogenized. Placed in three types of bags Ziploc, Commercial (resin lined paper that is closed) and SWFAL bag (breathable material). Placed samples in a mini-van (Field) and brought a group onto campus (Office). With both sets of samples we had temperature loggers collecting hourly data. Every three days we collected four samples from each location determined moisture content and ran a full spectrum soil analysis including CO2 burst. The soil we used had a OM of 1.1% and soil pH of 6.1
Now let’s back up. Why was the KSU data not surprising. Well for those certified and honorary nitrogen ninjas we understand that the N-cycle processes of mineralization, immobilization, and nitrification are biological reactions which are significantly impacted by soil moisture and soil temperature. But the short and quick version is that the microbes that convert organic N to mineral N (NH4) and convert NH4 to NO3 like warm conditions with good soil moisture. So, when you pull soil samples, hopefully there is some moisture in the soil and then you place it in a bag and seal it. This creates an effective greenhouse environment where moisture cannot escape and is the perfect place for microbes to microbial things. Therefore, you expect the organic cycle and nitrogen cycle to move and move quickly through the processes of mineralization, ammonification, and nitrification.
Back to the data.
First, we have the average daily temperatures from the sitting vehicle and the lab. On days 2-5 the average temp of the van was over 100°, after that the temps dropped. One thing to remember is the temp of the van is an average of a wide-ranging highs and lows between morning and midday while the office temperature being stable throughout the entire day.


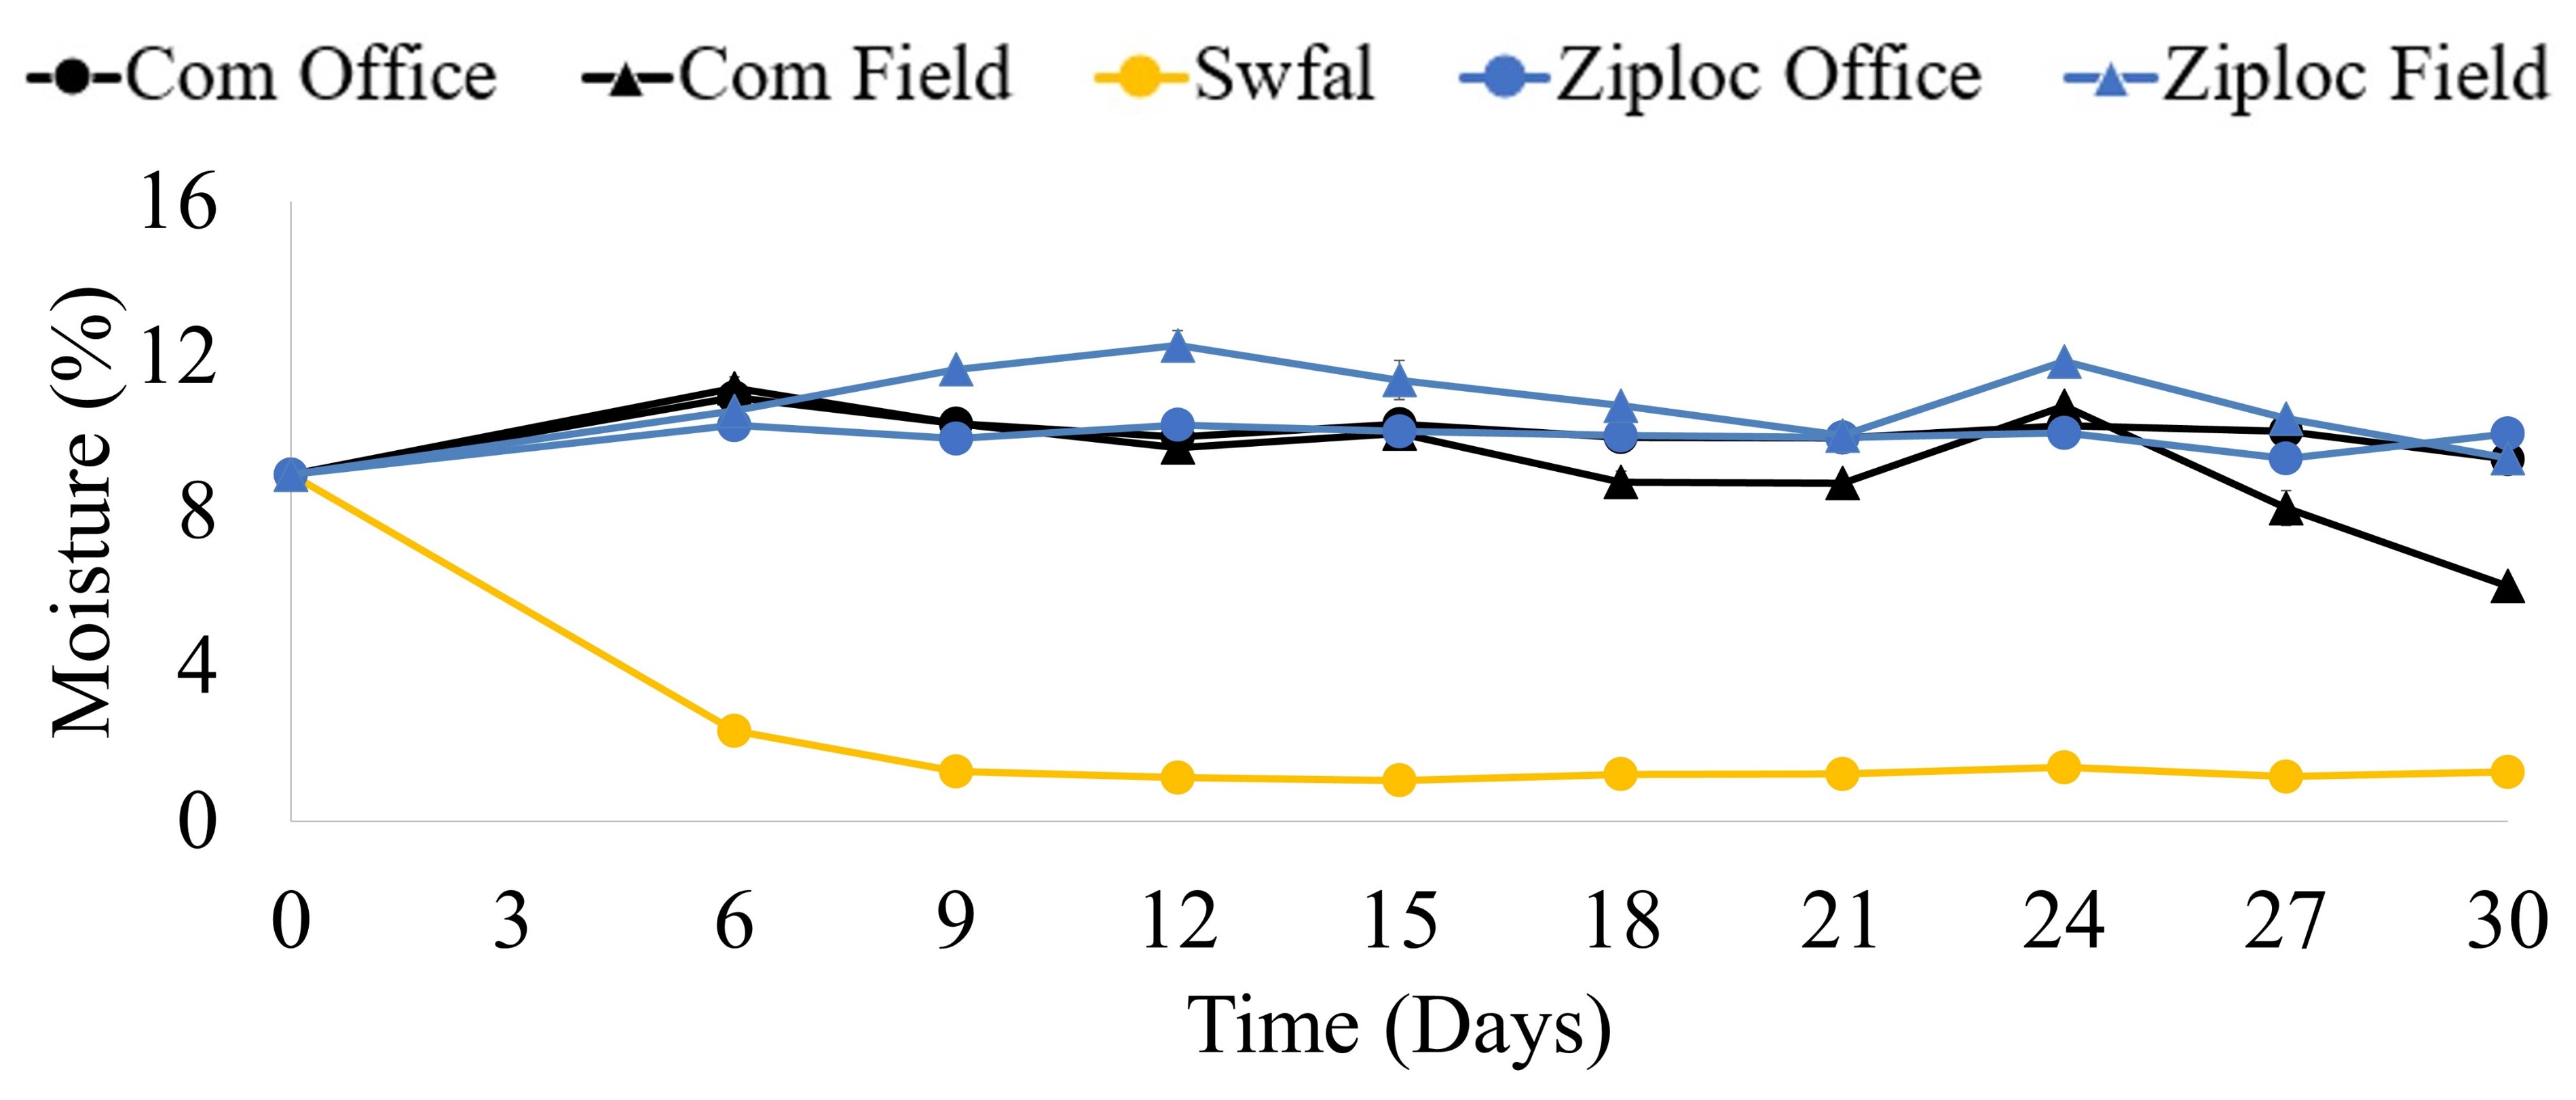
What is the most interesting and revealing data may be the soil moisture of the samples. Unfortunately, day 3 samples went straight to the oven, but you can see by day 6 the SFWAL bags (yellow line) had dried significantly while it wasn’t until day 27 did the Commercial bags in the van (Black line w/ triangle) show signs of drying. It’s also important to note that while there are two lines (Field and Office) for the Commercial bags and Ziploc bags, but only one for the SWFAL bags. That is because for all variables measured there was never a significant difference between the SWFAL Field value and the SWFAL Office value.

We are going to start off with the variable that changed the most, NO3-N. This is also the form of N that is measured in most soil test. With a starting point of 3.4 lbs. N ac-1 (based on a six inch soil sample depth) by day 6 the Field samples had jumped to 15.6 lbs. The office samples had much slower increase in NO3 with it taking 9 days to reach 10 lbs. You can also see that the error bars start showing up in the samples after about two weeks. The bars show the range in the sample results of a treatment. The interesting thing we saw was that the location within the van was significant. We set each replication of samples in a different spot in the van, the front seat, middle seat, and rear. The thermometers set with each replications showed that each area of the van had slightly differing temperature, which in turn affected the samples.

Ammonium (NH4-N), which is only reported by a few labs is also impacted by the storage location and bag type, however not to the sample level as NO3-N. Effectively the SWFAL bags and all samples taken to the office maintained consistent NH4 levels. The Com bag and Ziplocs left in the van however saw a significant increase in NH4 over time, basically a 2 lb per day increase.

Of the other measured parameters such as potassium, sulfur, and CO2 burst data were effected. These will be discussed more in depth in a peer reviewed publication and factsheet.
Take Home’s from the Work
While the majority of the nutrients were relatively un affected by the bag type or storage those that are more heavily influenced by organic matter and biological activity where, this includes many of the soil health parameters. The use of SWFAL soil bags resulted in data that was not impacted by storage or time. While most clients of the OSU lab use these bags, more than one samples been brought into the county via a sealed Ziploc baggie. However the majority of the soil samples collected are placed into the resin lined paper bags and sealed. This data set is also important to those who use laboratories that run the Haney test which includes measures of NO3, NH4, Organic N, CO2 respiration and H2O extracted Organic C. It is critical that when using these type of bags that the samples be brought into climate controlled facilities as soon as possible. Its good to remember when looking at the data that the soil we used had a OM of 1.1%, initial NO3 of 3.4 lbs. and NH4 of 14 lbs. A soil with a higher OM% could have even greater change. Another viable is if the soil sample depth is greater than 6”. If your sample depth is 8” then the value is 33% higher.
Questions or comments feel free to reach out via email or social media.
Brian Arnall, Precision Nutrient Management b.arnall@okstate.edu

Soil sample handling practices can affect soil nitrate test accuracy
From Guest Authors,
Bryan Rutter, PhD student and Soil Testing Lab Manager, Kansas State University
Dr. Dorivar Ruiz Diaz, Soil Fertility Specialist, Kansas State University
The accuracy of a soil test is limited, in part, by the quality of the tested sample. For this reason, strong emphasis is placed on ensuring representative samples are collected in the field. However, these samples must also be handled properly after they have been collected.
Soils are home to a diverse population of microorganisms, many of which help decompose crop residue and cycle nutrients in soils. This nutrient cycling is crucial for crop production, but can skew soil test results if it continues in soil samples after they have been collected.
Microorganisms drive the soil nitrogen cycle
The nitrogen (N) cycle in soils is particularly complex and is strongly influenced by microbial activity and, therefore, temperature and soil moisture conditions. Bacteria and fungi consume organic material and use carbon as an energy source. During this process, N contained in the organic matter undergoes several transformations, ultimately converting it to ammonia. This conversion from organic-N to inorganic-N (NH4+, ammonium) is called “mineralization.” Plants can then take up the ammonium (NH4+), or converted to nitrate (NO3–) by certain bacteria through a process known as “nitrification”.
The microbial activity requires moisture and heat, and the processes described above happen more quickly in warm, wet soils than in cold, dry soils. Microbial activity does not stop just because a sample has been collected and put in a bag. This activity continues as long as the environmental conditions are favorable. As a result, soil tests for plant-available N have the potential to change substantially if samples are not handled properly. This is an important consideration for growers because these soil test results are used to determine the profile-N credit and, ultimately, adjust N fertilizer recommendations.
Research study on soil sample storage
A recent study at the K-State Soil Testing Lab illustrates what can happen if sample submission is delayed. For this study, soil was collected from the Agronomy North Farm (Manhattan, KS) and thoroughly mixed/sieved to homogenize the material. This soil was then placed into sample bags, which were randomly assigned to different combinations of storage temperature and duration. One set of samples was kept in a refrigerator while the other set was kept in a cargo box in a truck bed. To monitor changes in soil test levels over time, three sample bags were removed from the refrigerator and truck box every two days (48 hours) and tested in the lab.
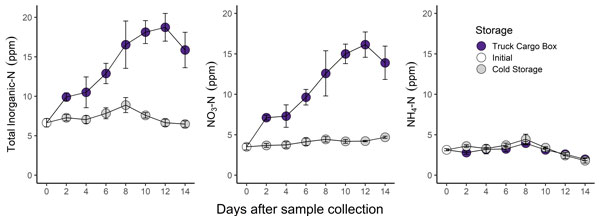
Figure 1. Change in soil test nitrogen parameters over a 14-day storage period. Samples stored in an unrefrigerated cargo box are indicated by purple points. Samples stored in a refrigerator (38F) are indicated by grey points. Graphs by Bryan Rutter, K-State Research and Extension.
Take home points from the K-State Soil Testing Lab study:
- Mineralization and nitrification led to more than a 3x increase in soil test nitrate in the undried and unrefrigerated “Truck Cargo Box” samples (purple points in Figure 1).
- Soil test nitrogen did not change substantially in refrigerated samples.
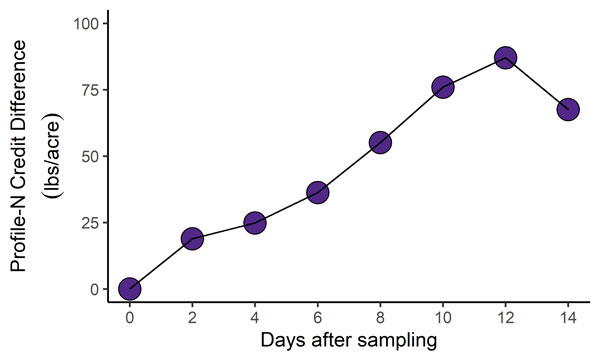
- Profile-N credits calculated from soil test N results were nearly 100 lbs of N/acre higher for the unrefrigerated samples (Figure 2).
- Improper handling and storage of soil samples can dramatically reduce soil test accuracy and may lead to under or overfertilizing crops.
K-State Soil Testing Lab Recommendations
- Submit soil samples to the lab as soon as possible, ideally on the same day they were collected.
- If same-day submission is not possible, samples should be air-dried or placed in a refrigerator set at 40 degrees F or less.
Please see the accompanying article “The challenge of collecting a representative soil sample” for guidance on field soil sampling practices.
For detailed instructions on submitting soil samples to the K-State Soil Testing Lab, please see the accompanying article “Fall soil sampling: Sample collection and submission to K-State Soil Testing Lab”.
For detailed information on how N credits are calculated please see the MF-2586 fact sheet: “Soil Test Interpretations and Fertilizers Recommendations”.
Bryan Rutter, PhD student and Soil Testing Lab Manager
rutter@ksu.edu
Dorivar Ruiz Diaz, Soil Fertility Specialist
ruizdiaz@ksu.edu
The original article can be found on the KSU Agronomy E-update site
https://eupdate.agronomy.ksu.edu/article_new/soil-sample-handling-practices-can-affect-soil-nitrate-test-accuracy-511-4

Phosphorus decisions, Is it worth cutting P?
With the current conditions and input cost many wheat producers are considering cutting back on inputs. I can’t disagree with the plan, but I would caution against what you cut. If you have read any of my past blogs, or seen me speak, you should know I’m all for cutting back on pre-plant nitrogen (N). Based on some recent trials I would not argue cutting the potassium (K) side, but phosphorus (P) that’s another story that we will walk through in this blog.
First and foremost, soil testing is the key to P management. If your soil test is below the critical threshold for the test you use, 32.5 for Mehlich 3 (M3P), then you need to add phos. We have enough work that shows current recommendations work for P in wheat. Reeds paper Evaluation of incorporated phosphorus fertilizer recommendations on no-till managed winter wheat Link to Paper goes over soil test recommendations in no-till and the recent double crop soybean project Double Crop P and K Blog highlights the importance of P fertility, regardless of yield level. Also if your soil test is below a 5.5 and you haven’t limed (Liming is the best solution, Band-aids not so cheap Blog ), then the next best option is adding additional P to alleviate the aluminum toxicity Band-aids for low pH Blog. In-short if the fields soil test P and or pH is below optimum you should not forgo P application.
But the primary reason I am writing this blog is for those looking at fields with composite soil test that is right around the critical thresholds, and they are trying to make the call on to apply P or not to apply P. Even on fields with soil test values in the good level, I am usually in favor of banding in-furrow fertilizer wheat, but not because of the same reasons I am for corn. With corn you are planting in cool soils and the availability of nutrients like P is lower in cool wet soils. For wheat cold soil isn’t the concern until we reach the end of the planting window. It will serve as a bit of a “pop-up” as the crop comes out of dormancy in the spring. I have also seen little to no value of N applied in furrow. I see same response to DAP (18-46-0), MAP (11-52-0), and TSP (0-46-0) when all applied at same rate of P. Meaning it was the P not N making the difference.
For me the reason I still recommend getting a little phosphate out even when the soil test comes back is that the great majority of fields have a large range of variability. Looking at a set of 650 grid sampled fields across Oklahoma and Kansas it showed on average soil pH 6.0 and M3P was 34 ppm. Both pH and P are at adequate/optimum levels. However, the average is usually somewhere between the low and high point and in this data set and the range of soil pH was 1.8 units and the range in M3P was 67 ppm. That meant on average of the 648 field with pH values the average difference between low pH and high pH was 1.8 units and the difference between low P and high P was 64 ppm.

The field below is from Kingfisher county and was sampled at a resolution of 10 acres per sample. This is a fairly course resolution for grid sampling but provides a great view of how variable our soils can be. The field average pH is 5.3, which is below optimum but our aluminum tolerant wheats would be able to handle fairly well. For the P the average is 22 ppm which needs about 18 lbs of P2O5 to max yields. If the farmer applied a flat rate of 20 lbs there would be significant forage loss on about 65% of the field, for grain only about 45% of the field due to underapplication of P. Note that low P and low pH are not correlated well, meaning the areas low in pH are not always low in P.

Banding P makes it more efficient because it slows the rate of tie. However, we have plenty data that says broadcast applied P is still a great option, even after planting. So what are my take homes from this blog?
First: If you are grazing wheat get down 40-50 lbs of N pre. But I have plenty of data the pre-plant N on grain only wheat is not needed. I have the same amount of data that shows the only value of in-furrow N for grain only is that it forces you to plant more seeds, because it just lowers stand.
Second: When it comes to wheat pay attention to Phosphorus and soil pH. Even our acid tolerant wheats preform better in neutral soil pHs, especially forage wise.
Third: A composite soil sample is an AVERAGE of the field. If your average is right at the ok level (pH of 5.6ish and M3P of 30 ppm), then half of your field is below optimum and will benefit from P.
Fourth: If you can band P great, but if you cant broadcast is still a viable option. Do Not Skip P when soil test says there is a need.
Questions or comments please feel free to reach out.
Brian Arnall b.arnall@okstate.edu
Soil Acidity and Cotton Production
Raedan Sharry, Precision Nutrient Management Ph.D. student
Brian Arnall, Precision Nutrient Management Extension Specialist
Cotton production in Oklahoma has expanded the past decade into areas which other production systems such as continuous wheat may have traditionally dominated. Fields that have been managed for continuous wheat production may have become acidic in response to management practices, such as the use of ammoniacal nitrogen fertilizers. In response to the acidification of these soils it may be important to recognize and understand the potential impacts of soil acidification on cotton production.
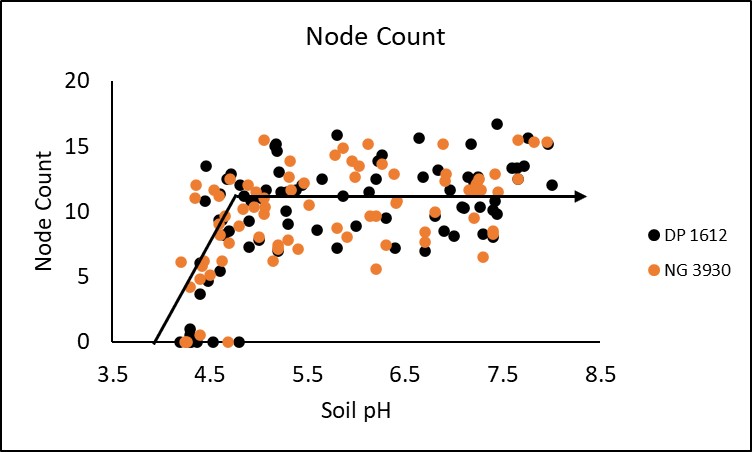
To better document the impact of soil pH on cotton lint yield and quality a study was conducted over the 2019 and 2020 growing seasons at two locations: Stillwater, OK (EFAW farm) and Perkins, OK. Soil pH in these experiments were adjusted to a depth of approximately 6 inches using aluminum sulfate (acidifying) and hydrated lime (alkalinizing). All three locations were planted to two varieties; NexGen 3930 and Deltapine 1612 at a rate of approximately 35,000 seeds per acre, into plots with soils ranging in pH from 4.0 to 8.0.
In season measurements taken included stand count, plant height, node count and NDVI (normalized difference vegetative index. All four in season measurements demonstrated a significant critical threshold in which soil pH negatively impacted crop performance. Stand was significantly decreased at a soil pH of 5.3 or lower. This trend is displayed in Figure 1. Plant height and node count depicted in figures 2 and 3 respectively were both significantly decreased when soil pH dropped below 5.3 and 4.9, while NDVI began to deteriorate around a pH of 5.1 (Figure 4). Response to soil pH level was also visually observable as shown by Figure 5 from the Perkins 2019 location.


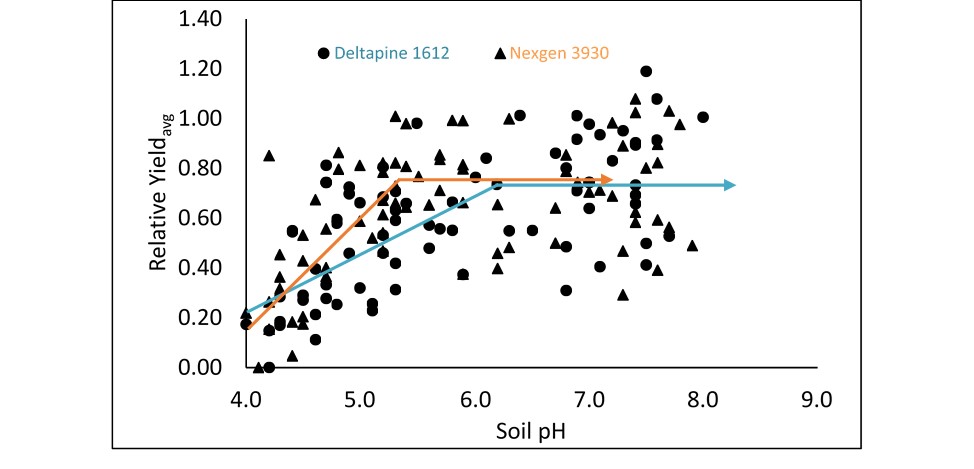
Yield levels across this experiment ranged from 0 to 1284 lbs. of lint per acre. In this work yield is reported as relative yield. To calculate relative yield the yield of each plot is normalized to the average of the three highest yields for that site. This method of reporting yield response allows this work to be applied across a range of yield environments.

When all sites and cultivars were combined relative yield reached a plateau at approximately 73% of yield with a critical threshold observed at a pH of 5.4. Below this critical threshold yield decreased at a rate of 37% per point of pH decline. This equates to 15% yield loss at a pH of 5.0, 33% yield loss at a pH of 4.5, and 52% yield loss at a pH of 4.5. This relationship is depicted in Figure 6. It is important to note that yield was 0 when pH was 4.3 in two plots. This represents the possibility for total crop failure when planting into very acidic conditions.
Differences in relative yield between cultivars were insignificant. However, further investigation may produce a significant difference. Critical threshold for the DP 1612 and NG 3930 cultivars were 6.1 and 5.2 respectively. This suggests that there may be value in further examining the influence of genetics on cotton response to soil acidity.
SUMMARY
The influence of soil pH level on cotton productivity is confirmed by this study. All three sites evaluated provided a strong correlation between soil pH and lint yield, as well as the in-season growth parameters measured. While this study is likely to be expanded to another location to provide a more robust evaluation of the potential impact of soil acidity on cotton, the current dataset provides ample evidence to conclude that soil acidity is likely to be detrimental to cotton production in the southern plains. Soil pH levels below 5.5 appear to provide the greatest opportunity for yield loss as depicted above. Lint quality measurements taken in the study (micronaire, length, uniformity, and strength) showed no consistent trends in the relationship between quality parameters and soil pH suggesting that soil acidity had a limited influence on lint quality characteristics. Cotton response to soil pH is likely to be influenced by the environment of a specific location and growing season. This underlines the importance of understanding the soil properties that negatively impact productivity, such as the presence of toxic forms of aluminum or manganese. It is also important to highlight the possibility of acidic conditions significantly affecting the ability of the crop to access important nutrients such as phosphorus. Under acidic conditions cotton productivity is likely to be significantly decreased unless soils are neutralized using a soil amendment such as lime.
Project Supported by the
Oklahoma Cotton Council
Cotton Incorporated
Oklahoma Fertilizer Checkoff Program
The challenge of collecting a representative soil sample
Guest Author, Dorivar Ruiz Diaz, Nutrient Management Specialist Kansas State University
At first glance, soil sampling would seem to be a relatively easy task. However, when you consider the variability that likely exists within a field because of inherent soil formation factors and past production practices, the collection of a representative soil sample becomes more of a challenge.
Before heading to the field to take the sample, be sure to have your objective clearly in mind. For instance, if all you want to learn is the average fertility level of a field to make a uniform maintenance application of P or K, then the sampling approach would be different than sampling for pH when establishing a new alfalfa seeding or sampling to develop a variable rate P application map.
In some cases, sampling procedures are predetermined and simply must be followed. For example, soil tests may be required for compliance with a nutrient management plan or environmental regulations associated with confined animal feeding operations. Sampling procedures for regulatory compliance are set by the regulatory agency and their sampling instructions must be followed exactly. Likewise, when collecting grid samples to use with a spatial statistics package for drawing nutrient maps, sampling procedures specific to that program should be followed.

Figure 1. The level of accuracy of the results of a soil test will depend, in part, on how many subsamples were taken to create the composite sample. In general, a composite sample should consist of 15 or more subsamples. For better accuracy, 20-30 cores, or subsamples, should be taken and combined into a representative sample. F
Regardless of the sampling objectives or requirements, some sampling practices should be followed:
- A soil sample should be a composite of many cores to minimize the effects of soil variability. Take a minimum of 12 to 15 cores from a relatively small area (two to four acres). Taking 20-30 cores will provide results that are more accurate. Take a greater number of cores on larger fields than smaller fields, but not necessarily in direct proportion to the greater acreage. A single core is not an acceptable sample.
- Use a consistent sampling depth for all cores because pH, organic matter, and nutrient levels often change with depth. Match sampling depth to sampling objectives. K-State recommendations call for a sampling depth of two feet for the mobile nutrients – nitrogen, sulfur, and chloride. A six-inch depth is suggested for routine tests of pH, organic matter, phosphorus (P), potassium (K), and zinc (Zn) (Figure 2).
- When sampling a specific area, a zigzag pattern across the field is better than following planting/tillage pattern to minimize any past non-uniform fertilizer application/tillage effects. With a GPS system available, recording of core locations is possible. This allows future samples to be taken from the same locations in the field.
- When sampling grid points for making variable rate nutrient application maps, collecting cores in a 5-10 foot radius around the center point of the grid is preferred for many spatial statistical software packages.
- Avoid unusual spots obvious by plant growth and/or visual soil color/texture differences. If information on these unusual areas is desired, collect a separate composite sample from these spots.
- If banded fertilizer has been used on the previous crop (such as strip tillage), then it is suggested that the number of cores taken should be increased to minimize the effect of an individual core on the composite sample results, and to obtain a better estimate of the average fertility for the field.
- For permanent sod or long-term no-till fields where nitrogen fertilizer has been broadcast on the surface, a three- or four-inch sampling depth would be advisable to monitor surface soil pH
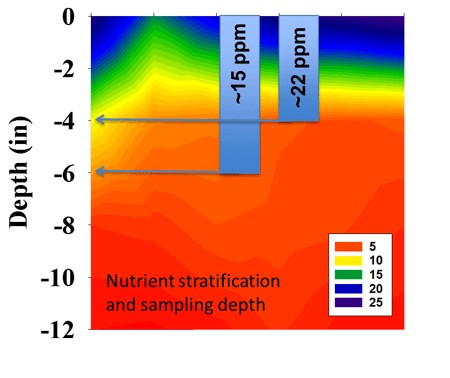
Figure 2. Consistency is sampling depth is particularly important for immobile nutrients like P. Stratification of nutrients and pH can be accentuated under reduced tillage.
Soil test results for organic matter, pH, and non-mobile nutrients (P, K, and Zn) change relatively slowly over time, making it possible to monitor changes if soil samples are collected from the same field following the same sampling procedures. However, there can be some seasonal variability and previous crop effects. Therefore, soil samples should be collected at the same time of year and after the same crop.
Soil test results for organic matter, pH, and non-mobile nutrients (P, K, and Zn) change relatively slowly over time, making it possible to monitor changes if soil samples are collected from the same field following the same sampling procedures. However, there can be some seasonal variability and previous crop effects. Therefore, soil samples should be collected at the same time of year and after the same crop.
Soil testing should be the first step for a good nutrient management program, but it all starts with the proper sample collection procedure. After harvest in the fall is good time for soil sampling for most limiting nutrients in Kansas.
For instructions on submitting soil samples to the K-State Soil Testing Lab, please see the accompanying article “Fall soil sampling: Sample collection and submission to K-State Soil Testing Lab” found in this eUpdate issue.
For any questions Contact.
Dorivar Ruiz Diaz, Nutrient Management Specialist
ruizdiaz@ksu.edu
Soil sampling for pH and liming in continuous no-till fields
Quest Author, Dorivar Ruiz Diaz, Nutrient Management Specialist Kansas State University
One question that commonly comes up with continuous no-till operations is: “How deep should I sample soils for pH?” Another common question is: “How should the lime be applied if the soil is acidic and the field needs lime?”.
Sampling depth in continuous no-till
Our standard recommendation for pH is to take one set of samples to a 0-6 inch depth. On continuous no-till fields where most or all of the nitrogen (N) is surface applied, we recommend taking a second sample to a 0-3-inch depth. We make the same recommendation for long-term pasture or grass hayfields, such as a bromegrass field that has been fertilized with urea annually for several years.
Nitrogen fertilizer is the primary driving force in lowering soil pH levels, so N application rates and methods must be considered when determining how deep to sample for pH. In no-till, the effects of N fertilizer on lowering pH are most pronounced in the area where the fertilizer is actually applied. In a tilled system, the applied N or acid produced through nitrification is mixed in through the action of tillage and distributed throughout the tilled area.
Where N sources such as urea or liquid UAN solutions are broadcast on the surface in no-till system, the pH effects of the acid formed by nitrification of the ammonium will be confined to the surface few inches of soil. Initially this may be just the top 1 to 2 inches but over time, and as N rates increase, the effect of acidity become more pronounced, and the pH drops at deeper depths (Figure 1). How deep and how quickly the acidity develops over time is primarily a function of N rate and soil CEC (cation exchange capacity), or buffering capacity.
Where anhydrous ammonia is applied, or liquid UAN banded with the strip-till below the surface, an acid zone will develop deeper in the soil. As with long-term surface applications, these bands will expand over time as more and more N fertilizer is placed in the same general area. The graphic below (Figure 1) illustrates the effect of repeated nitrogen and phosphorus application with strip-till in the same area in the row middle on a high CEC soil for more than 12 years.

Figure 1. Soil pH stratification after 25 years of no-till and surface nitrogen fertilizer application, and the effect of repeated fertilizer application with strip-till in the same area after 12 years.
Liming application methods in continuous no-till
Where do you place the lime in continuous no-till?
If you surface apply N, then surface apply the lime. That’s a simple but effective rule. But remember that surface-applied lime will likely only neutralize the acidity in the top 2-3 inches of soil. So if a producer hasn’t limed for 20 years of continuous no-till and has applied 100 to 150 pounds of N per year, there will probably be a 4-5 inch thick acid zone, and the bottom half of that zone may not be neutralized from surface-applied lime. So, if a producer is only able to neutralize the top 3 inches of a 5-inch deep surface zone of acid soil, would that suggest he needs to incorporate lime? Not really. Research has shown that as long as the surface is in an appropriate range and the remainder of the acid soil is above pH 5, crops will do fine.
Liming benefits crop production in large part by reducing toxic aluminum, supplying calcium and magnesium, and enhancing the activity of some herbicides. Aluminum toxicity doesn’t occur until the soil pH is normally below about 5.2 to 5.5 and KCl-extractable (free aluminum) levels are greater than 25 parts per million (ppm). At that pH the Al in soil solution begins to increase dramatically as pH declines further. Aluminum is toxic to plant roots, and at worse the roots would not grow well in the remaining acid zone.
This implies that the acid zones from ammonia or banded UAN are probably not a major problem. We have monitored ammonia bands in the row middles of long-term no-till for many years and while the pH dropped very low, we never saw any adverse impacts on the crop that would justify liming and using tillage to incorporate the lime. In fact, some nutrients such as zinc, manganese, and iron can become more available at low pH, which can be an advantage at times.
Yield enhancement is not the only concern with low-pH soils, however. Herbicide effectiveness must also be considered. The most commonly used soil-applied herbicide impacted by pH is atrazine. As pH goes down, activity and performance goes down. So in acidic soils, weed control may be impacted. We do see that happen in corn and sorghum production.
Liming products for no-till
When choosing a liming product, is there any value to using dolomitic lime (which contains a large percentage of magnesium in addition to calcium) over a purely calcium-based lime product?
Most Kansas soils have high magnesium content. So as long as we maintain a reasonable soil pH, there normally is enough magnesium present to supply the needs of a crop. Calcium content is normally significantly higher than magnesium, so calcium deficiency is very, very rare in Kansas. The soil pH would need to be below 4.5 before calcium deficiency would become an issue. Before calcium deficiency would occur, aluminum toxicity or manganese toxicity would be severely impacting crop growth. So producers really don’t have to worry about a deficiency of calcium or magnesium on most Kansas soils.
What about the use of pelletized lime as a pH management tool on no-till fields?
The idea has been around for a while to use pel-lime in low doses to neutralize the acidity created from nitrogen and prevent acid zones from developing. . Pel-lime is a very high-quality product, normally having 1800 to 2000 pounds of effective calcium carbonate (ECC) per ton, and can be blended with fertilizers such as MAP or DAP or potash easily. Therefore, if you apply enough product this can be an excellent source of lime. Lime can be from various sources and with different qualities. Consecutively, to ensure a standardized unit of soil-acidity neutralizing potential, we use units of ECC.
Summary
Applying N fertilizer to soil will cause the soil to become acidic over time. Placement of the applied N and the level of soil mixing done through tillage determine where the acid zones will develop. Make sure your soil testing program is focused on the area in the soil becoming acidic, and apply the lime accordingly.
For any questions Contact.
Dorivar Ruiz Diaz, Nutrient Management Specialist
ruizdiaz@ksu.edu
