Home » Phosphorus
Category Archives: Phosphorus

Banding P for Acidic Soils: Its not the time to be paying for poor practice.
I am bringing this topic back to the surface now with the current outlook on phosphorus fertilizer. If you have heard its not only becoming more expensive but the supply is short and will likely stay short through summer into the fall, which wont help prices. So this year’s wheat crop, we need to be prepared to be smart with Phosphorus, and applying an extra 30lbs to band aid for soil acidity should not be in the cards. Look at it this way, if the phosphorus was at $0.66 a lb that $20 that could be spent on a ton of lime. That lime will last 3-5 years, while that P needs to be added every year. Not only that, but the lime will help root growth (better when we dry up), produce significantly more biomass, and make the phosphorus you’ve applied in the past available again for plant uptake. So make the plans now to soil sample as soon as this crop is off, you can get a soil test recommendation and plan for the lime trucks. This is also not the year to just apply phosphorus for the sake of applying. Soil tests are inexpensive relative to buying excess fertilizer.
Current quotes on 4.24.26 are at $0.54 + per lbs P2O5 with DAP at $830 a ton.
Quick Fertilizer Price Calculation:
Urea at $860 a ton means N is $0.93 a lbs.
DAP at $830 has $334 worth of $0.93 nitrogen and $495 of phosphorus at $0.54 a lb.
Banding P as a band-aid for soil acidity, not so cheap now.
Original Blog Posted in 2021
Whoi Cho, PhD student Ag Economics advised by Dr. Wade Brorsen
Raedan Sharry, PhD Student Soil Science advised by Dr. Brian Arnall
Brian Arnall, Precision Nutrient Management Extension.
In 2014 I wrote the blog Banding P as a Band-Aid for low-pH soils. Banding phosphate to alleviate soil acidity has been a long practiced approach in the southern Great Plains. The blog that follows is a summary of a recent publication that re-evaluated this practices economic viability.
Many Oklahoma wheat fields are impacted by soil acidity and the associated aluminum (Al) toxicity that comes with the low soil pH. The increased availability of the toxic AL3+ leads to reduced grain and forage yields by impacting the ability of the plant to reach important nutrients and moisture by inhibiting root growth. Aluminum can also tie up phosphorus in the soil, further intensifying the negative effects of soil acidity. More on the causes and implication of soil acidity can be found in factsheet PSS-2239 or here (https://extension.okstate.edu/fact-sheets/cause-and-effects-of-soil-acidity.html). The acidification of many of Oklahoma’s fields has left producers with important choices on how to best manage their fields to maximize profit.

Two specific management strategies are widely utilized in Oklahoma to counter the negative impacts of soil acidification: Lime application and banding phosphorus (P) fertilizer with seed. While banding P with seed ties up Al allowing the crop to grow, this effect is only temporary, and application will be required every year. The effects of liming are longer lasting and corrects soil acidity instead of just relieving Al toxicity. Historically banding P has been a popular alternative to liming largely due to the much lower initial cost of application. However, as P fertilizers continue to increase in cost the choice between banding P and liming needed to be reconsidered.
A recent study by Cho et al.,2020 compared the profitability of liming versus banding P in a continuous wheat system considering the impacts that lime cost, wheat price and yield goal has on the comparison. This work compared the net present value (NPV) of lime and banded P. The study considered yield goal level (40 and 60 bu/ac) as well as the price of P2O5 fertilizer and Ag Lime. The price of P2O5 used in this study was $0.43 lb-1 while lime price was dictated by distance from quarry, close to quarry being approximately $43 ton-1 and far being $81 ton-1. For all intents and purposes these lime values are equivalent to total lime cost including application. Wheat prices utilized in the study were $5.10 bu-1 and $7.91 bu-1. It is important to note that baseline yield level was not considered sustainable under banded P management in this analysis. This resulted in a decrease in yield of approximately 3.2 bu ac-1 per year. This is attributable to the expected continued decline in pH when banding P is the management technique of choice.
The analysis in this work showed that lime application is cost prohibitive in the short term (1 year) when compared with banding P regardless of lime cost, yield goal level, and wheat value (within the scope of this study). This same result can be seen over a two-year span when yield is at the lower level (40 bu ac-1). While in the short-term banding P was shown to be a viable alternative to liming, as producers are able to control ground longer lime application becomes the more appealing option, especially when producers can plan for more than 3 years of future production. In fact, under no set of circumstances did banding P provide greater economic return than liming regardless of crop value, yield, or liming cost when more than 3 years of production were considered and only under one scenario did banded P provide a higher NPV in a 3-year planning horizon.
While historically banding P was a profitable alternative to lime application for many wheat producers the situation has likely drastically changed. At the time of writing this blog (09/17/2021) Diammonium Phosphate (DAP) at the Two Rivers Cooperative was priced at $0.78 lb-1. of P2O5. This is a drastic increase in P cost over the last year or so since Cho et al. was published in 2020. With P fertilizer prices remaining high it will be important for producers to continue to consider the value of liming compared to banded P. This is particularly crucial for those producers who can make plans over a longer time frame, especially those more than 3 years.
Addendum: As fertilizer prices have continued to rise a quick analysis utilizing the $0.78 lb-1 of P2O5was completed to consider the higher P fertilizer cost. Under this analysis an estimated decrease in NPV of approximately $38 an acre for P banding occurred. When considering this change in NPV, lime application becomes the more profitable option for alleviation of soil acidity symptoms even in the short term (assuming lime price values are equivalent to the previous analysis). This underlines the fact that it is imperative to consider the impact on profitability of the liming vs. banding P decision in the current economic climate for agricultural inputs.
Link to the Open Access Peer Reviewed publication “Banding of phosphorus as an alternative to lime for wheat in acid soil” https://doi.org/10.1002/agg2.20071
Mechanisms of Soil Fertility: Looking at Biologicals and MOA
Brian Arnall, Oklahoma State University Precision Nutrient Management
The use of biological products in commercial agriculture has expanded rapidly, with large corporations entering a space once dominated by smaller groups. This has created an arms race, with nearly every company offering a biological product. Over the past twenty years, I have had the opportunity to test products from the biggest groups with billions in backing, to solutions raised in stock tanks delivered in Braums milk jugs. It is critical to understand what is in the jug and the biological function it is expected to perform. Like herbicides, knowing the mode of action determines whether the product fits the intended purpose. No different than herbicides and knowing mode of actions. It’s important to know and understand that if you are trying to kill ryegrass 2.4-D, a broadleaf herbicide is not the right answer.
So what are we working with that’s in these products?
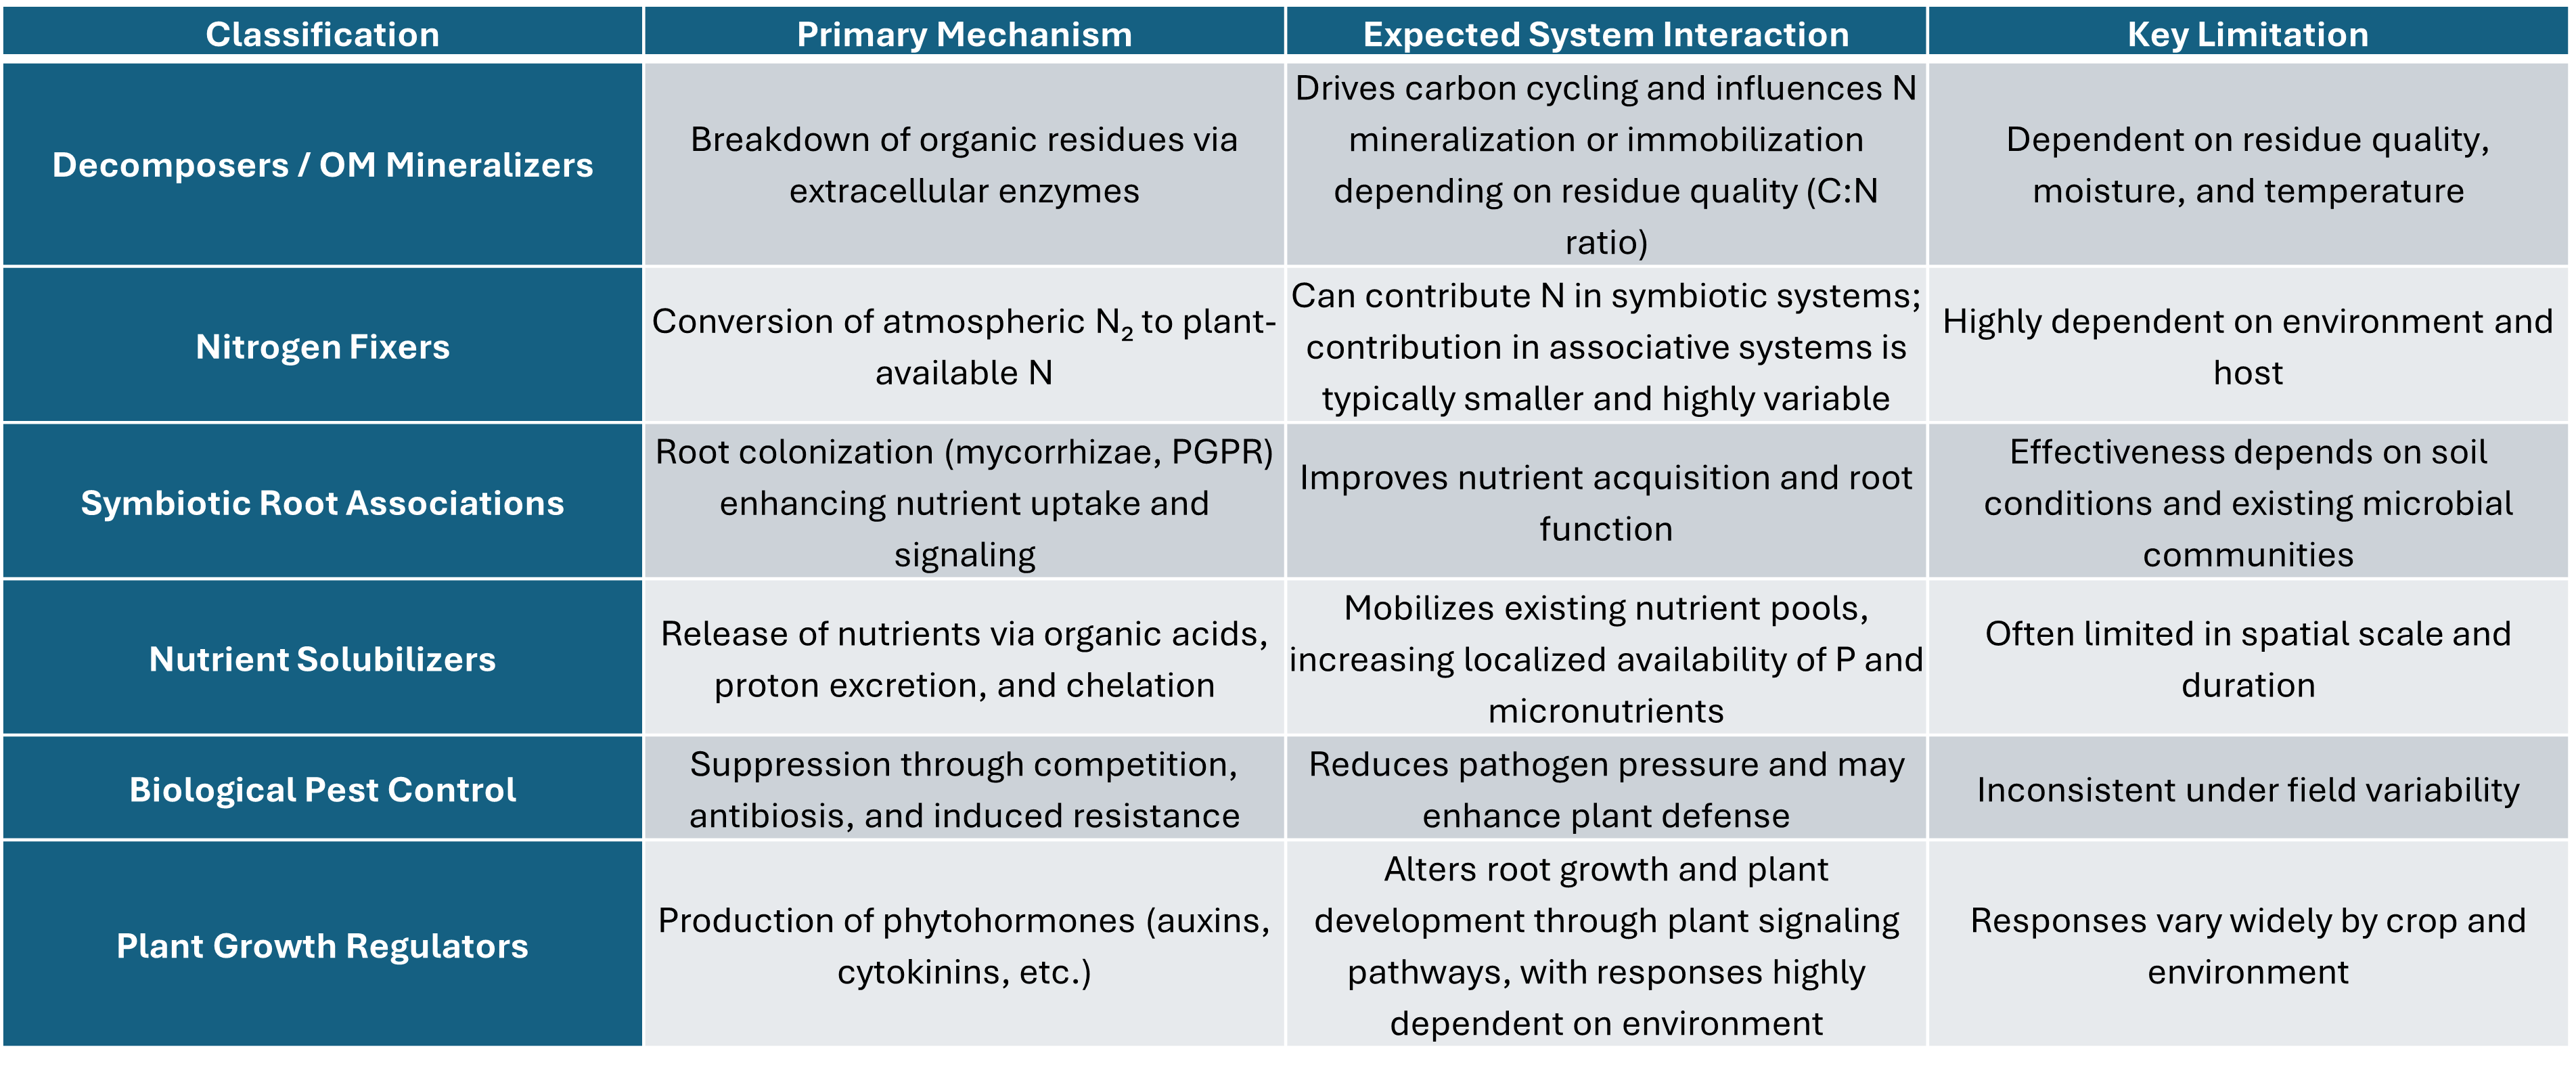
My approach has been to classify the products by operation not by species or genre. Doing so I have grouped products into five biological classifications and a sixth group, which is often in concluded in conversations.
Decomposers / Organic Matter Mineralizers
Nitrogen Fixers (Symbiotic and Associative)
Symbiotic Root Associations (Mycorrhizae, PGPR)
Nutrient Solubilizers
Biological Pest Control
Plant Growth Regulators (Hormonal Effects)
So, let’s dig into each of the mechanisms.
Decomposers / Organic Matter Mineralizers
Decomposition is carried out by a diverse group of organisms including fungi (e.g., Trichoderma, Aspergillus), bacteria (e.g., Bacillus, Pseudomonas), and actinomycetes (e.g., Streptomyces), each contributing to the breakdown of organic materials through different enzymatic pathways. This process of decomposing organic matter releases the nutrients tied up into plant available forms. The release of nitrogen is usually first thought, but this process adds significant amounts of potassium, calcium, and magnesium.
The process occurs both in the soil and on the soil surface. While it seems simple in application though this is a complex process. Let’s start with the soil pool, triggering decomposition of a system where the previous crop was wheat is significantly different than following corn. Following wheat, the carbon nitrogen ratio will be very high (see sugar blog), so while decomposition will release cations such as potassium and calcium, it is very likely to immobilize and residual nitrogen in the system. However, in fields that previously had corn the carbon to nitrogen ratio is much closer and the probability of seeing nitrogen release is much higher (Kuzyakov & Blagodatskaya, 2015). The process is similar for surface residues, but the rate is heavily controlled by rainfall. While both the soil and surface systems require moisture for the process to progress, the surface moisture is much more dynamic with frequent wetting and drying. Rain or irrigation is also needed to move the nutrients into the root zone.
One aspect of increasing decomposition of OM that I do not have a handle on is the long-term impact of expediting OM breakdown in and on the soil, especially in the central plains. As mentioned in the sugar blog, you would hope that the increase in nutrients from OM decomposition would increase plant growth enough to replenish the OM that was burned up. One caveat to this is that the decomposition would have to add nutrients that are deficient. Otherwise, there is no increase in plant growth and hypothetically the system is not net negative on OM. When it comes to decomposing surface residue, I have always been a bit hesitant in Oklahoma as I see having surface coverage to preserve soil moisture typically has a greater value than the nutrients from the residue.
Nitrogen Fixers (Symbiotic and Associative)
Nitrogen fixation is carried out by both symbiotic organisms such as Rhizobium and Bradyrhizobium, which form nodules on plant roots and supply significant nitrogen, and associative organisms such as Azospirillum and Azotobacter, which reside in the rhizosphere and contribute smaller, more variable amounts of nitrogen. Symbiotic nitrogen fixation, such as we have come to expect from legumes, is tightly regulated by the plant, with carbon supplied to the microbe in exchange for fixed nitrogen, making it one of the most efficient biological nitrogen inputs in agriculture.
Associative nitrogen fixation is not directly coupled to plant demand, and nitrogen contributions are typically limited by carbon availability and environmental conditions (Kennedy et al., 2004). While these organisms possess the ability to fix atmospheric nitrogen, the magnitude of nitrogen contribution, particularly from non-symbiotic systems, is highly variable and often limited under field conditions. We know that in soybean nodulation is greatly reduced when excess nitrogen is present in the soil, basically the plant does not need rhizobia, so it does not trigger symbiosis. I expect that as we move symbiotic fixation out of legumes that this mechanism does not change. Finally fixed N is no different than fertilizer N, if you add more then the crop needs, its lost. Therefore, if I am planning to use a N fixer, I would significantly reduce the amount of fertilizer N apply well below crop demand. Otherwise, the money spent on the N fixer is a waste. The only argument I have heard for this is the security blanket, making sure that if more is needed than normally the system is covered. But I circle back to the question about a system with high levels of residual N and rhizobium nodulation.
Symbiotic Root Associations (Mycorrhizae, PGPR)
Symbiotic root associations include arbuscular mycorrhizal fungi (e.g., Rhizophagus, Funneliformis) that extend the effective root system and improve nutrient uptake, particularly phosphorus, as well as plant growth-promoting rhizobacteria (e.g., Pseudomonas, Bacillus) that influence root development and plant signaling through multiple biochemical pathways (Smith & Read, 2008). In my visits with soil microbiologist, I have been left with the understanding that these relationships are not generic, but quite specific. There is significant influence of genotype and environment. And even more interesting is that the majority expect that the plant needs to signal for this relationship to happen.
The effectiveness of these associations is highly dependent on soil conditions, existing microbial communities, and nutrient availability, with responses often diminishing in systems where nutrients are not limited or where native populations are already established. I was able to follow along with some work down at OSU a few years back that was working with sorghum looking for symbiotic relationships to improve water and nutrient uptake specifically phosphorus. The work was successful, the researchers were able to identify a AMF that created a symbiotic relationship with sorghum, with a few caveats. First land race cultivars had a much higher incidence of symbiosis. For the landraces it worked well in extremely nutrient depleted soils and any additions of N or P reduced forage yield over the none. In the end the researchers were able to show improved the grain yield in landraces above fertilized, but these yields did equal fertilized hybrids. This work had great impact on small holders in developing counties with limited resources.
Nutrient Solubilizers
Nutrient solubilization is carried out by organisms such as Bacillus, Pseudomonas, and Aspergillus, which increase nutrient availability through mechanisms including organic acid production, proton release, and chelation, allowing nutrients like phosphorus and micronutrients to become more accessible in the rhizosphere.
Phosphorus-solubilizing fungi, such as Aspergillus and Penicillium, function similarly to bacterial solubilizers but are often more effective at producing strong organic acids. These acids can lower pH in localized zones and release phosphorus from mineral-bound forms, particularly in soils with high fixation capacity. Fungal systems can operate across a wider range of environmental conditions and may play a larger role in longer-term phosphorus cycling. However, as with bacterial systems, these effects are generally localized and dependent on soil chemistry (Richardson et al., 2009). I tend to see these having the greatest benefits in systems that have historically received manures or long-term applications of fertilizer P. I do not believe this is a good fit for soils with limited available phosphorus, as it is trying to focus the soil into something, it does not want to do or have too spare.
Potassium-solubilizing organisms, including species such as Bacillus mucilaginosus and Frateuria aurantia, contribute to the release of potassium from primary minerals like feldspars and micas. These microbes facilitate mineral weathering through acidification and chelation processes that slowly break down mineral structures. While the mechanism is well understood, the rate of potassium release is typically slow relative to crop demand. As a result, these organisms are more influential in long-term soil development than in short-term fertility management (Sheng & He, 2006).
Micronutrient-mobilizing organisms, particularly Pseudomonas and Bacillus species, enhance availability through the production of siderophores and other chelating compounds. These molecules bind metals such as iron and zinc, increasing their solubility and facilitating uptake in the rhizosphere. This process is especially important in soils where micronutrients are present but not readily available due to chemical constraints. However, the impact is typically limited to the immediate root zone and depends on both microbial activity and soil conditions (Ahmed & Holmström, 2014).
Biological Pest Control
Biological pest control organisms, including species such as Bacillus, Pseudomonas, and Trichoderma, function by suppressing pathogens through several well-documented mechanisms. These include the production of inhibitory compounds, competition for space and nutrients, direct antagonism of pathogens, and the activation of plant defense systems through induced systemic resistance. While these mechanisms are well established under controlled conditions, their effectiveness in field environments is highly dependent on environmental conditions, pathogen pressure, and the ability of the organism to persist and colonize the soil or plant surface (Lugtenberg & Kamilova, 2009).
I’ve been working with a lot of folks from Brazil who historically make four to six nemacide applications in soybean, but utilizing Pseudomanas they have been able to reduce that number by half or more. The caveat, as I understand, the application rates needed are significantly higher than anything I have seen in the US. If you look through the literature, you are seeing more and more documentation of this such as Li et al. 2022. But as Spescha et al. (2023) documented, different biological control agents operate through complementary mechanisms, including infection, toxin production, and host targeting. However, effectiveness depended on environmental conditions and interactions among organisms, reinforcing that biological control outcomes are system-dependent rather than universally consistent.
Plant Growth Regulators (Hormonal Effects)
This group differs slightly, as the primary effect is not direct nutrient cycling but modification of plant physiological response. This group is one I hold the greatest expectations for. I mean we have been using PGRs in crop production for decades, we just did not have an inkling of how many PGRs exist.
Plant growth regulator effects are associated with organisms such as Azospirillum, Bacillus, and Pseudomonas, which can influence plant development through the production of phytohormones and related compounds. These microbes produce substances such as auxins, cytokinins, and gibberellins that alter root architecture and plant growth patterns, and in some cases reduce stress responses through enzymes like ACC deaminase. Rather than supplying nutrients directly, these organisms modify how plants respond to their environment and utilize available resources. However, just like everything previously discussed the magnitude of response is often subtle and highly dependent on environmental conditions and crop system interactions (Glick, 2012).
Final thoughts.
There is one situation that pops up that I do not agree with, based upon my limited understanding of soil microbiology. Its adding more of what is already there. The soil system is a dynamic system. While there are population booms and bust, it supports what it is able to. Adding more of what is already there is like dropping a million rabbits into a prairie that has rabbits already. The current population is where it is because that is what the system can support. Adding means one of two things, a lot of rabbits die immediately, or they overwhelm the system and another animal species dies off due to lack of resources. Also, most microbiologists tell me the system is amazing at signaling and finding what it wants. It may take a season, but it will be there, in the quantities that soil needs, just given time.
So, the final slide in all my biological additives talks ends with this statement. My experiments show one thing. The impact of adding these products on crop yields is very consistently inconsistent. I’ve had many show a significant positive response, once. I have struggled to ever get repeated successes. It is my belief that I will have more success improving the soil biome by managing the soil (no-till, crop rotation, cover crops) than I will ever have with adding a product.
Final comment, Read the label. Many of the biological products I have tested are not singularly pure species. There are many blends of species and organisms which encompass many of the modes. A lot of these blends also contain extras such as humics, fulvics, carbohydrates, and sugars, see previous blogs.
Take-Home Messages
- Biological products function through specific mechanisms, not as broad “boosters,” and understanding that mechanism is critical to proper use.
- The presence of a biological function does not guarantee a yield response, outcomes are driven by soil, crop, and environmental conditions
- Decomposers and carbon-driven systems can immobilize or mineralize nitrogen, depending largely on residue quality and system balance
- Mycorrhizae and PGPR improve access to existing nutrients, not total nutrient supply
- Nutrient-solubilizing organisms mobilize nutrients already present in the soil
- Plant growth regulators influence plant signaling and development
- Adding biological organisms to soil does not guarantee establishment or persistence, as soil systems can regulate microbial populations.
- Management practices such as no-till, crop rotation, and cover crops are effective at improving soil biological function
- Across all biological products, mechanism exists, but response depends on the system
Any questions or comments please reachout to me @ b.arnall@okstate.edu
Citations
Ahmed, E., & Holmström, S. J. M. (2014). Siderophores in environmental research: Roles and applications. Microbial Biotechnology, 7(3), 196–208.
Glick, B. R. (2012). Plant growth-promoting bacteria: Mechanisms and applications. Scientifica, 2012, 963401
Kennedy, I. R., Choudhury, A. T. M. A., & Kecskés, M. L. (2004).
Non-symbiotic bacterial diazotrophs in crop-farming systems. Plant and Soil, 266, 65–79.
Kuzyakov, Y., & Blagodatskaya, E. (2015).
Microbial hotspots and hot moments in soil. Soil Biology and Biochemistry, 83, 184–199.
Lugtenberg, B., & Kamilova, F. (2009). Plant-growth-promoting rhizobacteria. Annual Review of Microbiology, 63, 541–556.
Richardson, A. E., Barea, J. M., McNeill, A. M., & Prigent-Combaret, C. (2009). Acquisition of phosphorus and nitrogen in the rhizosphere and plant growth promotion by microorganisms. Plant and Soil, 321(1–2), 305–339.
Sheng, X. F., & He, L. Y. (2006). Solubilization of potassium-bearing minerals by a wild-type strain of Bacillus edaphicus and its mutants and increased potassium uptake by wheat. Canadian Journal of Microbiology, 52(1), 66–72. https://doi.org/10.1139/w05-117
Smith, S. E., & Read, D. J. (2008).
Mycorrhizal symbiosis. Academic Press.
Spescha, A., Weibel, J., Wyser, L., Brunner, M., Hess Hermida, M., Moix, A., Scheibler, F., Guyer, A., Campos-Herrera, R., Grabenweger, G., & Maurhofer, M. (2023). Combining entomopathogenic Pseudomonas bacteria, nematodes and fungi for biological control of a below-ground insect pest. Agriculture, Ecosystems & Environment, 348, 108414.
Ye S, Yan R, Li X, Lin Y, Yang Z, Ma Y and Ding Z (2022) Biocontrol potential of Pseudomonas rhodesiae GC-7 against the root-knot nematode Meloidogyne graminicola through both antagonistic effects and induced plant resistance. Front. Microbiol. 13:1025727. doi: 10.3389/fmicb.2022.1025727

Phosphorus decisions, Is it worth cutting P?
With the current conditions and input cost many wheat producers are considering cutting back on inputs. I can’t disagree with the plan, but I would caution against what you cut. If you have read any of my past blogs, or seen me speak, you should know I’m all for cutting back on pre-plant nitrogen (N). Based on some recent trials I would not argue cutting the potassium (K) side, but phosphorus (P) that’s another story that we will walk through in this blog.
First and foremost, soil testing is the key to P management. If your soil test is below the critical threshold for the test you use, 32.5 for Mehlich 3 (M3P), then you need to add phos. We have enough work that shows current recommendations work for P in wheat. Reeds paper Evaluation of incorporated phosphorus fertilizer recommendations on no-till managed winter wheat Link to Paper goes over soil test recommendations in no-till and the recent double crop soybean project Double Crop P and K Blog highlights the importance of P fertility, regardless of yield level. Also if your soil test is below a 5.5 and you haven’t limed (Liming is the best solution, Band-aids not so cheap Blog ), then the next best option is adding additional P to alleviate the aluminum toxicity Band-aids for low pH Blog. In-short if the fields soil test P and or pH is below optimum you should not forgo P application.
But the primary reason I am writing this blog is for those looking at fields with composite soil test that is right around the critical thresholds, and they are trying to make the call on to apply P or not to apply P. Even on fields with soil test values in the good level, I am usually in favor of banding in-furrow fertilizer wheat, but not because of the same reasons I am for corn. With corn you are planting in cool soils and the availability of nutrients like P is lower in cool wet soils. For wheat cold soil isn’t the concern until we reach the end of the planting window. It will serve as a bit of a “pop-up” as the crop comes out of dormancy in the spring. I have also seen little to no value of N applied in furrow. I see same response to DAP (18-46-0), MAP (11-52-0), and TSP (0-46-0) when all applied at same rate of P. Meaning it was the P not N making the difference.
For me the reason I still recommend getting a little phosphate out even when the soil test comes back is that the great majority of fields have a large range of variability. Looking at a set of 650 grid sampled fields across Oklahoma and Kansas it showed on average soil pH 6.0 and M3P was 34 ppm. Both pH and P are at adequate/optimum levels. However, the average is usually somewhere between the low and high point and in this data set and the range of soil pH was 1.8 units and the range in M3P was 67 ppm. That meant on average of the 648 field with pH values the average difference between low pH and high pH was 1.8 units and the difference between low P and high P was 64 ppm.

The field below is from Kingfisher county and was sampled at a resolution of 10 acres per sample. This is a fairly course resolution for grid sampling but provides a great view of how variable our soils can be. The field average pH is 5.3, which is below optimum but our aluminum tolerant wheats would be able to handle fairly well. For the P the average is 22 ppm which needs about 18 lbs of P2O5 to max yields. If the farmer applied a flat rate of 20 lbs there would be significant forage loss on about 65% of the field, for grain only about 45% of the field due to underapplication of P. Note that low P and low pH are not correlated well, meaning the areas low in pH are not always low in P.

Banding P makes it more efficient because it slows the rate of tie. However, we have plenty data that says broadcast applied P is still a great option, even after planting. So what are my take homes from this blog?
First: If you are grazing wheat get down 40-50 lbs of N pre. But I have plenty of data the pre-plant N on grain only wheat is not needed. I have the same amount of data that shows the only value of in-furrow N for grain only is that it forces you to plant more seeds, because it just lowers stand.
Second: When it comes to wheat pay attention to Phosphorus and soil pH. Even our acid tolerant wheats preform better in neutral soil pHs, especially forage wise.
Third: A composite soil sample is an AVERAGE of the field. If your average is right at the ok level (pH of 5.6ish and M3P of 30 ppm), then half of your field is below optimum and will benefit from P.
Fourth: If you can band P great, but if you cant broadcast is still a viable option. Do Not Skip P when soil test says there is a need.
Questions or comments please feel free to reach out.
Brian Arnall b.arnall@okstate.edu

Top-dress Wheat with P and K ??
Brian Arnall, Precision Nutrient Management Extension Specialist
Hunter Lovewell, Past PNM MS student.
Original Blog Name: Managing P and K in a wheat Double-crop Soybean System.
I planned to wait until the soybean yields came in to share the data from this project, but the wheat results are just too interesting this year.
So the trial posed the question, when is the best time to apply the phosphorus (P) and potassium (K) for the soybean crop in a wheat double crop soybean system, if any is needed above what is applied for the wheat crop. We applied the wheat’s P&K at establishment, but the soybeans P&K was applied either at wheat establishment, top-dress wheat timing, or post wheat harvest pre soybean planting. We used the sources of granular triple super phosphate (0-46-0) and potash (0-0-60) for all applications. We hypothesized the wheat crop would not benefit from the soybeans portion of P&K and that the top-dress application timing for the soybeans P&K would result in the greatest soybean yields.

So far, we have six site years with completed cycles with locations at the Eastern Research Station (ERS) near Haskell, Oklahoma, Ballagh Family Research Farm (BF) near Newkirk, Oklahoma, Skagg Family Farm (SF) near Lamont, Oklahoma, and Lake Carl Blackwell Research Farm (LCB) near Perry, Oklahoma. The research was conducted during the 2019-2020 growing season and the 2020-2021 growing season. For the 2021-2022 cycle we added two more locations one again on the Skagg Family farm and the second on a new cooperator, O’Neil Farms (OF) near Ponca City. For all locations no P or K was applied by the farmers at any point, but they did manage IPM. See location descriptions below.

The first two years of work is written up in Mr. Hunter Lovewell’s thesis titled “EFFECTS OF PHOSPHOROUS AND POTASSIUM APPLICATION TIMING ON A WHEAT DOUBLE-CROP SOYBEAN SYSTEM” which I can share with those interested. To be honest, Hunter had a couple tough seasons. Basically where wheat did well, beans typically failed and where you had good beans the previous wheat had failed. All the same he had some interesting results. What follows is pulled from his conclusions.
“While a significant response to the application of P and K was limited, the results show that there are environments in which the wheat crop can benefit from additional P and K fertilizer applied for the soybean crop. In the case of the soil (SF-SH) with low M3P and an acidic soil pH, the additional P applied during the winter wheat growing season, intended for soybeans, alleviated the aluminum toxicity issues with acidic pH, increasing wheat yields. Beyond the single location with low soil test P and pH no other significant response was found to the addition of and P. This may be explained in that most locations were only marginally deficient P and the majority of the varieties used in the study were considered to have acid soil tolerance. Penn and Arnall (2015) found that cultivars with aluminum tolerance had increased P use efficiency. The BF location showed a significant wheat grain yield response to the K fertilization, but the additional K applied for the soybean crop showed no benefit for the wheat crop. While there was no significant increase in soybean grain yield to the additional K fertilizer observations suggest that the application of K fertilizer for soybeans may be of benefit. As was mentioned before the double-crop system is susceptible to yield-limiting conditions, heat, and moisture, due to the maturity of the crop during the peak summer months. The soybean grain yields achieved in this study were all below the previous five-year yield average for all the locations. The low achieved yields and crop stress may have limited this study’s ability to identify a significant response to the application of fertilizer. “
So, one of the most interesting finding from the first six sites was that topdressing P increased yield of the wheat crop on the soil that had low pH and P. And since the P recs applied were only considering STP values and not soil pH, we had underapplied P for the wheat.
Now moving on to the 2021-22 season. Well as most of the famers know, this season has been a doozy. That said, we were not able to establish the treatments until February 1st. Therefor in the case of the 2021-22 wheat season the first application of P&K was made at top-dress timing and then the second application was made post wheat harvest. So, we are unable to say how a preplant wheat P&K application would have performed. But the wheat grain yield response to P&K was better than I could have ever imagined.

The rain post application (Feb 1st) was marginal but better than other areas in the central/southern Plains. There was about 1” of precipitation in February, almost 3” in March and under 0.2” in April. May rains for the OF site near Burbank aided in allowing the yields to climb, maxed out at 82 bushels per acre, while the SF-Nfld missed out on many of the late rains and yields topped out at 39 bushels.

At both sites there is a clear and distinct response to P fertilizer. Note the N and NK treatments significantly lower than all other treatments. The last column on each figure title NPK is the average of all other treatments that only received the wheats P&K rate and had yet had the soybeans P&K applications.
We were able to statistically analyze the locations together by calculating a relative yield for each location. This is done by dividing the yield of each plot by the yield of the N only treatment, we did this for each replication. We then ran a t-test to look at significant treatment difference, so below any treatments that has the letters above the columns, such as an ab and b, are not statistically different at a 95% level.

The relative yield data was able to confirm that across both locations an application of P in February significantly increased yields at a consistent level of 30-50%. It is interesting that while the NP+K+ treatment almost sorts out as being statistically the highest.
While I am not even close to suggesting that you should delay application of P fertilizer in wheat production, I am a big fan of in-furrow applications, this work does point to opportunities. Such as the ability to return to the field after the wheat is up and apply broadcast P if perhaps you could not at planting. But specifically, the potential for in-season Variable Rate phosphorus based upon crop response, maybe a P-Rich strip. What I can tell you this means is that I have more work to do. First, I need a better understand of when and where this is possible. Then it is time to figure out how to use this to our advantage to more efficiently use P fertilizer.
I do want to reiterate, I am not suggesting to move away from Preplant P nor in-furrow.
Keep an eye out for the soybean data because hopefully we catch a few good rains and find out if the timing of P&K will impact the double crop yields.
I want to send a big Thank you to all the cooperators who have put up with me and my time over years to get this data and the Oklahoma Soybean Board for their continued support of this project.
Feel free to send any questions for comments my way at b.arnall@okstate.edu
Banding P as a band-aid for soil acidity, not so cheap now.
I am bringing this topic back to the surface now with the current outlook on phosphorus fertilizer. If you have heard its not only really expensive (current quotes on 4.24.26 are at $0.87 + per lbs P2O5 ) but the supply is short and will likely stay short through summer into the fall. So this year’s wheat crop, we need to be prepared to be smart with Phosphorus, and applying an extra 30lbs to band aid for soil acidity should not be in the cards. Look at it this way, if the phosphorus was at $0.65 a lb that $19.5 that could be spent on a ton of lime. That lime will last 3-5 years, while that P needs to be added every year. Not only that, but the lime will help root growth (better when we dry up), produce significantly more biomass, and make the phosphorus you’ve applied in the past available again for plant uptake. So make the plans now to soil sample as soon as this crop is off, you can get a soil test recommendation and plan for the lime trucks.
Original Blog Posted in 2021
Whoi Cho, PhD student Ag Economics advised by Dr. Wade Brorsen
Raedan Sharry, PhD Student Soil Science advised by Dr. Brian Arnall
Brian Arnall, Precision Nutrient Management Extension.
In 2014 I wrote the blog Banding P as a Band-Aid for low-pH soils. Banding phosphate to alleviate soil acidity has been a long practiced approach in the southern Great Plains. The blog that follows is a summary of a recent publication that re-evaluated this practices economic viability.
Many Oklahoma wheat fields are impacted by soil acidity and the associated aluminum (Al) toxicity that comes with the low soil pH. The increased availability of the toxic AL3+ leads to reduced grain and forage yields by impacting the ability of the plant to reach important nutrients and moisture by inhibiting root growth. Aluminum can also tie up phosphorus in the soil, further intensifying the negative effects of soil acidity. More on the causes and implication of soil acidity can be found in factsheet PSS-2239 or here (https://extension.okstate.edu/fact-sheets/cause-and-effects-of-soil-acidity.html). The acidification of many of Oklahoma’s fields has left producers with important choices on how to best manage their fields to maximize profit.
Two specific management strategies are widely utilized in Oklahoma to counter the negative impacts of soil acidification: Lime application and banding phosphorus (P) fertilizer with seed. While banding P with seed ties up Al allowing the crop to grow, this effect is only temporary, and application will be required every year. The effects of liming are longer lasting and corrects soil acidity instead of just relieving Al toxicity. Historically banding P has been a popular alternative to liming largely due to the much lower initial cost of application. However, as P fertilizers continue to increase in cost the choice between banding P and liming needed to be reconsidered.
A recent study by Cho et al.,2020 compared the profitability of liming versus banding P in a continuous wheat system considering the impacts that lime cost, wheat price and yield goal has on the comparison. This work compared the net present value (NPV) of lime and banded P. The study considered yield goal level (40 and 60 bu/ac) as well as the price of P2O5 fertilizer and Ag Lime. The price of P2O5 used in this study was $0.43 lb-1 while lime price was dictated by distance from quarry, close to quarry being approximately $43 ton-1 and far being $81 ton-1. For all intents and purposes these lime values are equivalent to total lime cost including application. Wheat prices utilized in the study were $5.10 bu-1 and $7.91 bu-1. It is important to note that baseline yield level was not considered sustainable under banded P management in this analysis. This resulted in a decrease in yield of approximately 3.2 bu ac-1 per year. This is attributable to the expected continued decline in pH when banding P is the management technique of choice.
The analysis in this work showed that lime application is cost prohibitive in the short term (1 year) when compared with banding P regardless of lime cost, yield goal level, and wheat value (within the scope of this study). This same result can be seen over a two-year span when yield is at the lower level (40 bu ac-1). While in the short-term banding P was shown to be a viable alternative to liming, as producers are able to control ground longer lime application becomes the more appealing option, especially when producers can plan for more than 3 years of future production. In fact, under no set of circumstances did banding P provide greater economic return than liming regardless of crop value, yield, or liming cost when more than 3 years of production were considered and only under one scenario did banded P provide a higher NPV in a 3-year planning horizon.
While historically banding P was a profitable alternative to lime application for many wheat producers the situation has likely drastically changed. At the time of writing this blog (09/17/2021) Diammonium Phosphate (DAP) at the Two Rivers Cooperative was priced at $0.78 lb-1. of P2O5. This is a drastic increase in P cost over the last year or so since Cho et al. was published in 2020. With P fertilizer prices remaining high it will be important for producers to continue to consider the value of liming compared to banded P. This is particularly crucial for those producers who can make plans over a longer time frame, especially those more than 3 years.
Addendum: As fertilizer prices have continued to rise a quick analysis utilizing the $0.78 lb-1 of P2O5was completed to consider the higher P fertilizer cost. Under this analysis an estimated decrease in NPV of approximately $38 an acre for P banding occurred. When considering this change in NPV, lime application becomes the more profitable option for alleviation of soil acidity symptoms even in the short term (assuming lime price values are equivalent to the previous analysis). This underlines the fact that it is imperative to consider the impact on profitability of the liming vs. banding P decision in the current economic climate for agricultural inputs.
Link to the Open Access Peer Reviewed publication “Banding of phosphorus as an alternative to lime for wheat in acid soil” https://doi.org/10.1002/agg2.20071
DAP in short supply? Revisiting, DAP vs MAP, Source may matter!
From mid August through October, fertilizer applicators and grain drills are running across the southern great plains wheat ground. Di-ammonium Phosphate (DAP 18-46-0) is maybe the most popular form of phosphorous (P) utilized in wheat production today. DAP delivers a high content of nitrogen (N) while efficiently binding the toxic aluminum (Al) ions low pH soils. However due to the flooding that occurred throughout the spring the Ports have been closed and DAP could be in short supply. I have heard that many companies and Co-ops have already sourced Mono-ammonium phosphate (MAP 11-52-0) to supplement the lack of DAP for our early planted wheat crop. With this happening, I wanted to share some points about the two sources. In a broadcast incorporated scenario I do not have much preference for one over the other. It is when producers are applying the fertilizer in-furrow or applying to alleviate Al toxicity that source can matter. As described in the post below, in a soil with a neutral pH DAP and MAP perform equally well. So in this scenario I give MAP a slight edge over DAP if the price is the same. I say this as you can run less material per acre with MAP and refill a little less often. Many worry about the drop in N delivered with MAP versus DAP but in my work I see that is the P in the starter that gives us a good response and not the N, which can be delivered with pre-plant or top-dress. However, DAP wins out in soils with a pH below 5.5. The original blog below shows the results when DAP and MAP are banded in acidic soils using the same rate of P per acre. The reason we see this happen is that when MAP dissolves it forms a slightly acidic solution (approx 4.0) while DAP will dissolve to form a slightly basic solution (approx 7.5). In our work BOTH DAP and MAP increased yield above the check in acidic soils, which goes to show MAP is an affect tool for short term remediation of aluminium toxicity (Band P for Al toxicity Blog). However it might require more MAP per acre to reach the equivalent results. Because of what we saw when comparing the two sources at equivalent rates of P, I would recommend increasing the rate of P2O5 from 30 lbs per acre to 35 or 40. This would be going from 65 lbs of DAP to 67-77 lbs of MAP per acre.
So the take home would be as this wheat season takes off and you find that DAP is hard to locate and you A) Have overall neutral (5.5+) pH levels do not hesitate using MAP. Run the normal amount of material getting a few extra lbs of P or apply less material to get the same amount of phosphate. B) Have a acidic situation and are banding to alleviate aluminum toxicity use the same amount of material or a little bit more. Keep in mind in acidic soils with a low soil test P level you have to apply enough phosphate to take care of the Al and enough to take care of the P deficiency. Note the results of the NPKS wheat response strip (NPKS BLOG)
Original Post Published July 18, 2016
DAP vs MAP, Source may matter!
Historically the two primary sources of phosphorus have had different homes in Oklahoma. In general terms MAP (11-52-0) sales was focused in Panhandle and south west, while DAP (18-46-0) dominated the central plains. Now I see the availability of MAP is increasing in central Oklahoma. For many this is great, with MAP more P can be applied with less material. which can over all reduce the cost per acre. There is a significant amount of good research that documents that source of phosphorus seldom matters. However this said, there is a fairly large subset of the area that needs to watch what they buy and where they apply it.
If you are operating under optimum soil conditions the research shows time and time again source does not matter especially for a starter. In a recent study just completed by OSU multiple sources (dry, liquid, ortho, poly ect ect) of P were evaluated. Regardless of source there was no significant difference in yield. With the exception of the low pH site. The reason DAP was so predominate in central Ok, soil acidity. See an older blog on Banding P in acidic soils.

Figure 1. The cover of an extension brochure distributed in Oklahoma during the 1980s.
When DAP is applied, the soil solution pH surrounding the granule will be alkaline with a pH of 7.8-8.2. This is a two fold win on soil acidity aka aluminum (Al) toxicity. The increase in pH around the prill reduces Al content and extends the life of P, and as the pH comes back down the P ties up Al and allows the plant to keep going. However, the initial pH around the MAP granule ranges from an acid pH of 3.5-4.2. There is short term pH change in the opposite direction of DAP, however the the Al right around the prill becomes more available and in theory ties up P even faster.
Below is a table showing the yield, relative to untreated check, of in-furrow DAP and MAP treatments in winter wheat. The N401 location had a ph 6.1 while Perk (green) has a pH of 4.8. At Perkins in the low pH, both forms of P significantly increased yield, almost 20 bushel on the average. DAP however was 5 bushel per acre better than MAP. At the N40 site the yield difference between the two sources was 1 bushel.

Relative yield winter wheat grain yield MAP and DAP both applied at equal rates of P (32 lbs P2O5 ac) when compared to a untreated check.
In general it can be said that in acid soils DAP will out preform MAP while in calcareous high pH soils MAP can out preform DAP. So regarding the earlier statement about the traditional sales area of MAP or DAP if you look at the soil pH of samples went into the Oklahoma State University Soil, Water, and Forage Analytical lab the distribution makes since.
Average soil pH of samples sent into OSU soil water forage analytical lab by county.
In the end game price point and accessibility drives the system. In soils with adequate soil pH levels, from about 5.7 to around 7.0, get the source which is cheapest per lbs of nutrient delivered and easiest to work with. But if you are banding phosphorus in row with your wheat crop because you have soil acidity, DAP should be your primary source.
The challenge of collecting a representative soil sample
Guest Author, Dorivar Ruiz Diaz, Nutrient Management Specialist Kansas State University
At first glance, soil sampling would seem to be a relatively easy task. However, when you consider the variability that likely exists within a field because of inherent soil formation factors and past production practices, the collection of a representative soil sample becomes more of a challenge.
Before heading to the field to take the sample, be sure to have your objective clearly in mind. For instance, if all you want to learn is the average fertility level of a field to make a uniform maintenance application of P or K, then the sampling approach would be different than sampling for pH when establishing a new alfalfa seeding or sampling to develop a variable rate P application map.
In some cases, sampling procedures are predetermined and simply must be followed. For example, soil tests may be required for compliance with a nutrient management plan or environmental regulations associated with confined animal feeding operations. Sampling procedures for regulatory compliance are set by the regulatory agency and their sampling instructions must be followed exactly. Likewise, when collecting grid samples to use with a spatial statistics package for drawing nutrient maps, sampling procedures specific to that program should be followed.

Figure 1. The level of accuracy of the results of a soil test will depend, in part, on how many subsamples were taken to create the composite sample. In general, a composite sample should consist of 15 or more subsamples. For better accuracy, 20-30 cores, or subsamples, should be taken and combined into a representative sample. F
Regardless of the sampling objectives or requirements, some sampling practices should be followed:
- A soil sample should be a composite of many cores to minimize the effects of soil variability. Take a minimum of 12 to 15 cores from a relatively small area (two to four acres). Taking 20-30 cores will provide results that are more accurate. Take a greater number of cores on larger fields than smaller fields, but not necessarily in direct proportion to the greater acreage. A single core is not an acceptable sample.
- Use a consistent sampling depth for all cores because pH, organic matter, and nutrient levels often change with depth. Match sampling depth to sampling objectives. K-State recommendations call for a sampling depth of two feet for the mobile nutrients – nitrogen, sulfur, and chloride. A six-inch depth is suggested for routine tests of pH, organic matter, phosphorus (P), potassium (K), and zinc (Zn) (Figure 2).
- When sampling a specific area, a zigzag pattern across the field is better than following planting/tillage pattern to minimize any past non-uniform fertilizer application/tillage effects. With a GPS system available, recording of core locations is possible. This allows future samples to be taken from the same locations in the field.
- When sampling grid points for making variable rate nutrient application maps, collecting cores in a 5-10 foot radius around the center point of the grid is preferred for many spatial statistical software packages.
- Avoid unusual spots obvious by plant growth and/or visual soil color/texture differences. If information on these unusual areas is desired, collect a separate composite sample from these spots.
- If banded fertilizer has been used on the previous crop (such as strip tillage), then it is suggested that the number of cores taken should be increased to minimize the effect of an individual core on the composite sample results, and to obtain a better estimate of the average fertility for the field.
- For permanent sod or long-term no-till fields where nitrogen fertilizer has been broadcast on the surface, a three- or four-inch sampling depth would be advisable to monitor surface soil pH
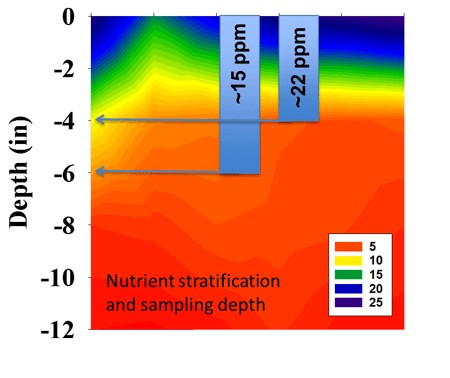
Figure 2. Consistency is sampling depth is particularly important for immobile nutrients like P. Stratification of nutrients and pH can be accentuated under reduced tillage.
Soil test results for organic matter, pH, and non-mobile nutrients (P, K, and Zn) change relatively slowly over time, making it possible to monitor changes if soil samples are collected from the same field following the same sampling procedures. However, there can be some seasonal variability and previous crop effects. Therefore, soil samples should be collected at the same time of year and after the same crop.
Soil test results for organic matter, pH, and non-mobile nutrients (P, K, and Zn) change relatively slowly over time, making it possible to monitor changes if soil samples are collected from the same field following the same sampling procedures. However, there can be some seasonal variability and previous crop effects. Therefore, soil samples should be collected at the same time of year and after the same crop.
Soil testing should be the first step for a good nutrient management program, but it all starts with the proper sample collection procedure. After harvest in the fall is good time for soil sampling for most limiting nutrients in Kansas.
For instructions on submitting soil samples to the K-State Soil Testing Lab, please see the accompanying article “Fall soil sampling: Sample collection and submission to K-State Soil Testing Lab” found in this eUpdate issue.
For any questions Contact.
Dorivar Ruiz Diaz, Nutrient Management Specialist
ruizdiaz@ksu.edu
Poly versus Ortho another year of data from Iowa
Guest Author, Dr. Jake Vossenkemper; OkState Grad and Agronomy Lead, Liquid Grow Fertilizer
Updated Research Comparing Ortho/Poly-Phosphate Ratios for In-Furrow Seed Safe Starter Fertilizers. Last years post Link
Article Summary
- Ortho-phosphates are 100% plant available, but a high percentage of poly-phosphates in starter fertilizers convert to ortho-phosphate within just two days of application.
- This quick conversion from poly- to ortho-phosphate suggests expensive “high” ortho starter fertilizers are not likely to result in increased corn yields compared to seed-safe fluid starters containing a higher percentage of poly-phosphate.
- On-farm field studies conducted near Traer, IA in the 2016 and 2017 growing season found no statistical difference (Pr > 0.05) in corn yield between conventional and high ortho-phosphate starters in either year.
- High ortho starters cost more per acer than 50/50 ortho:poly starters, but do not increase corn grain yields.
Polyphosphates Rapidly Convert to Plant available Orthophosphates
Given polyphosphates are not immediately plant available and orthophosphates are immediately plant available, this gives the promoters of “high” orthophosphate starters ample opportunity to muddy the waters. Nevertheless, the facts are, polyphosphates are rather rapidly hydrolyzed (converted to) into orthophosphates once applied to soils, and this hydrolysis process generally takes just 48 hours or so to complete.
In September of 2015, we posted a blog discussing some of the more technical reasons why the ratio of ortho to polyphosphates in starter fertilizers should have no impact on corn yields. For those that are interested in the more technical details, we encourage you to follow this link to the September 2015 blog post.
While we was relatively certain that the ratio of ortho to polyphosphates in liquid starters should have no effect on corn yields, we decided to “test” this idea with on-farm field trials located near Traer, IA in the 2016 and 2017 growing seasons.
How the Field Trial Was Conducted
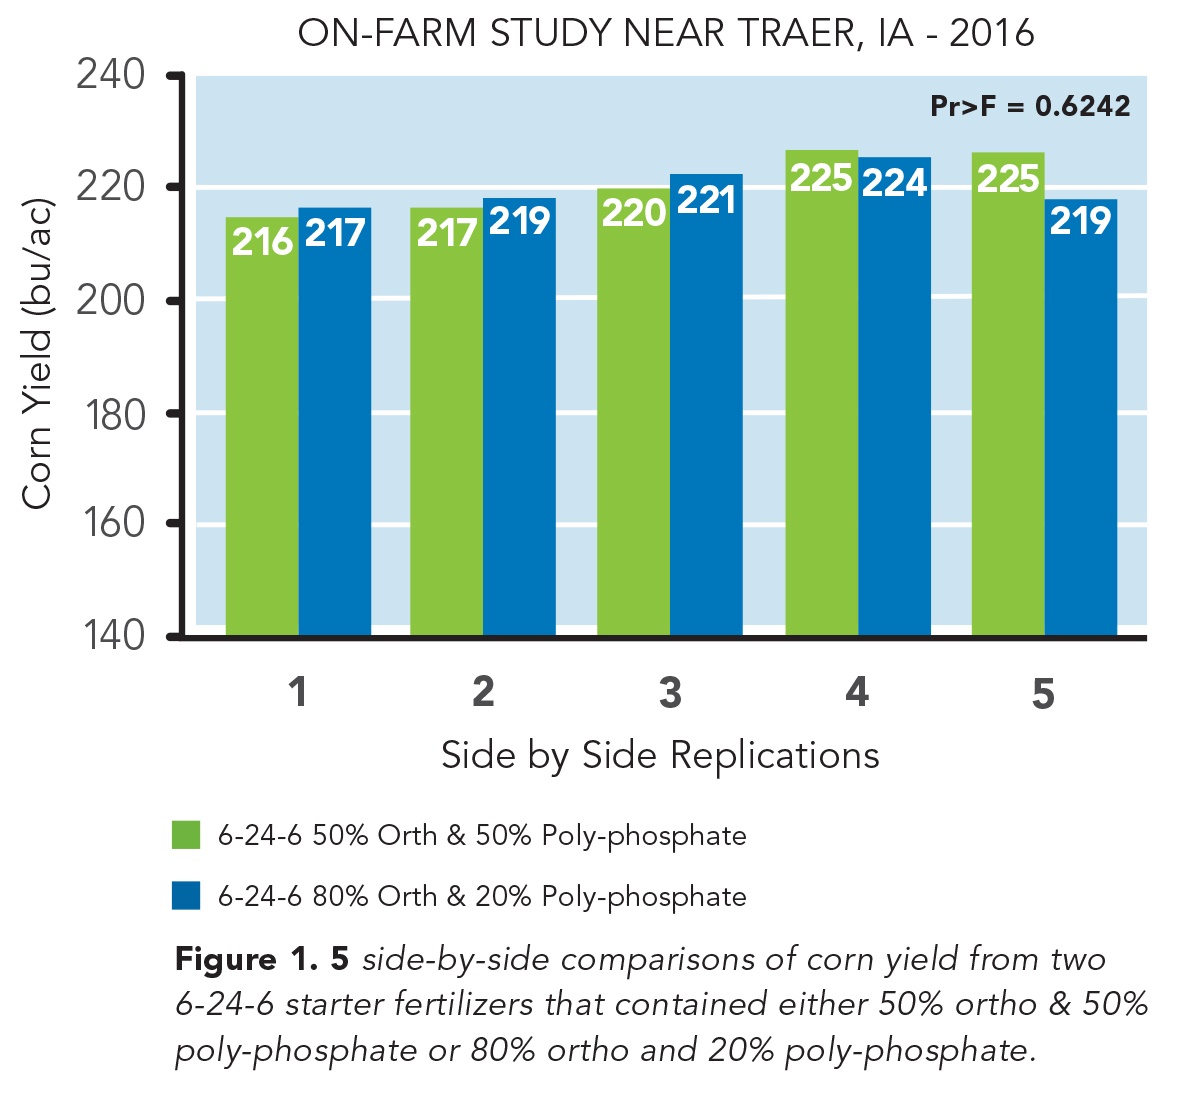
In these field trials, we used two starters applied in-furrow at 6 gal/ac. Each starter had an NPK nutrient analysis of 6-24-6. The only difference between these two starters was the ratio of ortho to polyphosphates. One of these starters contained 80% orthophosphate and the other contained just 50% orthophosphate. With the remainder of the phosphorus source in each of these two starters being polyphosphate. Each plot was planted with a 24-row planter (Picture 1) and was nearly 2400 ft long. In both the 2016 and 2017 growing seasons the experimental design used was a randomized complete block with 4 or 5 replications.

Field Trial Results
Averaged over the side-by-side replications there was less than 1 bu/ac difference in corn grain yield between the high ortho and low ortho polyphosphate starters in both the 2016 and 2017 growing seasons. In addition to finding no differences in grain yield between these two starters, the high ortho starters generally cost about $1 more per/gal (so the $6/ac difference in price at a 6 gal/ac rate) than the low ortho starters. So the more expensive high ortho starter clearly did not “pay” its way in our multi-year field trials.
More Trials Planned for 2018
While our findings agree with other research-comparing ortho and polyphosphate starter fertilizers (Frazen and Gerwing. 1997), we want to be absolutely certain that our fertilizer offerings are the most economically viable products on the market. Therefore, we have decided to run this same field trial at one location in northern, IL in 2018, and at one location in central, IA in 2018. Stay tuned for those research results next fall.
References
Franzen D. and J. Gerwing. 2007. Effectiveness of using low rates of plant nutrients. North Central regional research publication No. 341. http://www.extension.umn.edu/agriculture/nutrient-management/fertilizer-management/docs/Feb-97-1.pdf (accessed 8 of Sept 2015).
A big Thank You to Dr. Vossenkemper for sharing this article with us.
The original article and his contact can be found at Link
Using a Grain Drill Grain Box for Fertilizer, Results and a Calibration guide.
For the last few years I have been challenging people to “Think Out Side the Box” when applying fertilizer. One of these application methods is to use a grain drill to put Nitrogen fertilizer into the soil. Just the act of getting N into the soil will immediately decrease the opportunity for losses. While it seems crazy many picked up on the idea of using grain drills for N applicators. The first year of a two-year study looking at documenting the practice is in the books. With data coming in from three locations, utilizing two drill types (double disk conventional and single disk no-till), the results are quite promising. The biggest take home from year one was a 2 parter: 1) if conditions are conducive to nitrogen loss from urea volatilization, applying urea with a grain drill in the spring improved efficiency. Conversely if loss potential was low, there was no difference. 2) in some soil conditions the double disk drill could not close the furrow and this reduced the positive impact of using the drill. The two tables below show the impact application and environment on yield. Each of the treatments had 60 lbs of nitrogen (as Urea) applied per acre. At Chickasha the first application was made while it was fairly dry and then it rained, but the second application was made during a period in which there was no rain but a fairly significant dew each morning. This can be seen as the small effect volatilization played on the yields of the first application timing. At Lahoma, it was the early applications that had a higher risk of loss with no difference seen later.

Partial year one results from the topdress N with a grain drill at Chickasha OK. Timing 1 was late January and timing 2 was late February.

Partial year one results from the topdress N with a grain drill at Lahoma Ok. Timing 1 was early January and timing 2 was mid February, and timing 3 was early March.
With the results from the first year of the top-dressed drilled nitrogen studies in the books, the interest has been increasing. One question keeps popping up: for grain drills without a fertilizer box, what do we put our grain box on to apply fertilizer. At one point the number of inquires hit a critical mass and I sent out my crew to find grain drills and create calibration curves for DAP (18-46-0) and Urea (46-0-0). The crew did just that.
Now please consider what is presented below is a general calibration. Much like the chart on your grain drills, it will hopefully get you close but the best-case scenario is that each drill is calibrate prior to running. As request are made we will try to add more drills to this list.
To create the following charts the guys located several different makes of drills around the OSU experiment stations. They were instructed to choose setting based on the manufacture seed rate charts in the range of 60, 90, 120 etc. For each setting they caught a couple of row units for both Urea (46-0-0) and DAP (18-46-0). They caught each setting multiple times to get a good average.
If you look at the tables you can see the Landol 5211, Great Plains 1006NT, and International 5100 are fairly similar, with the John Deere 1560 being a little lower and the John Deere 450 significantly lower at the lower rates. To use the tables below, consider what kind of grain drill you have and choose to follow one of the drills listed or the average of all five. If you use the average value I would expect most to find they applied a bit more than planned. To make it even simpler, but less accurate, you can use the % wheat value. To do this for DAP take your target rate and divide by .88, this value is what you want to set your drill to. For example for a target rate of 100 lbs DAP per acre use the following formula: 100/.88 = 114. Choose the manufacturer recommended settings 114 lbs wheat seed per acre. If you are wanting to apply Urea take your target rate of urea and divide by 0.71.
DAP 18-46-0
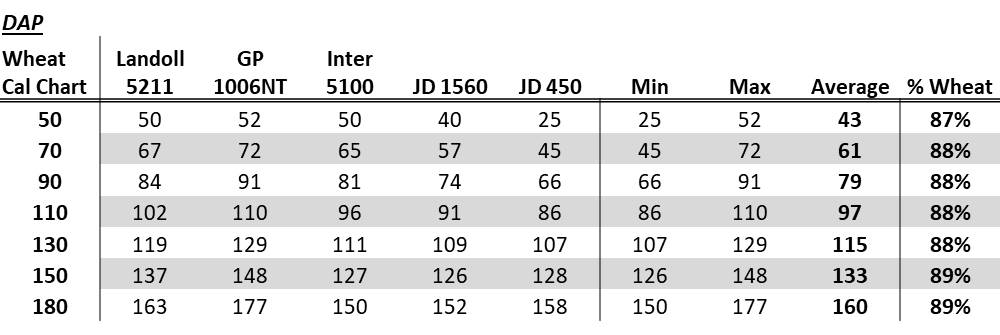
Table showing the manufacturer wheat rate setting and the resulting amount of DAP 18-46-0.

Graph documenting the manufacturer wheat rate setting and the resulting amount of DAP 18-46-0.
UREA 46-0-0

Table documenting the manufacturer wheat rate setting and the resulting amount of Urea 46-0-0.

Graph documenting the manufacturer wheat rate setting and the resulting amount of Urea 46-0-0.
Again, I cannot state this enough, this is a general guide, each drill even of the same manufacture and model will likely be different. The only way to be certain of the rate applied is to calibrate each drill individually.
Questions or comments please email me at b.arnall@okstate.edu or call 405.744.1722
Comparing Ortho/Poly-Phosphate Ratios for In-Furrow Seed Safe Starter Fertilizer
Guest Author, Dr. Jake Vossenkemper; Agronomy Lead, Liquid Grow Fertilizer
New Research Comparing Ortho/Poly-Phosphate Ratios for In-Furrow Seed Safe Starter Fertilizers
Article Summary
- Ortho-phosphates are 100% plant available, but a high percentage of poly-phosphates in starter fertilizers convert to ortho-phosphate within just two days of application.
- This quick conversion from poly- to ortho-phosphate suggests expensive “high” ortho starter fertilizers are not likely to result in increased corn yields compared to seed-safe fluid starters containing a higher percentage of poly-phosphate.
- A field study conducted near Traer, IA in the 2016 growing season found less than 1 bu/ac yield difference between a 50/50 ortho:poly starter and high ortho-phosphate starter.
- High ortho starters cost more per acer than 50/50 ortho:poly starters, but do not increase corn grain yields.
Poly-phosphates Rapidly Convert to Plant available Ortho-Phosphates
Given poly-phosphates are not immediately plant available and ortho-phosphates are immediately plant available, this gives the promoters of “high” ortho-phosphate starters ample opportunity to muddy the waters. Nevertheless, the facts are that poly-phosphates are rather rapidly hydrolyzed (converted to) into ortho-phosphates once applied to soils, and this hydrolysis process generally takes just 48 hours or so to complete.
In Sept. of 2015, I posted a blog discussing some of the more technical reasons why the ratio of ortho- to poly-phosphates in starter fertilizers should have no impact on corn yields. For those that are interested in those more technical details, I encourage you to follow this link to the Sept. 2015 blog post: https://www.liqui-grow.com/farm-journal/.
While I was relatively certain that the ratio of ortho- to poly-phosphates in liquid starters should have no effect on corn yields, I decide to “test” this idea with a field trial in the 2016 growing season conducted near Traer, IA.
How the Field Trial Was Conducted
In this field trial, we used two starter products applied in-furrow at 6 gal/ac. Each starter had an NPK nutrient analysis of 6-24-6. The only difference between these two starters was the ratio of ortho- to poly-phosphate. One of these starters contained 80% ortho-phosphate and the other contained just 50% ortho-phosphate with the remainder of the phosphorous source in each of these two starters being poly-phosphate. Each plot was planted with a 24-row planter (Picture 1) and plot lengths were nearly 2400 ft. long. In total, there were 5 side-by-side comparisons of the two starter fertilizers that contained different ratios of ortho- to poly-phosphates.
Field Trial Results
In general, there were no large differences in yield between the two starters in any of the 5 side-by-side comparisons, except for comparison number 5 (Figure 1). In comparison number 5, the 50% ortho/50% poly-phosphate starter actually yielded 6 bu/ac more than the high ortho starter. But averaged over the 5 side-by-side comparisons, there was less than 1 bu/ac yield difference between the high and low ortho starters (P=0.6712).
In addition to finding no differences in grain yield between these two starters, the high ortho starters generally cost about $1 more per gallon (so $6/ac at a 6 gal/ac rate) than the low ortho starters. So the more expensive high ortho starter clearly did not “pay” its way in our 2016 field trial.
More Trials Planned for 2017
While our findings agree with other research-comparing ortho- and poly-phosphate starter fertilizers (Frazen and Gerwing. 1997), we want to be absolutely certain that our fertilizer offerings are the most economically viable products on the market. Therefore, I have decided to run this same field trial at one location in northern Illinois in 2017, and at one location in central Iowa in 2017. Stay tuned for those research results this fall.

Picture 1
Planting starter fertilizer trials near Traer, IA in the growing season of 2016.
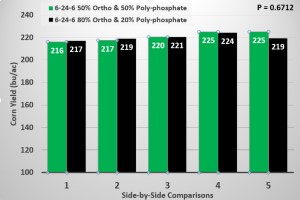
5 side-by-side comparisons of corn yield from two 6-24-6 starter fertilizers that contained either 50% ortho & 50% poly-phosphate or 80% ortho and 20% poly-phosphate. The field trial was conducted near Traer, IA in the growing season of 2016.
References
Franzen D. and J. Gerwing. 2007. Effectiveness of using low rates of plant nutrients. North Central regional research publication No. 341. http://www.extension.umn.edu/agriculture/nutrient-management/fertilizer-management/docs/Feb-97-1.pdf (accessed 8 of Sept 2015).
