Home » Starter Fertilizer
Category Archives: Starter Fertilizer

Banding P for Acidic Soils: Its not the time to be paying for poor practice.
I am bringing this topic back to the surface now with the current outlook on phosphorus fertilizer. If you have heard its not only becoming more expensive but the supply is short and will likely stay short through summer into the fall, which wont help prices. So this year’s wheat crop, we need to be prepared to be smart with Phosphorus, and applying an extra 30lbs to band aid for soil acidity should not be in the cards. Look at it this way, if the phosphorus was at $0.66 a lb that $20 that could be spent on a ton of lime. That lime will last 3-5 years, while that P needs to be added every year. Not only that, but the lime will help root growth (better when we dry up), produce significantly more biomass, and make the phosphorus you’ve applied in the past available again for plant uptake. So make the plans now to soil sample as soon as this crop is off, you can get a soil test recommendation and plan for the lime trucks. This is also not the year to just apply phosphorus for the sake of applying. Soil tests are inexpensive relative to buying excess fertilizer.
Current quotes on 4.24.26 are at $0.54 + per lbs P2O5 with DAP at $830 a ton.
Quick Fertilizer Price Calculation:
Urea at $860 a ton means N is $0.93 a lbs.
DAP at $830 has $334 worth of $0.93 nitrogen and $495 of phosphorus at $0.54 a lb.
Banding P as a band-aid for soil acidity, not so cheap now.
Original Blog Posted in 2021
Whoi Cho, PhD student Ag Economics advised by Dr. Wade Brorsen
Raedan Sharry, PhD Student Soil Science advised by Dr. Brian Arnall
Brian Arnall, Precision Nutrient Management Extension.
In 2014 I wrote the blog Banding P as a Band-Aid for low-pH soils. Banding phosphate to alleviate soil acidity has been a long practiced approach in the southern Great Plains. The blog that follows is a summary of a recent publication that re-evaluated this practices economic viability.
Many Oklahoma wheat fields are impacted by soil acidity and the associated aluminum (Al) toxicity that comes with the low soil pH. The increased availability of the toxic AL3+ leads to reduced grain and forage yields by impacting the ability of the plant to reach important nutrients and moisture by inhibiting root growth. Aluminum can also tie up phosphorus in the soil, further intensifying the negative effects of soil acidity. More on the causes and implication of soil acidity can be found in factsheet PSS-2239 or here (https://extension.okstate.edu/fact-sheets/cause-and-effects-of-soil-acidity.html). The acidification of many of Oklahoma’s fields has left producers with important choices on how to best manage their fields to maximize profit.

Two specific management strategies are widely utilized in Oklahoma to counter the negative impacts of soil acidification: Lime application and banding phosphorus (P) fertilizer with seed. While banding P with seed ties up Al allowing the crop to grow, this effect is only temporary, and application will be required every year. The effects of liming are longer lasting and corrects soil acidity instead of just relieving Al toxicity. Historically banding P has been a popular alternative to liming largely due to the much lower initial cost of application. However, as P fertilizers continue to increase in cost the choice between banding P and liming needed to be reconsidered.
A recent study by Cho et al.,2020 compared the profitability of liming versus banding P in a continuous wheat system considering the impacts that lime cost, wheat price and yield goal has on the comparison. This work compared the net present value (NPV) of lime and banded P. The study considered yield goal level (40 and 60 bu/ac) as well as the price of P2O5 fertilizer and Ag Lime. The price of P2O5 used in this study was $0.43 lb-1 while lime price was dictated by distance from quarry, close to quarry being approximately $43 ton-1 and far being $81 ton-1. For all intents and purposes these lime values are equivalent to total lime cost including application. Wheat prices utilized in the study were $5.10 bu-1 and $7.91 bu-1. It is important to note that baseline yield level was not considered sustainable under banded P management in this analysis. This resulted in a decrease in yield of approximately 3.2 bu ac-1 per year. This is attributable to the expected continued decline in pH when banding P is the management technique of choice.
The analysis in this work showed that lime application is cost prohibitive in the short term (1 year) when compared with banding P regardless of lime cost, yield goal level, and wheat value (within the scope of this study). This same result can be seen over a two-year span when yield is at the lower level (40 bu ac-1). While in the short-term banding P was shown to be a viable alternative to liming, as producers are able to control ground longer lime application becomes the more appealing option, especially when producers can plan for more than 3 years of future production. In fact, under no set of circumstances did banding P provide greater economic return than liming regardless of crop value, yield, or liming cost when more than 3 years of production were considered and only under one scenario did banded P provide a higher NPV in a 3-year planning horizon.
While historically banding P was a profitable alternative to lime application for many wheat producers the situation has likely drastically changed. At the time of writing this blog (09/17/2021) Diammonium Phosphate (DAP) at the Two Rivers Cooperative was priced at $0.78 lb-1. of P2O5. This is a drastic increase in P cost over the last year or so since Cho et al. was published in 2020. With P fertilizer prices remaining high it will be important for producers to continue to consider the value of liming compared to banded P. This is particularly crucial for those producers who can make plans over a longer time frame, especially those more than 3 years.
Addendum: As fertilizer prices have continued to rise a quick analysis utilizing the $0.78 lb-1 of P2O5was completed to consider the higher P fertilizer cost. Under this analysis an estimated decrease in NPV of approximately $38 an acre for P banding occurred. When considering this change in NPV, lime application becomes the more profitable option for alleviation of soil acidity symptoms even in the short term (assuming lime price values are equivalent to the previous analysis). This underlines the fact that it is imperative to consider the impact on profitability of the liming vs. banding P decision in the current economic climate for agricultural inputs.
Link to the Open Access Peer Reviewed publication “Banding of phosphorus as an alternative to lime for wheat in acid soil” https://doi.org/10.1002/agg2.20071
In-Furrow Placement of Urea Products with Wheat Seed
Its that time of year I always get the question of “How much urea can I put in the furrow?”. My answer is always two fold first, I wouldn’t recommend it, its a risky venture. Even though I know some do it. Second, my research shows very little is any value from N in furrow. I like P but N just doesn’t show me any return. So for me the process is high risk, with little or no potential for return. But with blog I turn to our purple friend up north to share what their research has sown.
Brian
Guest Authors Kansas State University
Lucas Haag, Agronomist-in-Charge, Southwest Research-Extension Center, Tribune lhaag@ksu.edu
Alan Schlegel, retired
Dorivar Ruiz Diaz, Nutrient Management Specialist ruizdiaz@ksu.edu
To save time and cost, some wheat producers may be thinking about adding a little extra nitrogen (N) as urea or UAN to their phosphorus fertilizer through the drill with the seed. This would either be in addition to, or instead of, any preplant N applications.
While a minimum preplant N application of 20 to 40 lbs N per acre is often desirable, especially in no till production systems, there are risk involved when placing urea containing fertilizers in direct seed contact. Traditionally, we have suggested that no urea or UAN solution be placed in contact with the seed. With the continued adoption of air-seeders a common question we receive from producers is can urea, or enhanced urea products be placed in-furrow.
Methods of early-season nitrogen applications
If the starter fertilizer can’t be “spiked” with urea to add extra N, how can the necessary 20 to 40 pounds of N be applied? Subsurface banding (knifing) of N as either anhydrous ammonia, liquid UAN, or dry product will result in the greatest N use efficiency by the wheat crop. This is especially true for no-till wheat production.
If knifed N applications are not used, the next best application method would be surface banding (dribbling) of UAN solution in streams on 15- to 18-inch centers. Broadcasting urea, ammonium nitrate, or UAN applications are not generally as efficient as subsurface banding, but they are often the best choice due to equipment, logistics, or weed management considerations. Broadcast applications of N will have the most consistent performance if followed by light incorporation, precipitation, or irrigation.
Direct seed placement of nitrogen
When placing starter fertilizer in direct contact with wheat seed, producers should use the following guidelines:

The problem with placing urea-containing fertilizer with the seed is that urea is initially converted to ammonia and may be toxic to plant roots if the wheat seed is placed in direct contact with the fertilizer. Producers may hear of someone who has placed urea in direct seed contact and seemed to have no problems, but there are also many cases where urea-containing N fertilizers has injured the developing seedling and reduced or delayed emergence significantly. The risk of injury is greater in drier soils, at higher soil pH levels, and at higher N rates. High soil pH favors a higher concentration of ammonia as compared to ammonium as urea hydrolyzes. There is significant risk associated with placing urea-containing fertilizers in direct seed contact.
The chart below shows how soil texture affected the level of wheat germination when urea-N was applied with the seed in a K-State greenhouse study. The wheat was well watered in this study, but urea-N placed with the seed still reduced germination, especially in the sandy soil. The readings shown below were taken after 10 days. With the high rates of urea used in this study, it is possible that more damage to the seedlings would occur with time as the urea continues to hydrolyze into ammonia.

Field studies have also shown reduced wheat stands due to in-furrow placement of urea. Across 5 site years in western Kansas the placement of urea in-furrow has resulted in decreased stands at spring greenup compared to the control (Figure 2).

The stand reduction becomes especially noticeable at higher rate of N. One of the challenges of understanding the risk of seedling injury is that the magnitude of injury varies by field conditions an years. In some years very little reduction may be evident, even at higher rates of N, while in other years, stand reductions (and their associated impact on yield) is very evident. As an example at Tribune in 2017, reduction in stand caused by urea placement with seed, and their effect on yield were quite evident (Figures 3 and 4).

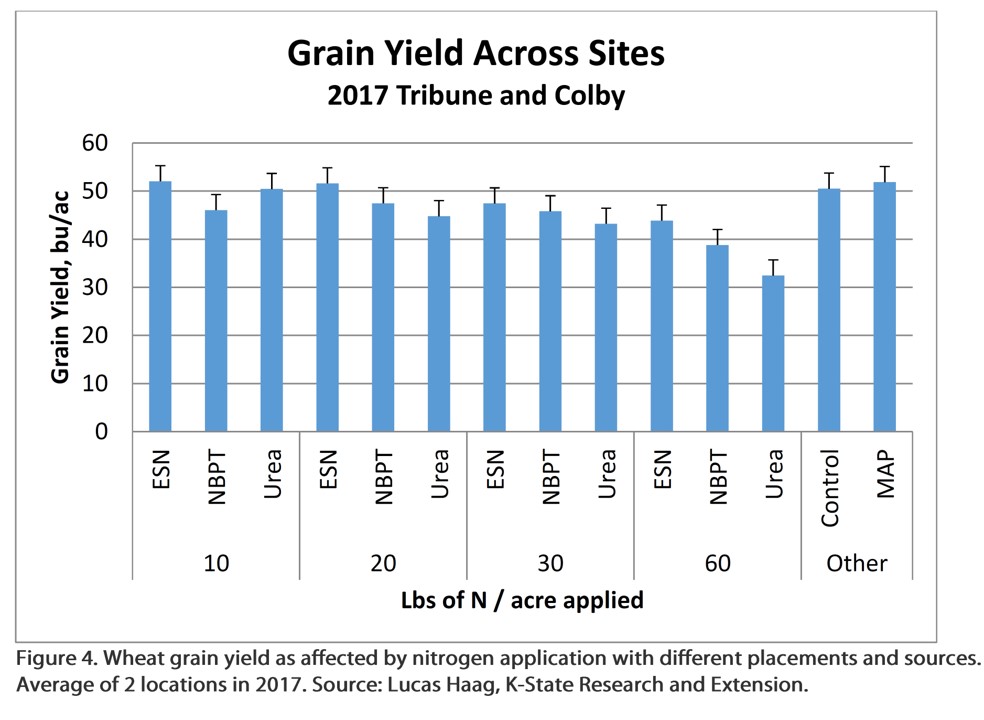
Stands were reduced 32 and 63% compared to the control when 30 and 60 lbs of N as urea were applied in-furrow (Figure 3). This resuled in yield reductions of 14 and 40%, respectively (Figure 4).
If you’d like to apply extra N directly in the seed furrow, one option is to use a controlled-release form of N, such as ESN. As shown in figure 4, at N application rates of 30 lbs/ac and less, where ESN-N was applied in-furrow, wheat yields were essentially the same as where the N was applied pre-plant, and higher compared to the same amount of N applied as urea. At the highest rate of application in the study, 60 lbs/ac, even ESN resulted in stand and grain yield reductions.
Also, air seeders that place the starter fertilizer and seed in a band an inch or two wide, or side band the fertilizer relative to the seed, provide some margin of safety because the concentration of the fertilizer and seed is lower in these diffuse bands. In this scenario, adding a little extra urea containing N fertilizers to the starter less likely to injure the seed – but it is still a risk.
Here is a great video by Dr. Haag.

Did in-furrow starter products increase yields?
Bronc Finch, Precision Nutrient Management Post-Doctorial Scientist.
Brian Arnall, Precision Nutrient Management Specialist.
As winter wheat planting time approaches this question arises often when fertilizer decisions are being made. There are several products that have been marketed to wheat producers that contain combinations of nitrogen (N), phosphorus (P), and potassium (K) as well as some plant essential micro-nutrients. These products are designed to be placed with the seed as an in-furrow application at planting and provide nutrients earlier in the season than traditional dry spreading methods. While the state of Oklahoma macro-nutrient deficiencies are often corrected with traditional fertilizing methods and micro-nutrient deficiencies are not commonly witnessed in winter wheat; these products are often sold with the expectation yield increases can still occur. This has led to the question can these fertilizer products improve winter wheat yield production regardless of soil analysis results? To answer this Oklahoma State University developed a study evaluating eleven different starter fertilizer options available to producers (Table 1). Of these eleven fertilizer options three are commonly available fertilizers, and eight of them are products available through specific companies. The study was carried out at three locations a year for two years.

To compare the ability of these products to increase yield beyond the recommendation of soil test results, pre-plant soil samples were collected to a 6-inch depth at each of these research sites. Soil analysis of the five-site years used in this evaluation (Table 2) reported no deficiency at the Lake Carl Blackwell research farm. Deficient concentrations of P (< 32.5 ppm) was recorded at the North 40 research site and Perkins research station, along with a low pH (4.8) at the Perkins research station. Acidic soils are of concern for crop production having many detrimental impacts to root production, however there is also influence on nutrient availability. Aluminum concentrations are often higher in low pH soils which will result in root pruning and the binding of applied P, increasing the concerns when soil analysis P concentrations are already deficient.

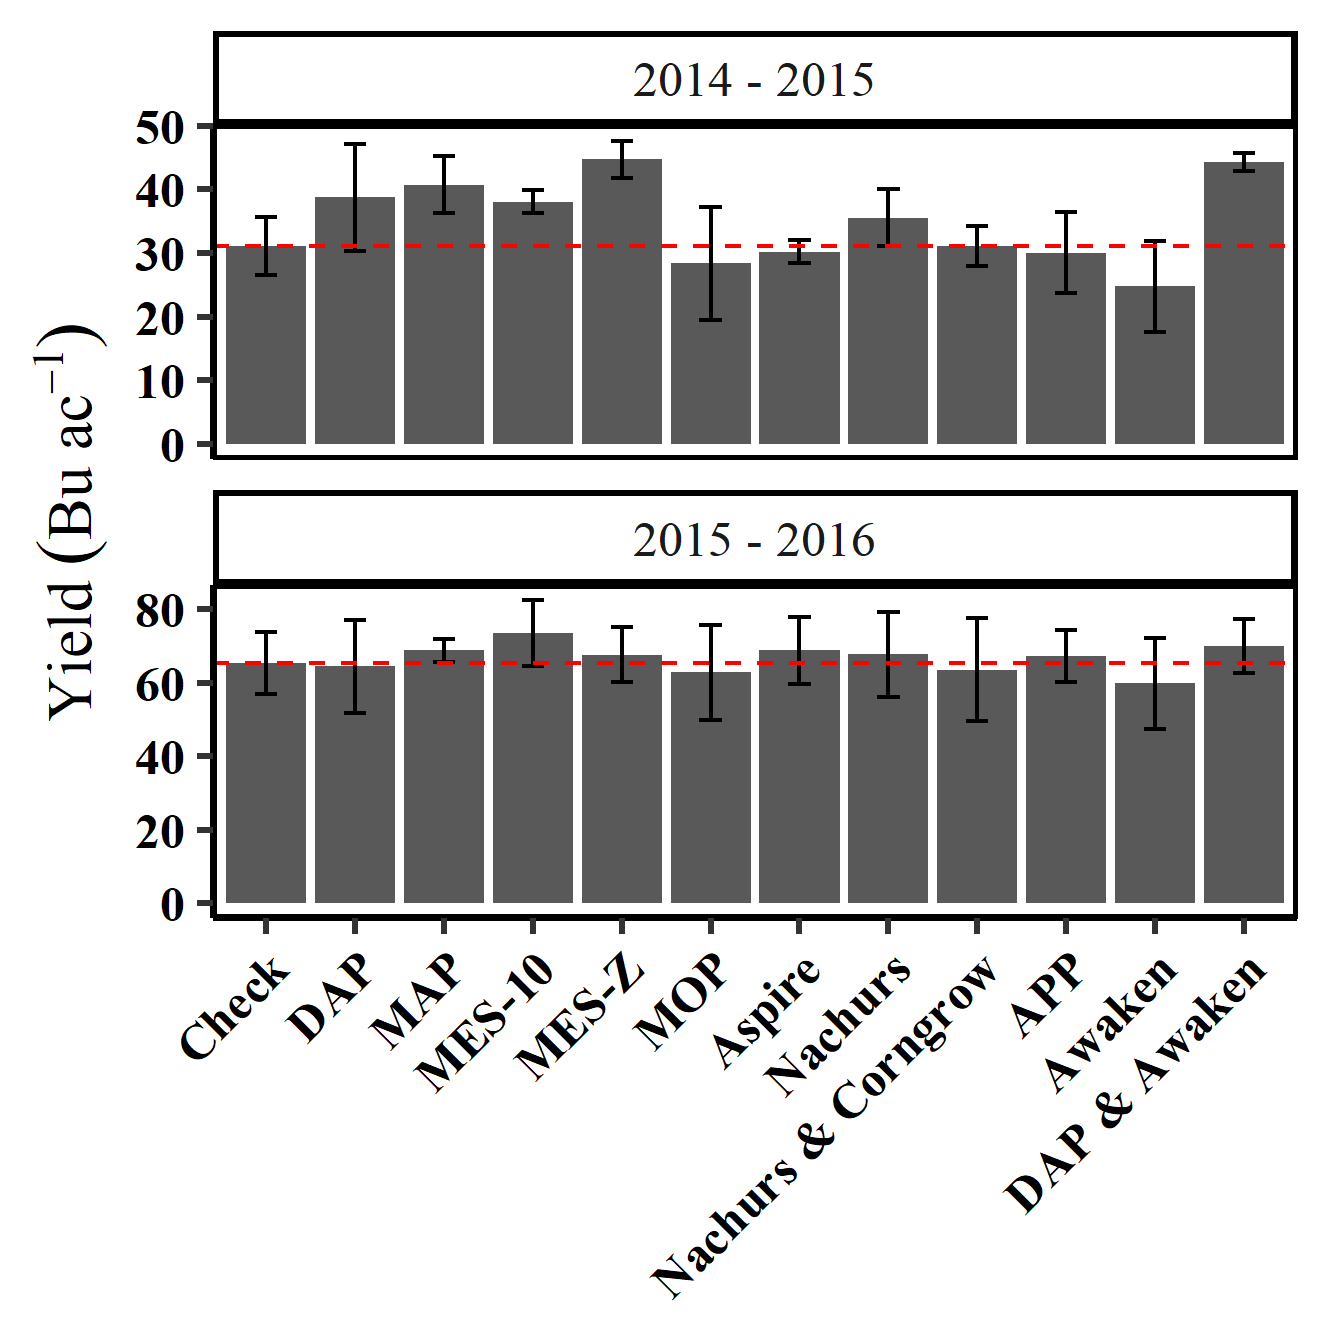
Evaluation of these commercially available products at non-nutrient deficient sites show no influence of any in-furrow placed fertilizer product on winter wheat grain yield compared to an unfertilized check, yielding an average of 52 bu ac-1 in 2014-2015, and 93 bu ac-1 in 2015-2016 (Figure 1). Figure 1, along with the following figures, show the mean and variability of winter wheat grain yield of each of the commercially available starter fertilizer product treatments, as well as the check treatment which received no fertilizer application. The column for each treatment represents the grain yield in bu ac-1 which is the average of three replications the variability of grain yield at an individual treatment can be observed by the error bars which depict the range of grain yields within a specific treatment. The larger the error bar the less consistent the yield and the harder it is to separate out statistical differences in yield.

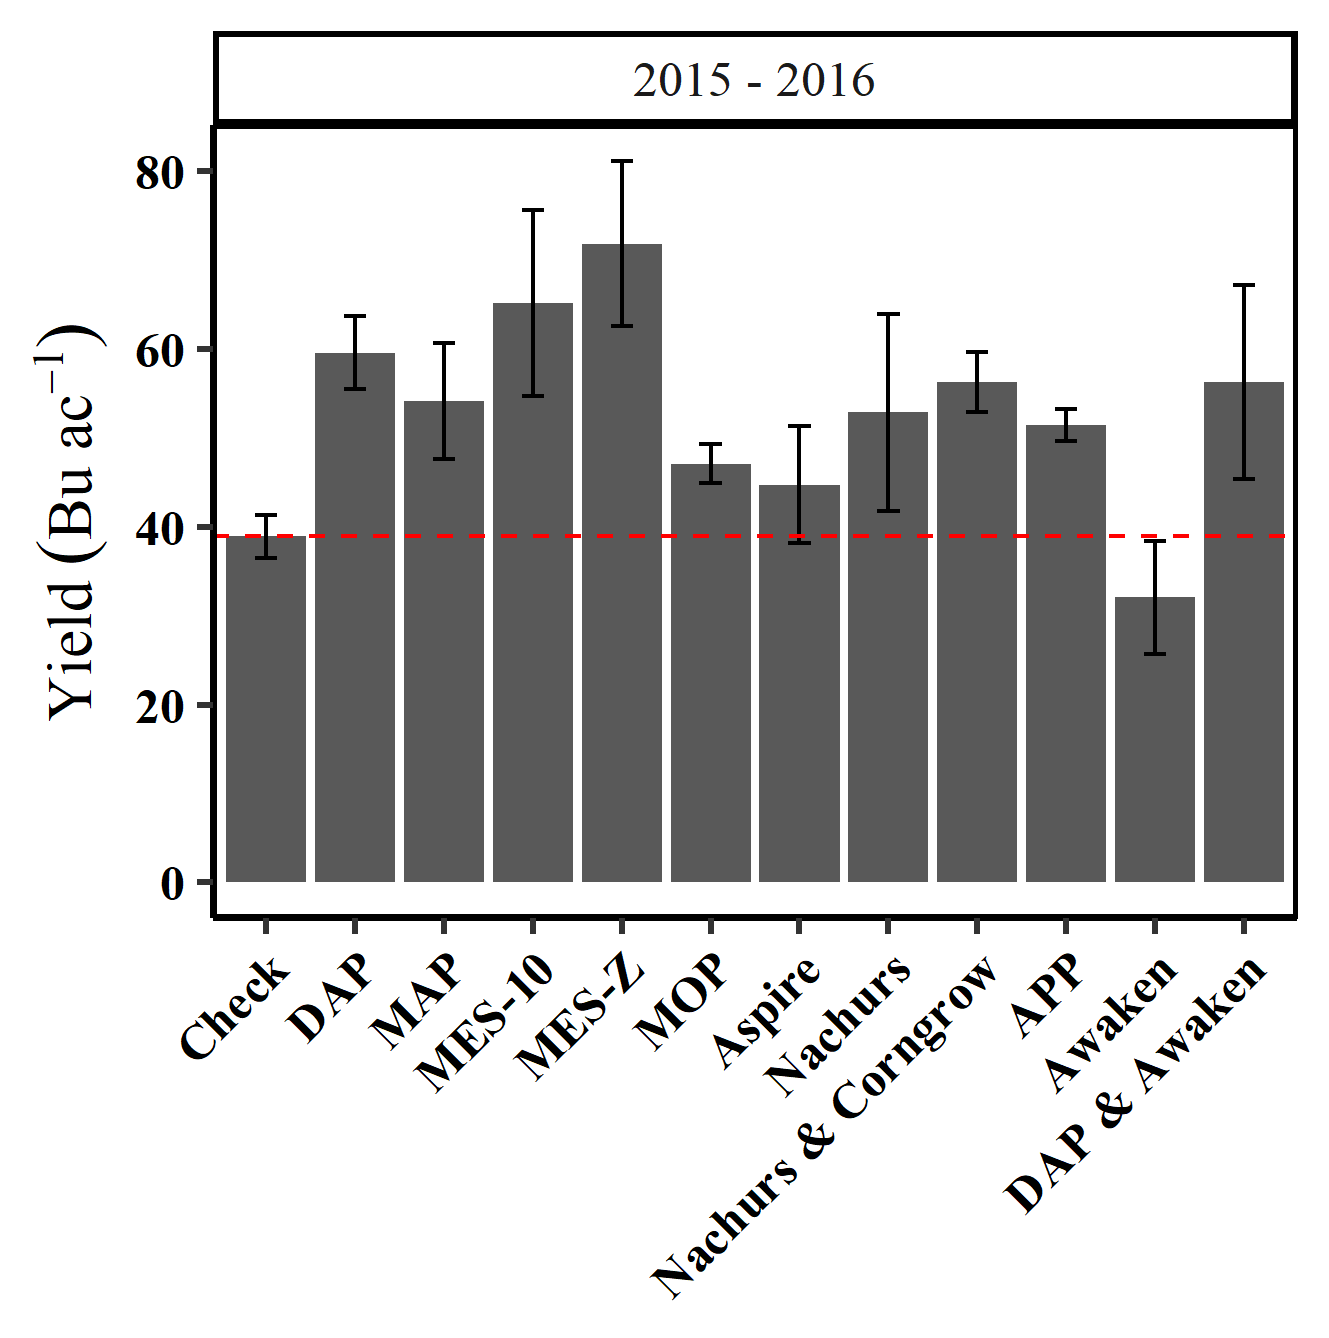
When the soil test P level was below 32.5 ppm, some P containing starter fertilizers where able to increase winter wheat grain yield in 2014-2015 growing season at North 40. Products containing 40 – 52% P; MAP, DAP + Awaken and MES-Z, improved grain yield by up to 14 bu ac-1 compared to the check. At the North 40 locations APP did not show the same increase in yields as DAP and MAP. The addition of micro-nutrients by Awaken combined with DAP yielded a 20 bu ac-1 increase over Awaken used alone, but no increase compared to DAP or MAP used alone. Similarly, the addition of Zinc by MES-Z yielded similar to the base product, MAP.
When P deficiency was compounded by a low pH such as observed at Perkins there was response to more in-furrow products. Compared to the check, increases up to 32 bu ac-1 in winter wheat grain yield was found by DAP, MES-10, MES-Z, Nachurs + CornGrow, and DAP + Awaken. Further investigation revealed the source of P fertilizer (DAP, MAP, and APP) reported no difference in yield averaging 55 bu ac-1. The addition of S and K by Nachurs was not different from APP, which is a similar liquid fertilizer, averaging 52 bu ac-1. Micro-nutrient additions by Awaken combined with DAP (56 bu ac-1), and by CornGrow combined with Nachurs (56 bu ac-1) did not increase winter wheat grain yield compared to each other or their respective base products of DAP (59 bu ac-1) and Nachurs (53 bu ac-1). Similarly, additions of S by MES-10 and S and Zn by MES-Z yielded similar to one another with 65 and 72 bu ac-1respectively but produced 14 bu ac-1 more yield on average than the base product MAP. At Perkins, which is a well-drained sandy loam soil, we often see a yield response to S when yield levels so seeing a response to the products that added 7 lbs of S, was not un-expected.
With these results in mind and the current cost of fertilizers, the addition of fertilizer products on non-limiting soils is not expected to result in an increase in winter wheat grain yield. Also, many of these products contain micro-nutrients that are rarely found to be at deficient levels for much of the winter wheat production region in Oklahoma. Therefore, the use of these products on non-nutrient limiting soils would unnecessarily increase the cost of production and decrease the return on investment. However, that is not to say these products should be avoided completely, in the event of a nutrient limiting soils some products show potential benefit for correct soil deficiencies. As observed some P containing products were able to provide adequate P concentrations for increasing yields and overcoming low pH conditions. This work along with previous work evaluating efficient fertilizer management suggest the correction of a nutrient deficient soil to be more important than the source of the nutrients and supports the need for soil testing and following recommendations.
This blog is a summation of Mr. Jonathon Williams thesis which was published in the Journal of Agricultural Sciences. Impact of in-furrow fertilizer on winter wheat grain yield and mineral concentration https://doi.org/10.1017/S0021859622000557
SIDEBAR
So we do small plot research to me in control of as many variables as possible. But all farmers and consultants know that fields are are variable and the results of small plots do not always translate well. I get that 100%, but for me as a scientist I need to understand the little things so that I can apply the knowledge on a large scale. Just last month I wrote a blog about cutting phosphorus rates BLOG. The third major take home of the blog was:
A composite soil sample is an AVERAGE of the field. If your average is right at the ok level (pH of 5.6ish and M3P of 30 ppm), then half of your field is below optimum and will benefit from P.“
That applies to what we learned from the above study. We found if soil test said nutrient was adequate we did not see a response of adding more. However if we combine the two blogs, if your composite soil test comes back just at the optimum level, there is a good chance at least 45% of field is below optimum and may respond.
So guess what my recommendation is. Soil SAMPLE, do it right (proper method and core numbers) and do it at the highest resolution you can afford, at least once.
Finally Do Not Skip on Nutrients when soil test says there is a need.
BA
Any questions or comments feel free to contact me. b.arnall@okstate.edu
Phosphorus decisions, Is it worth cutting P?
With the current conditions and input cost many wheat producers are considering cutting back on inputs. I can’t disagree with the plan, but I would caution against what you cut. If you have read any of my past blogs, or seen me speak, you should know I’m all for cutting back on pre-plant nitrogen (N). Based on some recent trials I would not argue cutting the potassium (K) side, but phosphorus (P) that’s another story that we will walk through in this blog.
First and foremost, soil testing is the key to P management. If your soil test is below the critical threshold for the test you use, 32.5 for Mehlich 3 (M3P), then you need to add phos. We have enough work that shows current recommendations work for P in wheat. Reeds paper Evaluation of incorporated phosphorus fertilizer recommendations on no-till managed winter wheat Link to Paper goes over soil test recommendations in no-till and the recent double crop soybean project Double Crop P and K Blog highlights the importance of P fertility, regardless of yield level. Also if your soil test is below a 5.5 and you haven’t limed (Liming is the best solution, Band-aids not so cheap Blog ), then the next best option is adding additional P to alleviate the aluminum toxicity Band-aids for low pH Blog. In-short if the fields soil test P and or pH is below optimum you should not forgo P application.
But the primary reason I am writing this blog is for those looking at fields with composite soil test that is right around the critical thresholds, and they are trying to make the call on to apply P or not to apply P. Even on fields with soil test values in the good level, I am usually in favor of banding in-furrow fertilizer wheat, but not because of the same reasons I am for corn. With corn you are planting in cool soils and the availability of nutrients like P is lower in cool wet soils. For wheat cold soil isn’t the concern until we reach the end of the planting window. It will serve as a bit of a “pop-up” as the crop comes out of dormancy in the spring. I have also seen little to no value of N applied in furrow. I see same response to DAP (18-46-0), MAP (11-52-0), and TSP (0-46-0) when all applied at same rate of P. Meaning it was the P not N making the difference.
For me the reason I still recommend getting a little phosphate out even when the soil test comes back is that the great majority of fields have a large range of variability. Looking at a set of 650 grid sampled fields across Oklahoma and Kansas it showed on average soil pH 6.0 and M3P was 34 ppm. Both pH and P are at adequate/optimum levels. However, the average is usually somewhere between the low and high point and in this data set and the range of soil pH was 1.8 units and the range in M3P was 67 ppm. That meant on average of the 648 field with pH values the average difference between low pH and high pH was 1.8 units and the difference between low P and high P was 64 ppm.

The field below is from Kingfisher county and was sampled at a resolution of 10 acres per sample. This is a fairly course resolution for grid sampling but provides a great view of how variable our soils can be. The field average pH is 5.3, which is below optimum but our aluminum tolerant wheats would be able to handle fairly well. For the P the average is 22 ppm which needs about 18 lbs of P2O5 to max yields. If the farmer applied a flat rate of 20 lbs there would be significant forage loss on about 65% of the field, for grain only about 45% of the field due to underapplication of P. Note that low P and low pH are not correlated well, meaning the areas low in pH are not always low in P.

Banding P makes it more efficient because it slows the rate of tie. However, we have plenty data that says broadcast applied P is still a great option, even after planting. So what are my take homes from this blog?
First: If you are grazing wheat get down 40-50 lbs of N pre. But I have plenty of data the pre-plant N on grain only wheat is not needed. I have the same amount of data that shows the only value of in-furrow N for grain only is that it forces you to plant more seeds, because it just lowers stand.
Second: When it comes to wheat pay attention to Phosphorus and soil pH. Even our acid tolerant wheats preform better in neutral soil pHs, especially forage wise.
Third: A composite soil sample is an AVERAGE of the field. If your average is right at the ok level (pH of 5.6ish and M3P of 30 ppm), then half of your field is below optimum and will benefit from P.
Fourth: If you can band P great, but if you cant broadcast is still a viable option. Do Not Skip P when soil test says there is a need.
Questions or comments please feel free to reach out.
Brian Arnall b.arnall@okstate.edu
Banding P as a band-aid for soil acidity, not so cheap now.
I am bringing this topic back to the surface now with the current outlook on phosphorus fertilizer. If you have heard its not only really expensive (current quotes on 4.24.26 are at $0.87 + per lbs P2O5 ) but the supply is short and will likely stay short through summer into the fall. So this year’s wheat crop, we need to be prepared to be smart with Phosphorus, and applying an extra 30lbs to band aid for soil acidity should not be in the cards. Look at it this way, if the phosphorus was at $0.65 a lb that $19.5 that could be spent on a ton of lime. That lime will last 3-5 years, while that P needs to be added every year. Not only that, but the lime will help root growth (better when we dry up), produce significantly more biomass, and make the phosphorus you’ve applied in the past available again for plant uptake. So make the plans now to soil sample as soon as this crop is off, you can get a soil test recommendation and plan for the lime trucks.
Original Blog Posted in 2021
Whoi Cho, PhD student Ag Economics advised by Dr. Wade Brorsen
Raedan Sharry, PhD Student Soil Science advised by Dr. Brian Arnall
Brian Arnall, Precision Nutrient Management Extension.
In 2014 I wrote the blog Banding P as a Band-Aid for low-pH soils. Banding phosphate to alleviate soil acidity has been a long practiced approach in the southern Great Plains. The blog that follows is a summary of a recent publication that re-evaluated this practices economic viability.
Many Oklahoma wheat fields are impacted by soil acidity and the associated aluminum (Al) toxicity that comes with the low soil pH. The increased availability of the toxic AL3+ leads to reduced grain and forage yields by impacting the ability of the plant to reach important nutrients and moisture by inhibiting root growth. Aluminum can also tie up phosphorus in the soil, further intensifying the negative effects of soil acidity. More on the causes and implication of soil acidity can be found in factsheet PSS-2239 or here (https://extension.okstate.edu/fact-sheets/cause-and-effects-of-soil-acidity.html). The acidification of many of Oklahoma’s fields has left producers with important choices on how to best manage their fields to maximize profit.
Two specific management strategies are widely utilized in Oklahoma to counter the negative impacts of soil acidification: Lime application and banding phosphorus (P) fertilizer with seed. While banding P with seed ties up Al allowing the crop to grow, this effect is only temporary, and application will be required every year. The effects of liming are longer lasting and corrects soil acidity instead of just relieving Al toxicity. Historically banding P has been a popular alternative to liming largely due to the much lower initial cost of application. However, as P fertilizers continue to increase in cost the choice between banding P and liming needed to be reconsidered.
A recent study by Cho et al.,2020 compared the profitability of liming versus banding P in a continuous wheat system considering the impacts that lime cost, wheat price and yield goal has on the comparison. This work compared the net present value (NPV) of lime and banded P. The study considered yield goal level (40 and 60 bu/ac) as well as the price of P2O5 fertilizer and Ag Lime. The price of P2O5 used in this study was $0.43 lb-1 while lime price was dictated by distance from quarry, close to quarry being approximately $43 ton-1 and far being $81 ton-1. For all intents and purposes these lime values are equivalent to total lime cost including application. Wheat prices utilized in the study were $5.10 bu-1 and $7.91 bu-1. It is important to note that baseline yield level was not considered sustainable under banded P management in this analysis. This resulted in a decrease in yield of approximately 3.2 bu ac-1 per year. This is attributable to the expected continued decline in pH when banding P is the management technique of choice.
The analysis in this work showed that lime application is cost prohibitive in the short term (1 year) when compared with banding P regardless of lime cost, yield goal level, and wheat value (within the scope of this study). This same result can be seen over a two-year span when yield is at the lower level (40 bu ac-1). While in the short-term banding P was shown to be a viable alternative to liming, as producers are able to control ground longer lime application becomes the more appealing option, especially when producers can plan for more than 3 years of future production. In fact, under no set of circumstances did banding P provide greater economic return than liming regardless of crop value, yield, or liming cost when more than 3 years of production were considered and only under one scenario did banded P provide a higher NPV in a 3-year planning horizon.
While historically banding P was a profitable alternative to lime application for many wheat producers the situation has likely drastically changed. At the time of writing this blog (09/17/2021) Diammonium Phosphate (DAP) at the Two Rivers Cooperative was priced at $0.78 lb-1. of P2O5. This is a drastic increase in P cost over the last year or so since Cho et al. was published in 2020. With P fertilizer prices remaining high it will be important for producers to continue to consider the value of liming compared to banded P. This is particularly crucial for those producers who can make plans over a longer time frame, especially those more than 3 years.
Addendum: As fertilizer prices have continued to rise a quick analysis utilizing the $0.78 lb-1 of P2O5was completed to consider the higher P fertilizer cost. Under this analysis an estimated decrease in NPV of approximately $38 an acre for P banding occurred. When considering this change in NPV, lime application becomes the more profitable option for alleviation of soil acidity symptoms even in the short term (assuming lime price values are equivalent to the previous analysis). This underlines the fact that it is imperative to consider the impact on profitability of the liming vs. banding P decision in the current economic climate for agricultural inputs.
Link to the Open Access Peer Reviewed publication “Banding of phosphorus as an alternative to lime for wheat in acid soil” https://doi.org/10.1002/agg2.20071
DAP in short supply? Revisiting, DAP vs MAP, Source may matter!
From mid August through October, fertilizer applicators and grain drills are running across the southern great plains wheat ground. Di-ammonium Phosphate (DAP 18-46-0) is maybe the most popular form of phosphorous (P) utilized in wheat production today. DAP delivers a high content of nitrogen (N) while efficiently binding the toxic aluminum (Al) ions low pH soils. However due to the flooding that occurred throughout the spring the Ports have been closed and DAP could be in short supply. I have heard that many companies and Co-ops have already sourced Mono-ammonium phosphate (MAP 11-52-0) to supplement the lack of DAP for our early planted wheat crop. With this happening, I wanted to share some points about the two sources. In a broadcast incorporated scenario I do not have much preference for one over the other. It is when producers are applying the fertilizer in-furrow or applying to alleviate Al toxicity that source can matter. As described in the post below, in a soil with a neutral pH DAP and MAP perform equally well. So in this scenario I give MAP a slight edge over DAP if the price is the same. I say this as you can run less material per acre with MAP and refill a little less often. Many worry about the drop in N delivered with MAP versus DAP but in my work I see that is the P in the starter that gives us a good response and not the N, which can be delivered with pre-plant or top-dress. However, DAP wins out in soils with a pH below 5.5. The original blog below shows the results when DAP and MAP are banded in acidic soils using the same rate of P per acre. The reason we see this happen is that when MAP dissolves it forms a slightly acidic solution (approx 4.0) while DAP will dissolve to form a slightly basic solution (approx 7.5). In our work BOTH DAP and MAP increased yield above the check in acidic soils, which goes to show MAP is an affect tool for short term remediation of aluminium toxicity (Band P for Al toxicity Blog). However it might require more MAP per acre to reach the equivalent results. Because of what we saw when comparing the two sources at equivalent rates of P, I would recommend increasing the rate of P2O5 from 30 lbs per acre to 35 or 40. This would be going from 65 lbs of DAP to 67-77 lbs of MAP per acre.
So the take home would be as this wheat season takes off and you find that DAP is hard to locate and you A) Have overall neutral (5.5+) pH levels do not hesitate using MAP. Run the normal amount of material getting a few extra lbs of P or apply less material to get the same amount of phosphate. B) Have a acidic situation and are banding to alleviate aluminum toxicity use the same amount of material or a little bit more. Keep in mind in acidic soils with a low soil test P level you have to apply enough phosphate to take care of the Al and enough to take care of the P deficiency. Note the results of the NPKS wheat response strip (NPKS BLOG)
Original Post Published July 18, 2016
DAP vs MAP, Source may matter!
Historically the two primary sources of phosphorus have had different homes in Oklahoma. In general terms MAP (11-52-0) sales was focused in Panhandle and south west, while DAP (18-46-0) dominated the central plains. Now I see the availability of MAP is increasing in central Oklahoma. For many this is great, with MAP more P can be applied with less material. which can over all reduce the cost per acre. There is a significant amount of good research that documents that source of phosphorus seldom matters. However this said, there is a fairly large subset of the area that needs to watch what they buy and where they apply it.
If you are operating under optimum soil conditions the research shows time and time again source does not matter especially for a starter. In a recent study just completed by OSU multiple sources (dry, liquid, ortho, poly ect ect) of P were evaluated. Regardless of source there was no significant difference in yield. With the exception of the low pH site. The reason DAP was so predominate in central Ok, soil acidity. See an older blog on Banding P in acidic soils.

Figure 1. The cover of an extension brochure distributed in Oklahoma during the 1980s.
When DAP is applied, the soil solution pH surrounding the granule will be alkaline with a pH of 7.8-8.2. This is a two fold win on soil acidity aka aluminum (Al) toxicity. The increase in pH around the prill reduces Al content and extends the life of P, and as the pH comes back down the P ties up Al and allows the plant to keep going. However, the initial pH around the MAP granule ranges from an acid pH of 3.5-4.2. There is short term pH change in the opposite direction of DAP, however the the Al right around the prill becomes more available and in theory ties up P even faster.
Below is a table showing the yield, relative to untreated check, of in-furrow DAP and MAP treatments in winter wheat. The N401 location had a ph 6.1 while Perk (green) has a pH of 4.8. At Perkins in the low pH, both forms of P significantly increased yield, almost 20 bushel on the average. DAP however was 5 bushel per acre better than MAP. At the N40 site the yield difference between the two sources was 1 bushel.

Relative yield winter wheat grain yield MAP and DAP both applied at equal rates of P (32 lbs P2O5 ac) when compared to a untreated check.
In general it can be said that in acid soils DAP will out preform MAP while in calcareous high pH soils MAP can out preform DAP. So regarding the earlier statement about the traditional sales area of MAP or DAP if you look at the soil pH of samples went into the Oklahoma State University Soil, Water, and Forage Analytical lab the distribution makes since.
Average soil pH of samples sent into OSU soil water forage analytical lab by county.
In the end game price point and accessibility drives the system. In soils with adequate soil pH levels, from about 5.7 to around 7.0, get the source which is cheapest per lbs of nutrient delivered and easiest to work with. But if you are banding phosphorus in row with your wheat crop because you have soil acidity, DAP should be your primary source.
Poly versus Ortho another year of data from Iowa
Guest Author, Dr. Jake Vossenkemper; OkState Grad and Agronomy Lead, Liquid Grow Fertilizer
Updated Research Comparing Ortho/Poly-Phosphate Ratios for In-Furrow Seed Safe Starter Fertilizers. Last years post Link
Article Summary
- Ortho-phosphates are 100% plant available, but a high percentage of poly-phosphates in starter fertilizers convert to ortho-phosphate within just two days of application.
- This quick conversion from poly- to ortho-phosphate suggests expensive “high” ortho starter fertilizers are not likely to result in increased corn yields compared to seed-safe fluid starters containing a higher percentage of poly-phosphate.
- On-farm field studies conducted near Traer, IA in the 2016 and 2017 growing season found no statistical difference (Pr > 0.05) in corn yield between conventional and high ortho-phosphate starters in either year.
- High ortho starters cost more per acer than 50/50 ortho:poly starters, but do not increase corn grain yields.
Polyphosphates Rapidly Convert to Plant available Orthophosphates
Given polyphosphates are not immediately plant available and orthophosphates are immediately plant available, this gives the promoters of “high” orthophosphate starters ample opportunity to muddy the waters. Nevertheless, the facts are, polyphosphates are rather rapidly hydrolyzed (converted to) into orthophosphates once applied to soils, and this hydrolysis process generally takes just 48 hours or so to complete.
In September of 2015, we posted a blog discussing some of the more technical reasons why the ratio of ortho to polyphosphates in starter fertilizers should have no impact on corn yields. For those that are interested in the more technical details, we encourage you to follow this link to the September 2015 blog post.
While we was relatively certain that the ratio of ortho to polyphosphates in liquid starters should have no effect on corn yields, we decided to “test” this idea with on-farm field trials located near Traer, IA in the 2016 and 2017 growing seasons.
How the Field Trial Was Conducted
In these field trials, we used two starters applied in-furrow at 6 gal/ac. Each starter had an NPK nutrient analysis of 6-24-6. The only difference between these two starters was the ratio of ortho to polyphosphates. One of these starters contained 80% orthophosphate and the other contained just 50% orthophosphate. With the remainder of the phosphorus source in each of these two starters being polyphosphate. Each plot was planted with a 24-row planter (Picture 1) and was nearly 2400 ft long. In both the 2016 and 2017 growing seasons the experimental design used was a randomized complete block with 4 or 5 replications.

Field Trial Results
Averaged over the side-by-side replications there was less than 1 bu/ac difference in corn grain yield between the high ortho and low ortho polyphosphate starters in both the 2016 and 2017 growing seasons. In addition to finding no differences in grain yield between these two starters, the high ortho starters generally cost about $1 more per/gal (so the $6/ac difference in price at a 6 gal/ac rate) than the low ortho starters. So the more expensive high ortho starter clearly did not “pay” its way in our multi-year field trials.
More Trials Planned for 2018
While our findings agree with other research-comparing ortho and polyphosphate starter fertilizers (Frazen and Gerwing. 1997), we want to be absolutely certain that our fertilizer offerings are the most economically viable products on the market. Therefore, we have decided to run this same field trial at one location in northern, IL in 2018, and at one location in central, IA in 2018. Stay tuned for those research results next fall.
References
Franzen D. and J. Gerwing. 2007. Effectiveness of using low rates of plant nutrients. North Central regional research publication No. 341. http://www.extension.umn.edu/agriculture/nutrient-management/fertilizer-management/docs/Feb-97-1.pdf (accessed 8 of Sept 2015).
A big Thank You to Dr. Vossenkemper for sharing this article with us.
The original article and his contact can be found at Link
Comparing Ortho/Poly-Phosphate Ratios for In-Furrow Seed Safe Starter Fertilizer
Guest Author, Dr. Jake Vossenkemper; Agronomy Lead, Liquid Grow Fertilizer
New Research Comparing Ortho/Poly-Phosphate Ratios for In-Furrow Seed Safe Starter Fertilizers
Article Summary
- Ortho-phosphates are 100% plant available, but a high percentage of poly-phosphates in starter fertilizers convert to ortho-phosphate within just two days of application.
- This quick conversion from poly- to ortho-phosphate suggests expensive “high” ortho starter fertilizers are not likely to result in increased corn yields compared to seed-safe fluid starters containing a higher percentage of poly-phosphate.
- A field study conducted near Traer, IA in the 2016 growing season found less than 1 bu/ac yield difference between a 50/50 ortho:poly starter and high ortho-phosphate starter.
- High ortho starters cost more per acer than 50/50 ortho:poly starters, but do not increase corn grain yields.
Poly-phosphates Rapidly Convert to Plant available Ortho-Phosphates
Given poly-phosphates are not immediately plant available and ortho-phosphates are immediately plant available, this gives the promoters of “high” ortho-phosphate starters ample opportunity to muddy the waters. Nevertheless, the facts are that poly-phosphates are rather rapidly hydrolyzed (converted to) into ortho-phosphates once applied to soils, and this hydrolysis process generally takes just 48 hours or so to complete.
In Sept. of 2015, I posted a blog discussing some of the more technical reasons why the ratio of ortho- to poly-phosphates in starter fertilizers should have no impact on corn yields. For those that are interested in those more technical details, I encourage you to follow this link to the Sept. 2015 blog post: https://www.liqui-grow.com/farm-journal/.
While I was relatively certain that the ratio of ortho- to poly-phosphates in liquid starters should have no effect on corn yields, I decide to “test” this idea with a field trial in the 2016 growing season conducted near Traer, IA.
How the Field Trial Was Conducted
In this field trial, we used two starter products applied in-furrow at 6 gal/ac. Each starter had an NPK nutrient analysis of 6-24-6. The only difference between these two starters was the ratio of ortho- to poly-phosphate. One of these starters contained 80% ortho-phosphate and the other contained just 50% ortho-phosphate with the remainder of the phosphorous source in each of these two starters being poly-phosphate. Each plot was planted with a 24-row planter (Picture 1) and plot lengths were nearly 2400 ft. long. In total, there were 5 side-by-side comparisons of the two starter fertilizers that contained different ratios of ortho- to poly-phosphates.
Field Trial Results
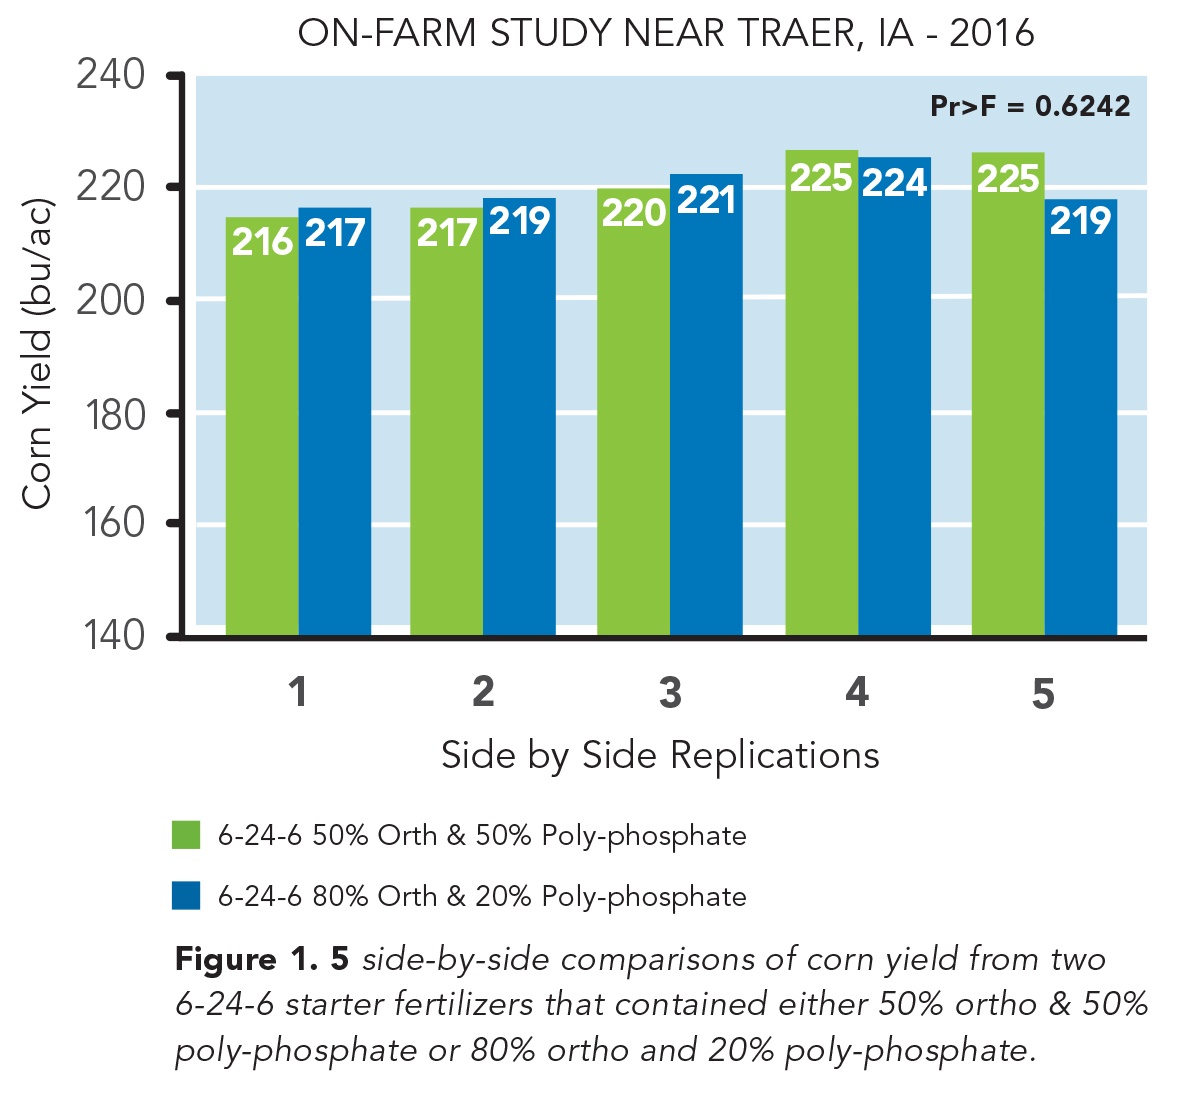
In general, there were no large differences in yield between the two starters in any of the 5 side-by-side comparisons, except for comparison number 5 (Figure 1). In comparison number 5, the 50% ortho/50% poly-phosphate starter actually yielded 6 bu/ac more than the high ortho starter. But averaged over the 5 side-by-side comparisons, there was less than 1 bu/ac yield difference between the high and low ortho starters (P=0.6712).
In addition to finding no differences in grain yield between these two starters, the high ortho starters generally cost about $1 more per gallon (so $6/ac at a 6 gal/ac rate) than the low ortho starters. So the more expensive high ortho starter clearly did not “pay” its way in our 2016 field trial.
More Trials Planned for 2017
While our findings agree with other research-comparing ortho- and poly-phosphate starter fertilizers (Frazen and Gerwing. 1997), we want to be absolutely certain that our fertilizer offerings are the most economically viable products on the market. Therefore, I have decided to run this same field trial at one location in northern Illinois in 2017, and at one location in central Iowa in 2017. Stay tuned for those research results this fall.

Picture 1
Planting starter fertilizer trials near Traer, IA in the growing season of 2016.
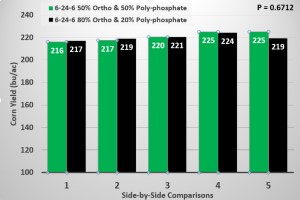
5 side-by-side comparisons of corn yield from two 6-24-6 starter fertilizers that contained either 50% ortho & 50% poly-phosphate or 80% ortho and 20% poly-phosphate. The field trial was conducted near Traer, IA in the growing season of 2016.
References
Franzen D. and J. Gerwing. 2007. Effectiveness of using low rates of plant nutrients. North Central regional research publication No. 341. http://www.extension.umn.edu/agriculture/nutrient-management/fertilizer-management/docs/Feb-97-1.pdf (accessed 8 of Sept 2015).
The Sufficiency versus Replacement tipping point.
Being educated in the realm of Soil Fertility at Oklahoma State University by the likes of Dr Gordon Johnson and Dr. Bill Raun, Brays Nutrient Mobility Concept and Mitscherlich’s Percent Sufficiency Concept are ingrained in my psyche. In class the concept of Build and Maintain for phosphorus fertilizer management was just briefly visited and not discussed as a viable option. For anyone in the corn belt, and some Okies, reading this that may seem unusual. But when I was in school on average in Oklahoma there was about 100-200 K acres of 100 120 bpa (bushel per acre) corn, 300-400 K acres of 40-50 bpa sorghum, and over 5 million acres of 20-30 bpa wheat. In a state with those average yields, replacing P removed by the crop was not a major concern.
But times are changing. There is more corn and soybean planted and the achievable yields of all crop are increasing. While the average winter wheat producer should not be worried about replacement rates of P there is a growing group of producers that should. This blog will discuss the scenarios in which sufficiency rates are best and those in which replacement should be considered. The OSU factsheet PSS-2266 goes in-depth on each of these methods.
Applying P based on sufficiency will increase soil test P levels in a low yielding environment. For example on a 20 bpa wheat field that starts out with a soil test P level of 0. Using the sufficiency recommendation each year the soil test value will reach 20 ppm (40 STP) in 20 years. A 30 bpa field would take 30 years. Yes that is a long time but the soil test value is increasing a little each year. The point of 20 ppm is important because at that level the crop is 95% sufficient, meaning if no P is added the crop will only reach 95% of the fields yield potential.
Using a mass balance approach we can determine at what point does the crop remove more than we can supply with in or near furrow starter fertilizer. Table 1 shows the values I am using for the discussion. The first column is just the average amount of P removed per bushel of grain, most of our grains fall in the .4 to .5 lbs P per bushel range. The second column is the soil test value at which P level is said to be at 90% sufficient. The reason this column is included is that the P2O5 reccomendation for this P level fits into the starter rate for all crops. The low high starter rates are the typical range of P2O5 that is delivered within the safe range (N based) and what I see as the common rates. These values may be above or below what you use.

Table 1. Values used to create Table 2. Phosphorus per bushel of grain. Mehlich 3 soil test value (ppm) at which crop is determined to be 90% sufficient, typical range of P2O5 applied with starter fertilizers, recommended P2O5 rate when soil test P is at 90% sufficiency.
Table 2 is pretty simple but it is the center point of this article. The one caveat I need to add is this assumes strip till or 2*2 / 3*2 is not being used. Table 2 is using the starter range and removal value to determine the yield level the starter can support. The first take on this table may provide some hint on why in a state with 5 million acres of wheat averaging 36 BPA the state soil fertility specialist didn’t focus on replacement rates. In fact for most for most the the wheat ground P application is higher than removal and P levels are slowly increasing. The big take home from this table should be is my yield level outside this window? If so do not immediately go out in crease your P rates but do take a close look at your system as a whole. Take a close look at your cropping system, not just one seasons but look at a three or four year cycle. Add up P applied and P removed, are you positive or negative net balance? If you are negative take a long hard look at your soil test over time. Some soils can supply a large amount of P even if you are removing more than you apply. Other soils will be rapidly drawn down. Regualr soil testing allows for producers to keep an eye on these values.

Table 2. Yield level (bushels per acre) at which P removal is equal to P added in starter fertilizer application.
In the end even if the production warrants the use of replacement rates, the current market may not. For more on that read https://osunpk.com/2016/08/27/now-may-not-be-the-time-for-replacement/.
Speaking of market currently both soybeans and cotton are getting a lot of attention due to how the economics is penciling out. Soybean is a “heavy” P crop pulls .8 lbs per bpa while cotton removes 13 lbs per bales. Both of these crops are salt sensitive and the rate of inforrow is typically quite low providing only about 6 lbs when on 30″ rows. If you are growing beans or cotton make sure you account for their removal when you talley up your system.
Below is a table that I wanted to add, well because I like it. This table illustrates that buildup, and drawdown, rate is heavily impacted by existing soil test value. In short it takes a lot more fertilizer P to raise soil test p levels in a very low P testing field than it does when soil test P is closer to optimum, 19 lbs per 1 lb at STP of 10 and 5 lbs per lb when STP is 65. The exact rate changes by soil type and the same holds true to drawn down via crop removal.

Amount of P2O5 above crop removal needed to increase soil test phosphorous based upon initial soil test results.
Adapted From http://www.spectrumanalytic.com/support/library/ff/Soil_test_P_and_K_buildup_and_drawdown.htm “Drawdown of Soil Test Phosphorus and Potassium Levels by Alfalfa, K.L. Wells & J.E. Dollarhide, Univ. of Kentucky, Soil Science News & Views, Vol. 21, No. 3, 2000”
Any questions or comments? Feel free to contact me at b.arnall@okstate.edu
DAP vs MAP, Source may matter!
Historically the two primary sources of phosphorus have had different homes in Oklahoma. In general terms MAP (11-52-0) sales was focused in Panhandle and south west, while DAP (18-46-0) dominated the central plains. Now I see the availability of MAP is increasing in central Oklahoma. For many this is great, with MAP more P can be applied with less material. which can over all reduce the cost per acre. There is a significant amount of good research that documents that source of phosphorus seldom matters. However this said, there is a fairly large subset of the area that needs to watch what they buy and where they apply it.
If you are operating under optimum soil conditions the research shows time and time again source does not matter especially for a starter. In a recent study just completed by OSU multiple sources (dry, liquid, ortho, poly ect ect) of P were evaluated. Regardless of source there was no significant difference in yield. With the exception of the low pH site. The reason DAP was so predominate in central Ok, soil acidity. See an older blog on Banding P in acidic soils.
Figure 1. The cover of an extension brochure distributed in Oklahoma during the 1980s.
When DAP is applied, the soil solution pH surrounding the granule will be alkaline with a pH of 7.8-8.2. This is a two fold win on soil acidity aka aluminum (Al) toxicity. The increase in pH around the prill reduces Al content and extends the life of P, and as the pH comes back down the P ties up Al and allows the plant to keep going. However, the initial pH around the MAP granule ranges from an acid pH of 3.5-4.2. There is short term pH change in the opposite direction of DAP, however the the Al right around the prill becomes more available and in theory ties up P even faster.
Below is a table showing the yield, relative to untreated check, of in-furrow DAP and MAP treatments in winter wheat. The N401 location had a ph 6.1 while Perk (green) has a pH of 4.8. At Perkins in the low pH, both forms of P significantly increased yeild, almost 20 bushel on the average. DAP however was 5 bushel per acre better than MAP. At the N40 site the yield difference between the two sources was 1 bushel.
Relative yield winter wheat grain yield MAP and DAP both applied at equal rates of P (32 lbs P2O5 ac) when compared to a untreated check.
In general it can be said that in acid soils DAP will out preform MAP while in calcareous high pH soils MAP can out preform DAP. So regarding the earlier statement about the traditional sales area of MAP or DAP if you look at the soil pH of samples went into the Oklahoma State University Soil, Water, and Forage Analytical lab the distribution makes since.
Average soil pH of samples sent into OSU soil water forage analytical lab by county.
In the end game price point and accessibility drives the system. In soils with adequate soil pH levels, from about 5.7 to around 7.0, get the source which is cheapest per lbs of nutrient delivered and easiest to work with. But if you are banding phosphorus in row with your wheat crop because you have soil acidity, DAP should be your primary source.
