Home » Cotton Production
Category Archives: Cotton Production

Protect Your Emerging Stands: True Armyworm Movement from Maturing Wheat to Summer Crops
Ashleigh M. Faris, Cropping Systems Extension Entomologist & IPM Coordinator
As the Oklahoma winter wheat crop reaches maturity, producers and crop consultants should prepare for the annual migration of true armyworm larvae. While true armyworms are a common fixture in small grains, their movement out of maturing wheat and into newly emerged corn, soybeans, and sorghum can lead to stand thinning or loss if not monitored closely.
True Armyworm Migration Timeline
True armyworm moths typically migrate into Oklahoma from the south in early spring with infestations typically occurring in late April through the first two weeks of May. The first generation is typically laid in winter wheat. Once the larvae currently finish their development in wheat, they will soon seek new food sources as the wheat crop dries down. This transition period is the most critical time for scouting summer crops, especially those adjacent to wheat fields.
True Armyworm Life Cycle and Identification
Armyworms overwinter as pupae or as mature larvae which pupate in the spring. Moths emerge in the spring, mate, and lay eggs in masses on hosts plants (mostly in the grass family). Female moths deposit their eggs in low-lying areas on wheat or pasture ground, as well as field margins or fields with dense, grassy weeds like Johnson grass. Larvae feed for about 4 weeks but do most of their damage during the last 10 days of this period. They then pupate in the soil. A new generation of moths emerges about 1 week later. There are 4 generations per year in Oklahoma.
True armyworms have a smooth body and can be variable in color, ranging from green, tan, orange, and black, with distinct pale orange or reddish stripes running along the sides (Figure 1). A key identifier is a dark diagonal band on each of the abdominal prolegs; there are four pairs of prolegs (Figure 2). The head capsule is light brown with a distinct “net-like” or honeycomb pattern of dark lines (Figure 2).
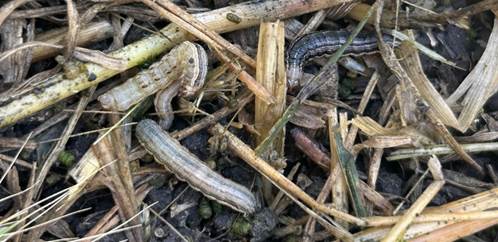
Figure 1. Four true armyworm larvae. One is dark (right) and three are light colored (left). Photo by Ashley Dean, Iowa State University Extension.
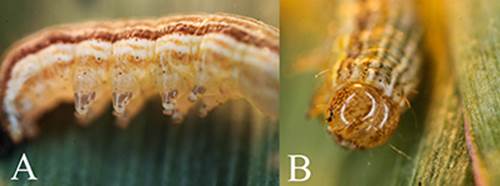
Figure 2. True armyworm. A) Dark band on prolegs. B) Orange head capsule with dark net-like pattern. Photos by Adam Varenhorst, Iowa State University Extension.
True Armyworm Management Cutoff in Wheat
A common question during this window is whether to treat armyworms in maturing wheat. Once wheat reaches the soft dough stage, the crop has generally accumulated its yield. Unless larvae are actively head-clipping (cutting the wheat heads off the stems), chemical control is rarely economical at this stage. Instead of treating the wheat, focus on young stands of summer crops. As wheat turns brown, larvae will move toward the nearest green tissue—often your emerging corn or sorghum.
Scouting, Damage, and Economic Thresholds for Summer Crops
Armyworms are whorl feeders in grass crops like corn and sorghum and will also feed on soybean leaves. True armyworms hide in the soil, crop residue, or whorls during the heat of the day and feed at in the early morning, evening or late when it is cool outside. When it is warm, larvae will hide in the soil, crop residue, or the whorl of corn plants. Large larvae consume more tissue but will generally be done feeding in a few days. Insecticides should target young, small larvae that will be feeding for a long time; however, you may see a range of larval sizes in a single field.
Corn, Sorghum, and Soybean Damage
True armyworm feeding typically begins at the leaf edges, leaving ragged holes and edges (Figure 3). As this leaf tissue is removed, the larvae will move to the upper leaves and continue feeding. True armyworms do not tunnel into the stalk and generally do not feed on the growing point of larger corn and sorghum plants. While not the preferred host, true armyworms will move into soybeans if no grasses are available. Larvae typically cause defoliation (Figure 4); however, soybeans are quite resilient to early-season leaf loss, but scout for stand-thinning if larvae are clipping seedlings.
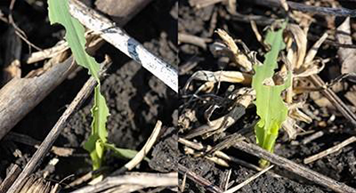
Figure 3. True armyworm feeding on young corn plant. Photo by Adam Varenhorst, Iowa State University Extension.
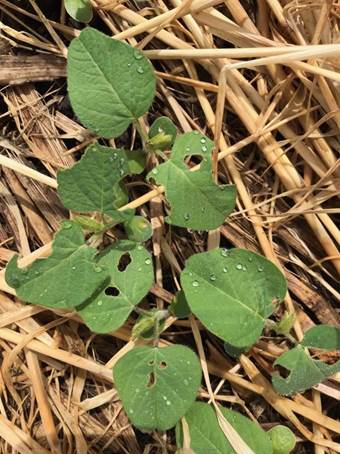
Figure 4. Soybean leaves with true armyworm feeding damage. Photo by Meaghan Anderson, Iowa State University Extension.
Corn Threshold: Small plants typically recover from true armyworm feeding and outgrow the defoliation. Per Kansas State Extension, treatment is justified only when larvae are less than 1.25 inches long and present on 30% of plants with 5 – 6 extended leaves, or when 75% of plants have one or more larva per plant. There is risk of yield loss if defoliation during reproductive stages approaches the ear zone before hard dent. Lower thresholds may apply if the plants are subject to additional stresses.
Sorghum Threshold: Sorghum is very tolerant of defoliation, so insecticide control is rarely justified. For early infestations (5-7 leaf stage, prior to panicle development) at the vegetative stages where true armyworms may be in the whorl, do not initiate controls unless 40% or more of the plants in a field are infested. Because the worms are only defoliating at this point in the sorghum plant’s development, economic damage is not a concern and there would likely be no return on investment for spraying before panicle development.
Soybean Threshold: Once grasses are fed upon or harvested, true armyworms can turn tobroadleaf crops, including soybean. While soybean is not a preferred host, the growing point is exposed early in the season, making them susceptible to stand loss. Management is suggested if soybean defoliation is greater than 35% – 40% during the vegetative stages.
True Armyworm Insecticide Management Options for Summer Crops
True armyworm is generally easier to control with pyrethroids than fall armyworm. Ensure high-volume water (10-15 GPA ground) is used to get the product into the whorl or canopy where the larvae hide. Remember that most insecticides work via contact; if true armyworm larvae are feeding or hiding under dense residue, insecticides are unlikely to make contact and are ineffective. Target applications when larvae are actively feeding on foliage to ensure good contact. Follow all instructions on the insecticide label to ensure good control.
For a complete list of recommended insecticides and rates for these crops, please consult the following OSU Fact Sheets: CR-7167: Management of Insect and Mite Pests in Corn and Sorghum and CR-7115: Management of Insect and Mite Pests in Soybean.
The information given herein is for educational purposes only. Reference to commercial products or trade names is made with the understanding that no discrimination is intended and no endorsement by the Cooperative Extension Service is implied.
Pre-plant Irrigation
Sumit Sharma, Irrigation Management Extension Specialist.
Jason Warren, Soil and Water Conservation Extension Specialist.
Pre plant-irrigation is a common practice in Western Oklahoma to recharge soil profile before growing season starts. Pre-plant irrigation is useful when the irrigation capacity is not enough to meet peak ET demand. It can also be important to germinate and provide for optimum emergence of the crop. As such, pre-plant irrigation is not useful when the soil profile is already wet, or soil profile is not deep enough to store moisture, or if planting dates are flexible and can wait until rains can recharge soil profile. Pre-plant irrigation becomes an important consideration if the previous crop had extensive rooting systems, which depleted moisture from deep in the profile. The crops in western Oklahoma especially in the Oklahoma Panhandle depend on stored water in the profile to meet ET demand during peak growth period, especially when well capacities are limited. Deep profiles and excellent water holding capacities of soil found in the region make the storage of a considerable amount of moisture possible. While pre-plant irrigation to recharge the whole profile (which can be 6 feet deep) may not be possible or advised, producers can still use certain tools to assess the stored water in the profile and make decisions on pre-plant irrigation.
A soil push probe (Figure 1) can provide a crude estimate of the moisture in a soil profile. For example, if an average person can push the probe to 2 feet, this means that the first 2 feet of the profile has moisture stored in it. The profile beyond 2 feet is considered too dry to push the probe through. This method does not provide the amount of water stored in the profile. For accurate measurements of soil moisture, soil samples could be collected, weighed, dried and weighed again to determine the water content in the soil. An alternative is to install moisture sensors, however this is usually not practical due to potential damage during planting, although some probes that can be permanently buried are becoming available. On average a clay loam soil in western Oklahoma can hold up to 2 inches of plant available water per foot. The approximate water holding capacity of your soil can be found on the websoilsurvey. Your county extension or NRCS personnel should be able to help you navigate this website if necessary. When the water holding capacity of your soil is known, the use of a push probe can provide a preliminary estimate of soil water content. Probing should be done at multiple locations in the field on both bare and covered (with crop residue) spots. The presence of crop residue reduces evaporation and increases infiltration so the first thing you will notice is that it is generally easier to push the probe into the surface where the ground is covered by residue. If the soil water content is near full the probe will be easy to push into the soil and it may even have mud on its tip when you pull it out. In this case you can estimate that the water content to the depth of penetration is near field capacity and that the current water content is equal to the water holding capacity. For example, if you can push the probe 2 ft into a soil with a water holding capacity of 2 inches/ft then we expect to have 4 inches of plant available water. In contrast if it takes some effort to push the rod 2 ft the estimated water content may be reduced.

When pre-irrigation is applied it can be useful to assess the increase in the depth to which the probe can be pushed into the soil after the irrigation event. For example, if 1 inch of irrigation is applied to the soil in the example above, we may expect that after this irrigation event we can push the rode 2.5 ft. However, in some case we may be able to push the rod 3 ft. The reason being that although we could not push the rod beyond 2 ft before the irrigation event, the soil below this depth was not completely dry. Therefore, the 1 inch of water was able to move to a depth of 3 ft. This is useful information, telling us that the soil below the depth we can push the rod contains some water and that each inch we apply may drain a foot into the profile. Generally, we expect the rooting depth of most crops to be able to extract water from at least 4 ft. Although it is certainly possible to extract water from below this depth, we generally don’t want to pre water our soils to full beyond 4 ft. When we fill the profile with pre water, we are increasing success of the following crop by providing the stored moisture that can offset deficits that may occur in the growing season. However, we are reducing our opportunity to capture and utilize spring rainfall. We must consider this when applying pre-irrigation, because if it is followed by rainfall in excess of ET our irrigation efficiency is greatly reduced by the drainage or runoff that can occur.
Soil Acidity and Cotton Production
Raedan Sharry, Precision Nutrient Management Ph.D. student
Brian Arnall, Precision Nutrient Management Extension Specialist
Cotton production in Oklahoma has expanded the past decade into areas which other production systems such as continuous wheat may have traditionally dominated. Fields that have been managed for continuous wheat production may have become acidic in response to management practices, such as the use of ammoniacal nitrogen fertilizers. In response to the acidification of these soils it may be important to recognize and understand the potential impacts of soil acidification on cotton production.
To better document the impact of soil pH on cotton lint yield and quality a study was conducted over the 2019 and 2020 growing seasons at two locations: Stillwater, OK (EFAW farm) and Perkins, OK. Soil pH in these experiments were adjusted to a depth of approximately 6 inches using aluminum sulfate (acidifying) and hydrated lime (alkalinizing). All three locations were planted to two varieties; NexGen 3930 and Deltapine 1612 at a rate of approximately 35,000 seeds per acre, into plots with soils ranging in pH from 4.0 to 8.0.
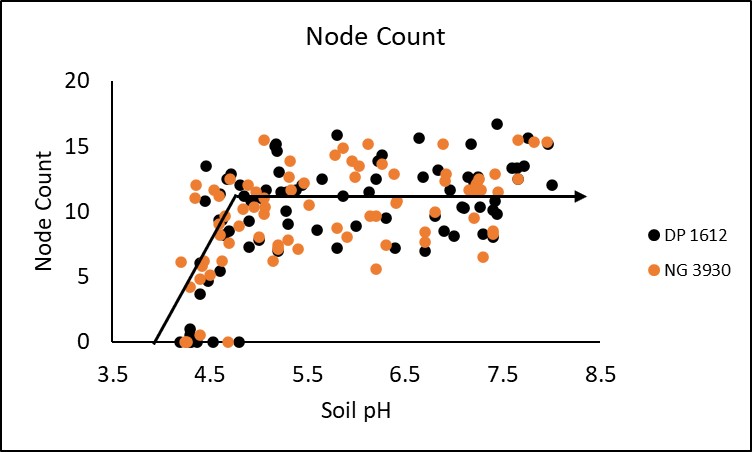
In season measurements taken included stand count, plant height, node count and NDVI (normalized difference vegetative index. All four in season measurements demonstrated a significant critical threshold in which soil pH negatively impacted crop performance. Stand was significantly decreased at a soil pH of 5.3 or lower. This trend is displayed in Figure 1. Plant height and node count depicted in figures 2 and 3 respectively were both significantly decreased when soil pH dropped below 5.3 and 4.9, while NDVI began to deteriorate around a pH of 5.1 (Figure 4). Response to soil pH level was also visually observable as shown by Figure 5 from the Perkins 2019 location.


Yield levels across this experiment ranged from 0 to 1284 lbs. of lint per acre. In this work yield is reported as relative yield. To calculate relative yield the yield of each plot is normalized to the average of the three highest yields for that site. This method of reporting yield response allows this work to be applied across a range of yield environments.

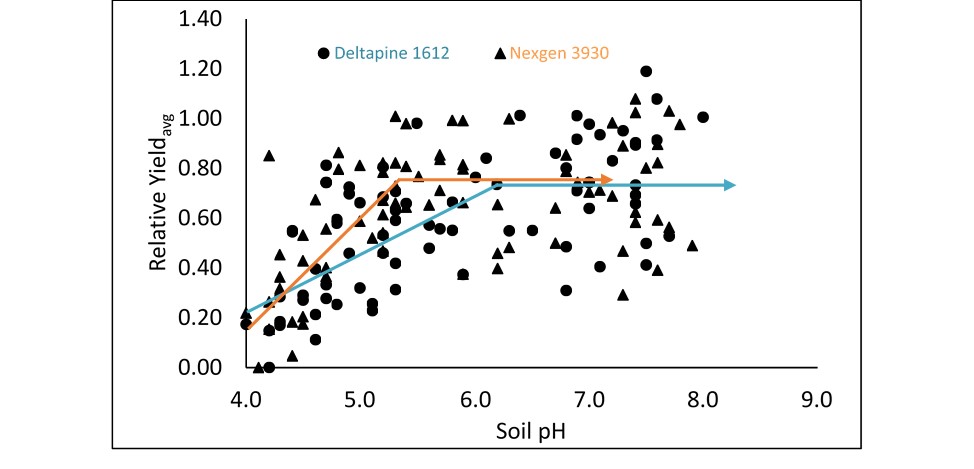
When all sites and cultivars were combined relative yield reached a plateau at approximately 73% of yield with a critical threshold observed at a pH of 5.4. Below this critical threshold yield decreased at a rate of 37% per point of pH decline. This equates to 15% yield loss at a pH of 5.0, 33% yield loss at a pH of 4.5, and 52% yield loss at a pH of 4.5. This relationship is depicted in Figure 6. It is important to note that yield was 0 when pH was 4.3 in two plots. This represents the possibility for total crop failure when planting into very acidic conditions.
Differences in relative yield between cultivars were insignificant. However, further investigation may produce a significant difference. Critical threshold for the DP 1612 and NG 3930 cultivars were 6.1 and 5.2 respectively. This suggests that there may be value in further examining the influence of genetics on cotton response to soil acidity.
SUMMARY
The influence of soil pH level on cotton productivity is confirmed by this study. All three sites evaluated provided a strong correlation between soil pH and lint yield, as well as the in-season growth parameters measured. While this study is likely to be expanded to another location to provide a more robust evaluation of the potential impact of soil acidity on cotton, the current dataset provides ample evidence to conclude that soil acidity is likely to be detrimental to cotton production in the southern plains. Soil pH levels below 5.5 appear to provide the greatest opportunity for yield loss as depicted above. Lint quality measurements taken in the study (micronaire, length, uniformity, and strength) showed no consistent trends in the relationship between quality parameters and soil pH suggesting that soil acidity had a limited influence on lint quality characteristics. Cotton response to soil pH is likely to be influenced by the environment of a specific location and growing season. This underlines the importance of understanding the soil properties that negatively impact productivity, such as the presence of toxic forms of aluminum or manganese. It is also important to highlight the possibility of acidic conditions significantly affecting the ability of the crop to access important nutrients such as phosphorus. Under acidic conditions cotton productivity is likely to be significantly decreased unless soils are neutralized using a soil amendment such as lime.
Project Supported by the
Oklahoma Cotton Council
Cotton Incorporated
Oklahoma Fertilizer Checkoff Program
