A result of the 2016-17 winter wheat crop was a significant amount of discussion focused on protein levels. For two years running now, the protein levels have been low across the board. Low protein brings in a challenge to sell, could impact local basis, and even more concerning is that low protein is an indicator that nitrogen was limiting during grain fill. Therefore, the field maximum yield potential was not achieved. In this blog, we talk about what protein is, what can be done to maintain a good protein level, and what can be done to increase protein if desired.
First, the definition of protein is any of a class of nitrogenous organic compounds that consist of large molecules composed of one or more long chains of amino acids and are an essential part of all living organisms, especially as structural components of body tissues such as muscle, hair, collagen, etc., and as enzymes and antibodies. Protein is also one of the many attributes that determines end-use quality and marketability of winter wheat. Sunup TV met with Dr. Carver in the baking and milling lab to create a great video discussing wheat quality impact on baking and milling.
We determine protein by measuring the percent of nitrogen in the grain and multiplying by a factor of 5.7. So if the grain has N % of 2.5, the protein content is 14.25. The amount of N in the grain is affected by many variables such as weather during grain fill, yield level, and N availability during grain fill. If weather is conducive to good grain fill and test weight is high, we will often see protein values dip. On the other hand when grain fill conditions are hot and dry and we have light test weight, wheat protein will be higher. Research has shown (Figures 1 and 2) that generally as yields increase protein levels decrease. Of course if N is limited during grain fill, the N available for the grain is reduced, and the plant is forced to get all grain N from re-immobilizing N in the leaf tissue.
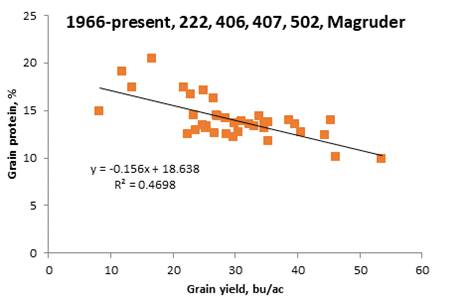
Fig 1, Yield and protein averages from all of the OkState Long Term fertility trials. Data courtesy Dr. Bill Raun.

Fig 2, Grain protein and yield of from intensively managed wheat. Data Courtesy Dr. Romulo Lollato KSU.
Maintaining Protein, and yield.
Managing nitrogen to maintaining protein and maximizing yield comes down to making sure that N is available at critical growth periods. With wheat, the critical uptake stage is typically the time frame between hollow stem and soft dough. The two graphs below show nitrogen uptake in wheat and barley. If the same graph was made for dual purpose wheat, the upward swing would start sooner but would follow the same general trend.

Fig 3, Nutrient Uptake of Wheat found in “Agricultural and Biological Sciences » “Crop Production”, ISBN 978-953-51-1174-0, Chapter 5 By Juan Hirzel and Pablo Undurraga DOI: 10.5772/56095″

Fig 4, Nitrogen uptake in Barley at two nitrogen rates. http://apps.cdfa.ca.gov/frep/docs/N_Barley.html
When it comes to making sure N is available during this time of peak need, the only way we can do that is apply just before it is needed. This means split application. While putting all the nitrogen out pre-plant as anhydrous ammonia is the cheapest method, it is also the method that provides the lowest nitrogen use efficiency and is most likely to show deficiencies late in the season. One of the challenges with 100% preplant N application is that years with good yield potential coincide with years with good/high high rainfall, which means more nitrogen loss. Some interesting results from studies implemented in the 2016-17 cropping season showed the importance of nitrogen application timing. The study is determining how long nitrogen application can be delayed after the N-Rich strip becomes visible (https://osunpk.com/2013/09/19/nitrogen-rich-strips/). For the study, 90 lbs of N was applied on one of the treatments at planting When that plot became visibly greener or bigger than the rest, N application was triggered. After the 0 DAVD (Days after visual difference where the day had growing degree days >0), another treatment was applied every 7 growing days for 63 growing days. Each plot, excluding the zero N check, received 90 lbs as NH4NO3 (we use this to take the variable of volatilization out of the data). In all cases, 90 lbs applied in late January to early February was better than 90 lbs pre-plant. Keep in mind there was 0 N applied at planting for each DAVD application timing; yet, we still hit 50-80 bushel wheat with nothing but in-season N. This is the result of supplying the N when the plant needs it. I should add this is just one year of data, and every year is different. The study is being replicated again this year and will be highlighted at the Lahoma field day.
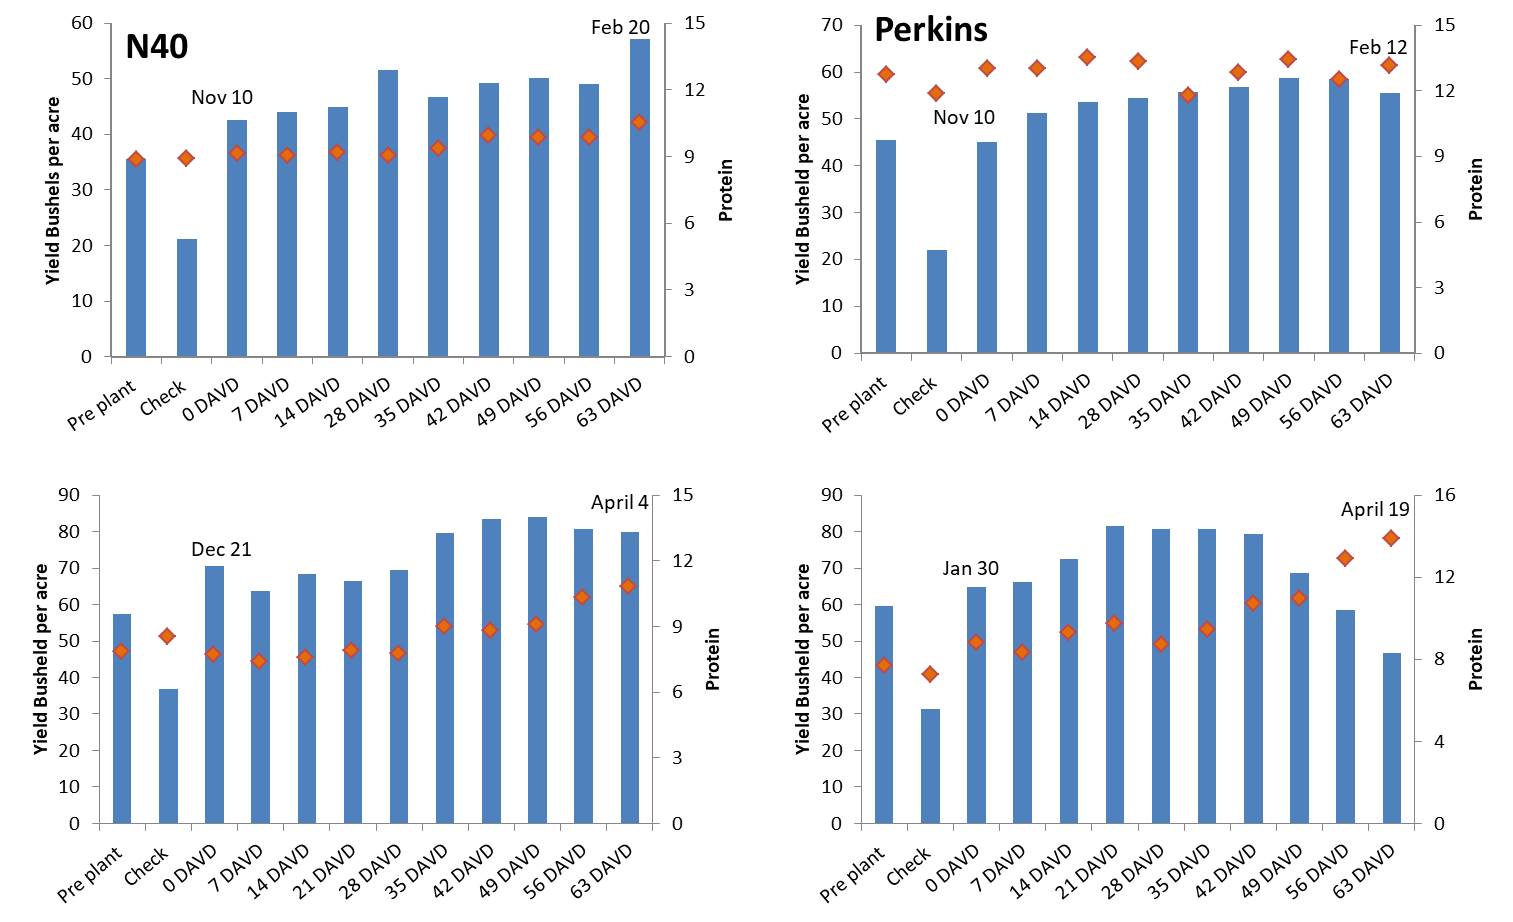
Fig 5, Results from the 2016-2017 delayed nitrogen study led by Mr. Joao Bigato Souza. The trials consisted of a preplant plot, unfertilized check plot, and then a series treatments in which N application was based on days from a visual difference between the pre-plant and check. All fertilized plots received 90 lbs N as NH4NO3. DAVD is days after visual difference. (Error in bottom left graph, the last date should be March 27 not April 4)
For dual-purpose wheat, the total amount of N expected for the forage production needs to be applied pre-plant. Oklahoma State recommends 30 lbs N for every 1,000 lbs of forage expected For grain-only wheat, there needs to be only 20 to 40 lbs of N available to the crop when planted (this includes residual N). The remaining N should be applied at green up or early spring. The only way to ensure that N is applied when the crop needs it is to utilize the N-Rich Strip method. Having a N-Rich strip in your field lets you know when the wheat needs more nitrogen and when it does not.

Fig 6. Nitrogen Rich Strip (N-Rich) showing up in a No-till wheat field.
Two years testing the N-Rich Strip and Sensor based nitrogen rate calculator (SBNRC) from the Texas boarder to the Kansas boarder showed that the SBNRC on average reduced N but maintained yield and protein when compared to standard farmer practice (Table 1).

Table 1. Results from testing the Nitrogen Rick Strip and Sensor Based Calculator Method across Oklahoma wheat fields.
Increasing Protein
Some producers may plan to market high protein for a premium if available. Fortunately, there are opportunities to increase protein via management. While most of the strategies for increasing protein happen later in the growing season, some of the early decisions can be a significant contributing factor. Variety selection and keeping the plant healthy and free of competition (i.e., pest management) throughout the growing season are going to increase the opportunity to produce high protein wheat. After that, the equation goes back to Figures 3 and 4 and making sure the crop has access to nitrogen during peak periods, including grain fill. If you will note, the bottom two graphs of Figure 5 both show significant increases in protein on the later applications. For both locations, this was when N (90 lbs N ac-1) was applied after full flag leaf emergence. There has been a significant amount of work at OSU looking at late application of N stretching back into the 1990s http://nue.okstate.edu/Index_Publications/Foliar_N_Curt.pdf. The focus has been looking at timing, source, and rate. The take home of decades of work can be summarized as such. Yes, protein can be increased with late season application, but not always. Applying N at or after flowering has a significantly greater probability of increasing protein than a application at flag-leaf. Source of N has had little impact if managed properly (UAN, 28-0-0, has to be watered down so that it does not burn the plant). The rate of N does matter quite a bit. Most of the work suggests that for every pound of N applied, the percent grain protein could increase by .05%. So to increase protein from a 12.5% to 13.5%, it would require approximately 20 lbs of N per acre. My work has shown the same trend that a 20 lbs application at post-flowering had more consistent increases in protein than lower rates at the same time or similar rates applied at flag leaf.
This wheat season we are looking to improve our knowledge of management on protein content through multiple studies by continuing the evaluation of varieties and management practices.
If you have any questions for comments please feel free to contact me.
Brian A.
B.arnall@okstate.edu
