Home » Posts tagged 'Oklahoma' (Page 4)
Tag Archives: Oklahoma

Nitrogen Rich Strips, a Reminder
With the recent increase in fertilizer prices just prior to winter wheat planting season I felt it was a good opportunity to bring this older post back up and give it an update. Since the blog was originally written in 2013 there has been a lot of work done both to better understand the nitrogen fertilizer need / timing of winter wheat and efforts to updated and improve the algorithms behind the Sensor Based Nitrogen Rate Calculator.
The Nitrogen Rich Strip, or N-Rich Strip, is a technique/tool/process that I spend a great deal of time working with and talking about. It is one of the most simplistic forms of precision agriculture a producer can adopt. The concept of the N-Rich strip is to have an area in the field that has more nitrogen (N) than the rest. In recent years we have been utilizing Zero-N strips in corn. The approach to some may be new but at one point most producers have had N-Rich Strips in their fields, albeit accidentally. Before the days of auto-steer it was not uncommon, and honestly still is not, to see a area in the field that the fertilizer applicator either doubled up on or skipped. In our pastures and dual purpose/graze out wheat every spring we can see the tell-tale signs of livestock deposits. When over laps or “Cow Pox” become visible we can assume the rest of the field is behind in nitrogen. The goal of an N-Rich Strip is to let the field tell you when it needs more N. Research has shown wheat can be yellow and recover completely and it may even be a benefit. See the link for the Value of In-season Nitrogen at the end of this blog.

What I like most about the N-Rich Strip approach is its Simplicity. The N-Rich Strip is applied and; Scenario 1. The N-Rich Strip becomes visible (Greener) you APPLY NITROGEN, Scenario 2. The strip is not visible you Option A. DON’T APPLY NITROGEN Option B. Apply Nitrogen Anyways. The conclusion to apply N or not is based on the reasoning that the only difference between the N-Rich Strip and the area 10 ft from it is nitrogen, so if the strip is greener the rest of the field needs nitrogen. If there is no difference N is not limiting and our research shows N does not have to be applied. However producers who decide to be risk adverse (in terms of yield) can apply N but it would be advised to do so at a reduce the rate. Now is a good time to note that the N-Rich Strip alone provides a Yes or No, not rate recommendation. At OSU we use the GreenSeeker optical sensor and Sensor Based Nitrogen Rate Calculator (SBNRC) to determine the rate, but that discussion will come later. I equate the change from using yield goal N rate recs to the N-Rich Strip as to going from foam markers to light bars on a sprayer. Not 100% accurate but a great improvement.


Now that we have covered the WHY, lets get down to the nuts and bolts HOW, WHEN, WHERE.
How the strip is applied has more to do with convenience and availability than anything else but there are a few criteria I suggest be met. The strip should be at least 10 ft wide and 300 ft long. The rate should be 40 to 50 lbs N (above the rest of the field) for grain only wheat and canola, 80 lbs N for dual purpose wheat. The normal recommendation is that when applying pre-plant either have a second, higher rate programmed into the applicator or make a second pass over an area already fertilized. Many will choose to rent a pull type spreader with urea for a day, hitting each field.
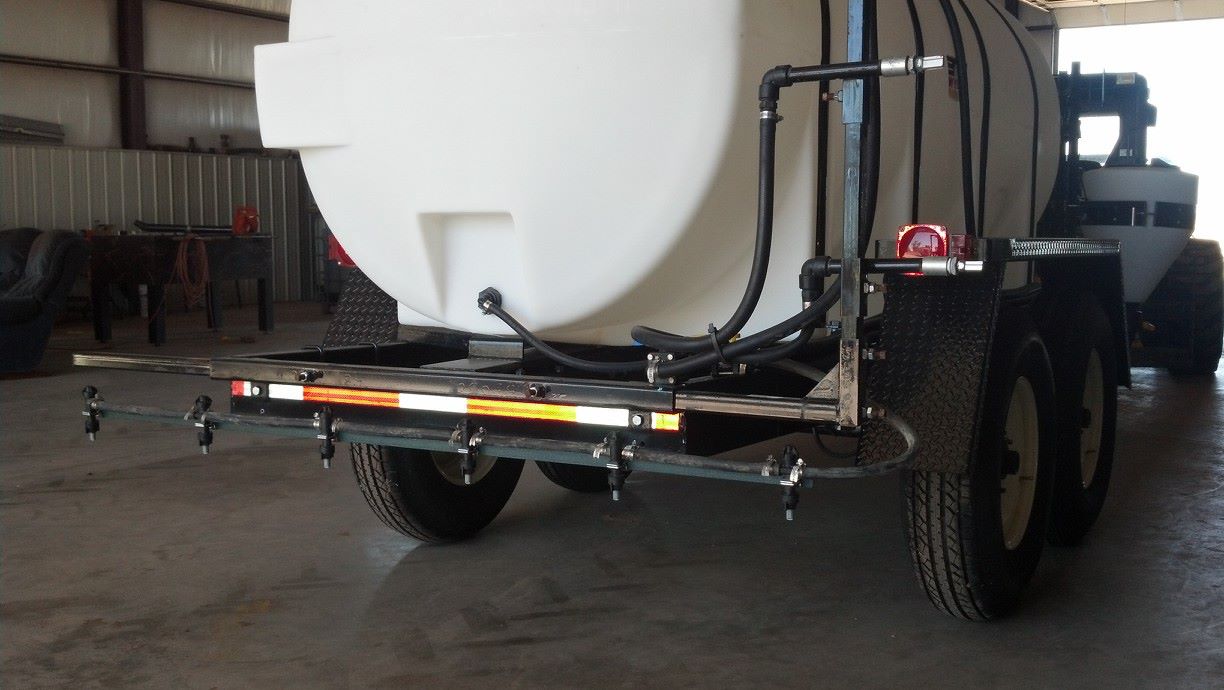
Also popular are applicators made or adapted for this specific use. ATV sprayers are the most common as they can be multi-purpose. In most cases a 20-25 gallon tank with a 1 gpm pump is placed on the ATV with an 8-10ft breakover boom. The third applicator is a ride away sprayer with a boom running along the rear of the trailer. In all cases when liquid is the source I recommend some form of streamer nozzle.
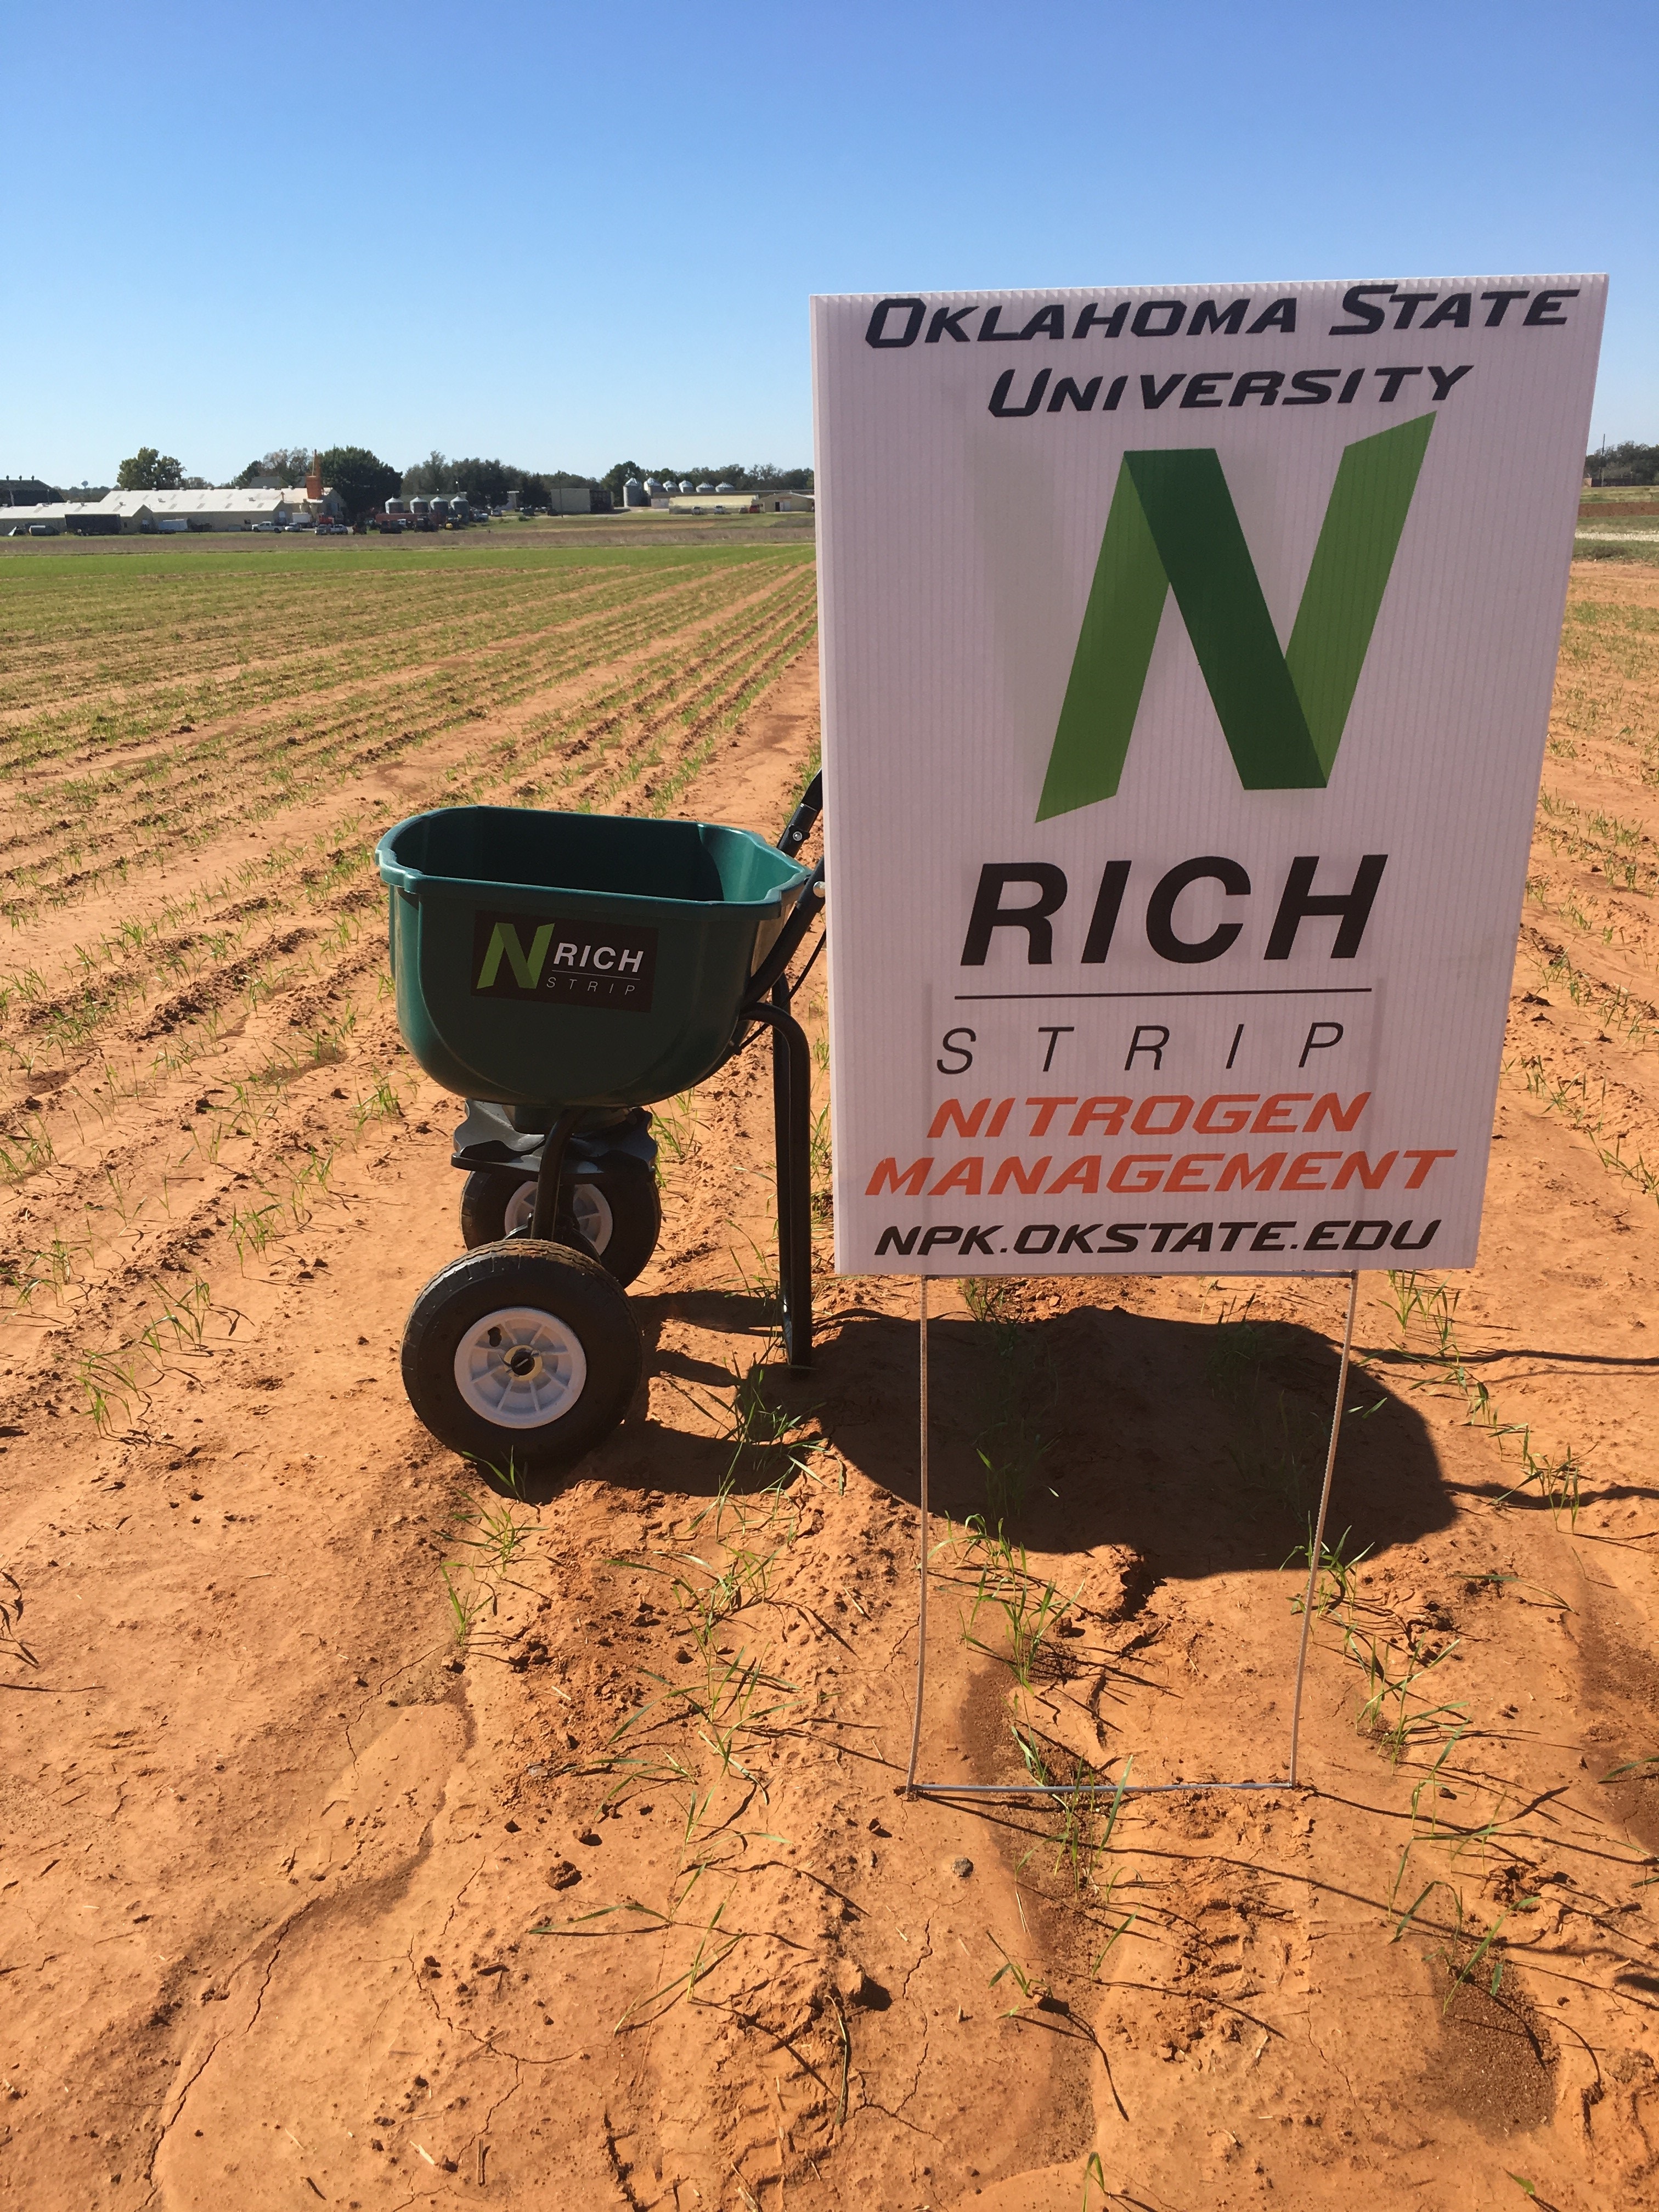
If this all sounds like to much then the easiest application method might just be a push spreader. No need for trailer or even a truck. In most cases I recommend whichever N source is the easiest, cheapest, and most convenient to apply.

When the strip is applied in winter crops proper timing is regionally dependent. For the Central Great Plains, ideally the fertilizer should be applied pre-plant or soon after. However, in most cases as long as the fertilizer is down by December or even January everything works. Timing is more about how much the wheat is growing. If it is slow growing fall, timing can be delayed. When the N-Rich Strip approach is used on the Eastern Shore in Virginia and Maryland the strips have to be applied at green up. We have been trying this in Oklahoma and Kansas with good success. It is always important to make the tools fit your specific regional needs and practices and not the other way around.
Where is actually the biggest unknown. The basic answer is to place the N-Rich Strip in the area that best represents the field. Many people question this as it doesn’t account for spatial variability in the field, and they are correct. But my response is that in this case spatial variability is not the goal, temporal variability is. Keeping in mind the goal is to take a field which has been receiving a flat yield goal recommendation for the last 30+ years and make a better flat rate recommendation. My typically request is that on a field with significant variability either apply a strip long enough to cross the zones or apply smaller strips in each significant area. This allows for in-season decisions. I have seen some make the choice to ignore the variability in the field, made evident by the strip, and apply one rate and others choose the address the variability by applying two or more rates. One key to the placement of N-Rich Strips is record keeping. Either via notes or GPS, record the location of every strip. This allows for the strips to be easily located at non-response sites. It is also recommended to move the strip each year to avoid overloading the area with N.
For more information on N-Rich Strips
Factsheets
https://extension.okstate.edu/fact-sheets/applying-nitrogen-rich-strips.html
Related Blogs
YouTube Videos
Nitrogen Source: What’s “cheap” now may be lost later
Raedan Sharry, Ph.D. Student, Precision Nutrient Management
Brian Arnall, Extension Specialist, Precision Nutrient Management
Note, this blog is focused on grain only winter wheat production.
Crop producers looking to increase profits often consider how to reduce costs without sacrificing yield and/or quality. This applies to essentially all production functions including nitrogen application. Winter wheat growers in the southern Great Plains have a wide number of options available to them when considering nitrogen source and application technique. At the time of writing (08/27/2021) fertilizer prices obtained from the Two Rivers Farmers Cooperative are as follows ($/unit): UAN (28-0-0) $0.62, NH3 (82-0-0) $0.45, and Urea (46-0-0) $0.62. These price levels equate to approximately a 57% increase in urea cost, 65% increase in UAN28, and a 65% increase in NH
Application Timing
Winter wheat producers in the southern plains have historically applied nitrogen (N) fertilizer prior to planting, often utilizing anhydrous ammonia for application due to its generally lower price point per unit of N relative to other sources. However, research at Oklahoma State shows that if the total N application is delayed until approximately feekes 5 to feekes 7 stages (jointing) yields were increased 23% of the time while grain protein was increased 68% of the time. By delaying N application to later in the growing season N is more likely to be available when the crop requires by avoiding conditions conducive to losses. Further reading on delaying nitrogen application can be found here (https://osunpk.com/2020/09/10/value-of-in-season-application-for-grain-only-wheat-production/)
A study located a Perkins, OK observing yield and protein response provides an example of an expected response to delayed N. In this study 3 N fertilizer rates (180, 90 and 45/45 split) across 5 different timings (Pre, 30, 60, 90, and 120 days after planting) where investigated. Grain yield was maximized by the 180 lb. rate applied 60 days after planting, while protein was maximized at the 120 days after planting timing. This same trend continues across all N rate levels as the later N applications whether at 60 or 90 increased yield relative to the pre while the 120 days after planting application maximized protein level regardless of rate level. However, maturity of the 120 day application treatment was severely delayed. This experiment shows the ability to sustain yield while decreasing N rate if N application is pushed to later in the season to avoid conditions that lead to N losses as displayed by the 90 lbs. at 90 days after planting treatment compared to the 180 lb. pre-plant rate.

Application Cost
Application costs are directly related to choice of source utilized. For instance; anhydrous ammonia application is predicated on the use of a pulled implement such as a low disturbance applicator for in-season application or a tillage implement for pre-season application. This is compared to other sources such as urea or ammonium nitrate which may be broadcast, or UAN that can be applied using a sprayer. The relationship between source and cost of application is inherently related to the application efficiency of the equipment used. Table 2 below provides a rough idea of cost associated with different application methods. (Information Retrieved from Iowa State). Fuel cost assumed at $2.60/gal. Labor cost assumed to be $15.00/hr.
| Implement | Operating Efficiency | Fuel cost/ac | Labor Cost/ac | Operating cost/ac |
| 90’ SP Sprayer | ~78 ac/hr | $0.34 | $0.19 | $0.53 |
| 60’ Dry Spreader | ~30 ac/hr | $0.39 | $0.50 | $0.89 |
| 35’ Sweep Plow | ~21 ac/hr | $1.43 | $0.71 | $2.14 |
In many operations across the southern plains efficiency has become a key factor in decisions such as input selection and equipment purchases. This has come in response to the need to cover more acres with less labor. With that in mind and looking back to table 2 it is easy to see that a self-propelled sprayer is likely able to cover more acres than other equipment options. This most likely should be considered when considering options for N management in the wheat crop.
Summary
With wheat sowing quickly approaching for many and field preparation nearing completion it is important to consider your nitrogen management options. Delayed N application allows for flexibility in management plan and depending on source utilized may increase application efficiency over pre-plant applications requiring a tillage implement. As fertilizer prices continue to remain high it is also important to consider the likely increase in N use efficiency due to applying N closer to when N requirement is peaking. Controlling cost while continuing to maximize output is imperative to sustainable profitability in crop production.
Any Question or Comments please feel free to reach out me.
Brian Arnall b.arnall@okstate.edu
Yellow Wheat the 2020 Edition.
I have been trying to write this blog addressing the yellow wheat for about two weeks now. But with finally finding a dry”ish” day or two and a lot of calls and emails about yellow wheat, I am just now getting to it.
So the short story is there is a lot of wheat out there in the state that is show signs of chlorosis, or yellowing. I wish I could say I have all the answers for you in this article, but I will have to lay heavily upon the agronomist best answer, “Well it Depends.”.
Cow pox showing up in a wheat field in Kay County.
First we will start with the things I know least about and then move on to things that are more in my wheelhouse. In the last two weeks I have been on multiple email strings trying to chase down the cause of chlorosis in fields all over the state. One of these included Dr. Bob Hunger and the Plant Disease & Insect Diag Lab (PDIDL) and in one field his final thought was “So, my best guess is cold and wet soils along with fungi colonizing the older leaves that are starting to senesce.” At the same time I am finding regular occurrence of Tan Spot and Leaf Rust increase. All these pathogen cause some level of chlorosis and if you do not get down and pull some samples you will never know the cause.

Originally thought to be leaf rust, but corrected by Dr. Hunger who suggested it is early stages of striped rust, found in Stillwater Oklahoma 3.27.2020.
A new for me this year is what I am calling the herbicide ding. I was able to get over a lot of my wheat that first week of March with a shot of herbicide, everything was almost to hollowstem. The wheat really got dinged. Very visual yellowing and stunting of the plants. Talking with Dr Manucheri, she had seen the same thing in her plots in Tipton. I have also visited several farmer fields with the same symptoms. Dr. Manucheri shared with me the Finesse label. Directly from the label “Temporary discolorations and/or crop injury may occur if herbicide is applied when the crop is stressed by severe weather conditions (such as heavy rainfall, prolonged cold weather, or wide fluctuations in day/night temps), disease or insect damage, low fertility, applications to course soils, or when applied in combination with surfactant and high rates of liquid fertilizer solutions.” This can be found on page 5, http://www.cdms.net/ldat/ldFSL002.pdf . You can just about mark off every weather and application condition mentions, on the same field.
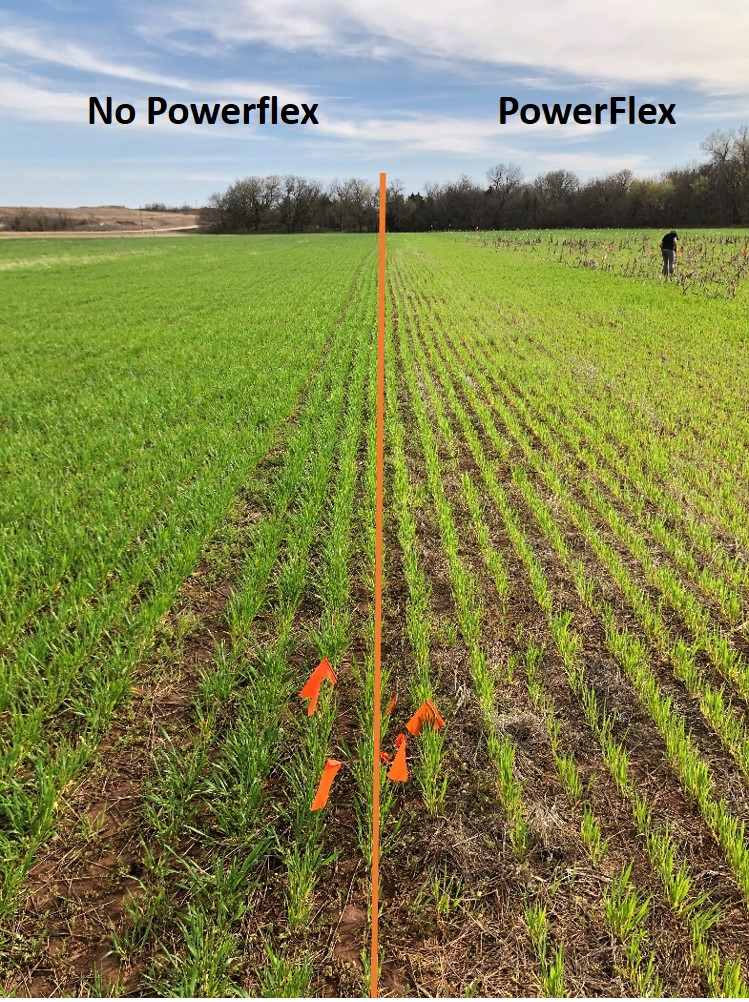
Image collected 3.25.20. The right side was treated with Powerflex on 3.5.20. The left side was not treated so that sorghum could be planted in April.
Now to the yellow wheat I can comfortably talk about. There is nitrogen deficiencies out there. That should not come as a shock with the amount of rain we have received over the last couple months. I also believe that a fair amount of the wheat crop out there is a bit lacking on roots department.

The overarching wet cools soils that we have more than likely have led to reduced root exploration in some areas. And if you combine short roots with a nitrate leaching then the probability of N being out of the reach of the crop is high. Then the question is “Is there still time to do anything?”. The trip I look over the weekend (3/28, 3/29) that encompassed a great deal of the North Central Ok wheat belt showed me that the majority of the wheat had really progressed physiologically in the last two weeks. At this point, a positive return on N investment hinges on the stage the wheat is at.
Our delayed N work over the past several years show that we have maintained the yield on our trials even when fertilizer was delayed into the first week of April. https://osunpk.com/2019/08/14/how-long-can-wheat-wait-for-nitrogen-one-more-year-of-data/

Each graph is from a location where the delayed N study was preformed. The objective of our study was to determine the impact of prolonged nitrogen deficiency on winter wheat grain yield and protein. Eight studies were conducted with 11 N application timings in no-till dryland conditions. A pre-plant treatment of 90 lbs ac-1 of N was broadcast applied as ammonium nitrate (AN). We used AN as our source because we wanted to measure the crops ability to recover and eliminate the impact of source efficiencies. When visual symptom differentiation (VSD) was documented between the pre-plant and the non-fertilized check, i.e the N-Rich Strip showed up, top-dress applications were performed every seven growth days (GDD> 0) (https://www.mesonet.org/index.php) until 63 growth days after VSD at all sites. The only N the treatments received where applied according to treatment structure. No pre-plant N was applied on the trials other than the Pre-plant treatment.

This table shows the application dates of the 10 site years of the delayed nitrogen study. The first column is the location, to the right of the location is two rows the top is grain yield and the bottom is grain protein. Each of the following columns corresponds to an application date. Applications began at each study when the The colors are related to whether that application was statistically (Alpha=0.05) worse than, equal too, or better than applying nitrogen at the first sign of deficiency (0DAVD). For this comparison it is important to know that at no location did preplant have significantly greater yield than 0DAVD.In the majority of those years that first week of April corresponded with the growth stage Feekes 8, last leaf just visible. As the crop moves beyond that point, catching up did not happen. Currently there is wheat out there in the state that has not hit hollow stem (Feekes 6) and there is wheat at Flag leaf (Feekes 9).

The Feekes Scale focused in on the stem extension growth phase. The period extends from hollow-stem (Feekes 6) to boot (Feekes 10).
The high rainfall totals we have could have also led to another deficiency sulfur. In the past S deficiency is fairly hard to find in Oklahoma. Our long history of low S using winter wheat and high sub-soil S levels have kept the response to Sulfur low, but not uncommon. Sulfur is a mobile nutrient and will also be lost via leaching especially in sandy soils in the northern part of the state. Sulfur deficient is different from N in that it shows in the newer growth as a general yellowing of crop. Kansas State has a lot of great resources on sulfur management in wheat. https://webapp.agron.ksu.edu/agr_social/m_eu_article.throck?article_id=2132
https://bookstore.ksre.ksu.edu/pubs/MF2264.pdf
Sulfur deficiency in wheat. Photos by Dorivar Ruiz Diaz, K-State Research and Extension
If your wheat is yellow and before you call the fertilizer applicator, first confirm it is nitrogen and or sulfur and not something else. A key point to nitrogen deficiency is that the cholorsis will be worst on the oldest leafs while new growth is green. If N deficiency is confirmed then figure out how far along your wheat is. If the crop is around hollow stem to Feekes 8, if you can get the N on soon there is a good chance to get your money back plus. Keep in mind with air temps above 60 degrees UAN will burn the tissue so it is best to use streamer nozzles, which will still burn but the tissue damage is lessened. If you do not have access to streamers you can dilute the UAN with water and use flat fan nozzles. Cutting the UAN with water reduce the impact of leaf burn, I typically recommend at least 2 part UAN to 1 part water, but a 1 to 1 is the safest.

Image of wheat with forage burn from UAN applied with streamer nozzles. Application was made two days prior with air temps where above 80 degrees.
If you have any questions or concerns please feel free to email any questions you may have.
Brian Arnall
b.arnall@okstate.edu
Using the GreenSeeker after Freeze Damage
After discussions with producers in southern Kansas I felt the need to bring back this past blog. It seems that much of (not all) the early planted wheat lost a significant amount of biomass during the winter and the N-Rich Strip GreenSeeker approach is producing what looks to be low yield potentials and N-Rate recommendations. This should be treated much like we do grazed wheat and the planting date should be adjusted, see below. It is also important to note that in the past year a new wheat calculator was added to the NUE Site. http://nue.okstate.edu/SBNRC/mesonet.php. Number 1 is the original OSU SBNRC but the #2 is calculator produced by a KSU/OSU cooperative project. This is the SBNRC I recommend for use in Kansas and much of the norther tier of counties in OK.
Original Blog on Freeze Damage and the GreenSeeker.
Dr. Jeff Edwards “OSUWheat” wrote about winter wheat freeze injury in a receive blog on World of Wheat, http://osuwheat.com/2013/12/19/freeze-injury/. As Dr. Edwards notes injury at this stage rarely impact yield, therefore the fertility requirements of the crop has not significantly changed. What will be impacted is how the N-Rich Strip and GreenSeeker™ sensor will be used. This not suggesting abandoning the technology in fact time has shown it can be just as accurate after tissue damage. It should be noted GreenSeeker™ NDVI readings should not be collected on a field that has recently been damaged.
A producer using the N-Rich Strip, GreenSeeker™, Sensor Based N-Rate Calculator approach on a field with freeze damage will need to consider a few points. First there need to be a recovery period after significant tissue damage; this may be one to two weeks of good growth. Sense areas that have had the same degree of damage as elevation and landscape position often impacts the level of damage. It would be misleading to sense a area in the N-Rich strip that was not significantly damaged but an area in the Farmer Practice that took a great deal of tissue loss.
Finally we must consider how the SBNRC, available online at http://nue.okstate.edu/SBNRC/mesonet.php, works. The calculator uses NDVI to estimate wheat biomass, which is directly related to grain yield. This predicted grain yield is then used to calculate nitrogen (N) rate. So if biomass is reduced, yield potential is reduced and N rate reduced. The same issue is seen in dual purpose whet production. So the approach that I recommend for the dual purpose guys is the same that I will recommend for those who experienced significant freeze damage. This should not be used for wheat with just minimal tip burn.
To account for the loss of biomass, but not yield, planting date needs to be adjusted to “trick” the calculator into thinking the crop is younger and has greater potential. Planting date should be move forward 7 or 14 days dependent For example the first screen shot shows what the SBNRC would recommend using the real planting date. In this case the potential yield is significantly underestimated.
The second and third screen shots show the impact of moving the planting date forward by 7 and 14 days respectively. Note the increase in yield potential, which is the agronomically correct potential for field considering soil and plant condition, and increase in recommended N-rate recommendation. Adjust the planting date, within the 7 to 14 day window, so that the yield potential YPN is at a level suitable to the field the yield condition and environment. The number of days adjusted is related to the size and amount of loss. The larger the wheat and or greater the biomass loss the further forward the planting date should be moved. In the example below YPN goes from 37 bu ac on the true planting date to 45 bu ac with a 14 day correction. The N-rate changes from 31 lbs to 38 lbs, this change may not be as much as you might expect. That is because YP0, yield without additional N, also increases from 26 to 32 bushel.
 Image 1. Planting date 9/1/2013. YPN 37 bu ac-1 and N-Rec 31 lbs ac-1.
 Image 2. Planting date 9/8/2013. YPN 40 bu ac-1 and N-Rec 34 lbs ac-1.
 Image 3. Planting date 9/15/2013. YPN 45 bu ac-1 and N-Rec 38 lbs ac-1.
This adjustment is only to be made when tissue has been lost or removed, not when you disagree with the yield potential. If you have any questions about N-Rich Strips, the GreenSeeker™, or the online SBNRC please feel free to contact me at b.arnall@okstate.edu or 405.744.1722.
Results from 1st year of Soybean Starter Work
In the spring of 2014 we initiated what was to be the first year of a three year project evaluating starter fertilizers for soybean production in the southern Great Plains. The first and second year was and is being funded by the Oklahoma Soybean Board.
Year one was a bit experimental in that with so many products on the market we needed some initial work to help focus the direction for years two and three. I also added a treatment which I knew would have significant negative impact, for extension reasons. Keep in mind two locations in a single year does not make an experiment nor provide enough information to draw a definite conclusion. It is however enough to learn some lessons from and for us to plan for our 2015 trials.
The 2014 trial consisted of 12 treatments, Figure 1 and Figure 2. In these treatments I wanted to see the impact of a standard practice, see if a specific nutrient may be more so beneficial, and evaluate a few popular products. The spring of 2014 started out dry so at one of our two locations we pre-watered. This was done by hauling water to the Lake Carl Blackwell (LCB) 1000 gallons at a time and pumping through sprinklers. The other site, Perkins, we delayed planting until we had moisture.

Treatment Structure and rates for the 1st year of the Soybean Starter Study.

List of fertilizers and products used.

Image taken while planting the Soybean Starter study at Perkins. A CO2 system was used to deliver starter fertilizers with seed.
The two locations were also selected due to differences in soil fertility. The LCB site is has good soil fertility, with exception of phosphorus (P), and the Perkins site pH was an issue. I would have expected a benefit from adding P at both of these locations. Figure 4 shows the soil test results.

Soil Test results from LCB and Perkins.
At LCB as expected some of the treatments (Thio-Sul) reduced stand, some unexpectedly reduced stand (Fe) and others had less impact on stand (APP 5.0) than expected. The growth at LCB was tremendous, the 30 in rows covered over very quickly and the majority of the treatments hit me waist high by early August (I am 6’0”). Many of the treatments showed greater growth than check. But when it comes down to it, grain pays and green does not. Statistically there were no treatments that out preformed the un-treated check, however the K-Leaf and 9-18-9 did make 3 and 2 bpa more than the check respectively. What I am hypothesizing at this site is that the added nutrients, especially those with high P levels, significantly increased vegetative grown and these big plants were delayed into going reproductive and they started setting pods later in much hotter weather. While riding in the combine I could see that the plots with compact plants with clearly defined rows out yielded those were the vines had crossed over and we harvested through more of a solid mat of mature plants. A hot August is not uncommon and I am curious on whether this trend repeats itself. If it does this may direct us into research evaluating ways to force/promote the reproductive stage to start in these big plants. Even if we can force flowering to start earlier, it’s unknown whether yields will increase or not.
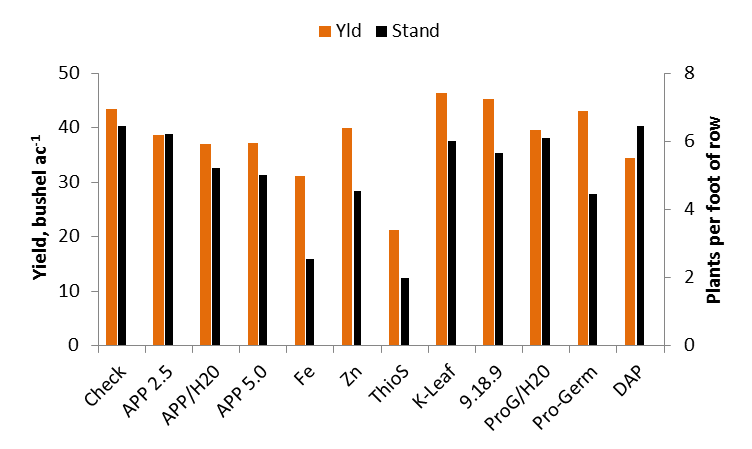
Yield and Stand counts from the 2014 LCB Soybean Starter Study.

The Check plot at LCB were plants noticeably a bit smaller and more yellow than the neighbors with phosphorus.

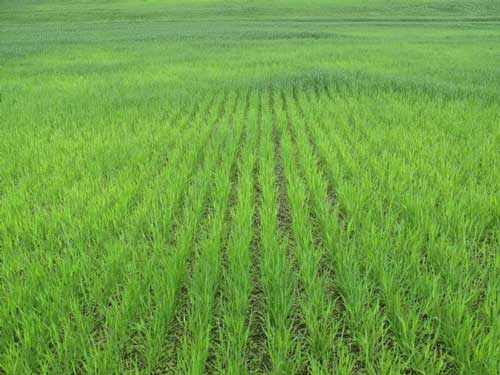
Soybeans at LCB on August 4th.
The same trends in treatments reducing stand can be seen at Perkins, however the impact was less extreme. Perkins being planted later due to waiting on moisture forced a later flowering date and I believe reduced overall yields. But the addition of P at this low pH site definitely made a difference. While again no treatments were statistically greater than the un-treated check the 2.5 gpa APP, DAP broadcast, APP/H2O, and Pro-Germ/H20 treatments increased yield by 5.6, 4.2, 3.8 and 1.7 bpa respectively.

Yield and Stand Counts from the Perkins 2014 Soybean Starter Study.
Take home from year one was that at LCB the addition of a starter fertilizer had little benefit and if done wrong could cost you yield while at the low pH site of Perkins an addition 2.5 gallons of APP did get a 5 bpa bump, but do to variability in the trial the increase was not statistically significant. This year we will drop some of the treatments and incorporate a few new treatments. Based on the current weather we look to potentially being able to start with better soil moisture at planting. Again do not take this work and significantly adjust any plans you have for your 2015 soybean crop. This is however some interesting findings that I wanted to share and make everyone aware of. Finally thank you to the Oklahoma Soybean Board for providing funding for this work. www.oksoy.org/
Response to NPKS strips across Oklahoma
From the fall of 2011 to about a week ago one of my grad students, Lance Shepherd, has spent A LOT of time burning up the highways and back roads of Oklahoma. Lance’s project was titled “NPKS Strips in Oklahoma winter wheat”, basically an extension of the N-Rich Strip concept. We wanted to see if we could or would find a response to added nitrogen (N), phosphorus (P), potassium (K), or sulfur (S) fertilizer on top of the farmer’s fertilizer applications. Over the two crop years lance applied NPKS strip on more than 80 fields from the Kansas border to the Red River. Of those 80+ Lance was able to collect, by hand, grain samples from 59 sites. Over the next few weeks I will be sharing some of the juicy tidbits we are gleaming from this fantastic data set.

NPKS applicator. Gandy boxes hold each fertilizer and a pto driven fan blew the fertilizer down the boom.
For the project at every site Lance collected soil samples to 18”, documented soil type and collected producer fertilizer, variety, and field history information. Over the 59 locations there were essentially 236 trials. The yield of each strip (N,P,K, and S) was compared back to a sample collected from the field, referred to as Farmer Practice. Of the 236 comparisons there were a total of 17 positive responses. Of these 17 responses seven were to N, seven to P, three to K, with no responses to S.

N-Rich strip very evident in field west of Alva. N-Rich 70 bu/ac Farmer Practice 38 bu/ac.
We are learning a great deal from these 17 locations. The biggest take home was that in most instances soil test results identified the yield limiting factors. For example of the seven responsive P locations six had either a low soil pH or low soil P index, some both. At only one site was there a response not predicted by soil test. Of all 59 harvested fields more than just six had low P or pH levels however most producers had applied enough fertilizer to reach maximum yield. For nitrogen two items proved to be the most likely reason for loss of yield, under estimated yield goal or environment conducive to N loss. As for the K responses we look at both K and chloride (Cl) as KCl, 0-0-62 potash, was applied in the K strip. Just looking at the soils data K was not low at any of the three sites. However, two sites are in sandy loam soils, which is conducive to Cl deficiencies. The lack of response to S was not surprising as soil tests indicated S was sufficient at all 80 locations were strips were applied. So again what did we learn from these plots, soil testing is key in maximizing yield and profitability and in most of the N responsive sites the N-Rich strip indicated a need for added fertilizer in February.
Placing Fertilizer with Canola at planting has positives and negatives.
With all things holding constant the last canola trials of our project should be picked up by the plot combine Thursday 6-20-13. Before the first yield results comes to my desk I can tell you that we are learning a great deal from the trials this year. In particular the DAP (18-46-0) placed with seed trail that was supported by the Oklahoma Oilseed Commission. This past year at the no-till site in Perkins, which has a low soil pH, the check plots that did not receive any fertilizer, preplant or banded, did not survive the winter. Additionally at both of our locations, Lahoma (low soil test P) and Perkins, we have documented that oil content was reduced when phosphorus was left out of the treatment.
Additionally out of the four site years, that is two locations over two years, the addition of DAP with the seed in-row reduced stand. The graph below shows just how much stand was reduced on a relative basis. Relative stand is a way to compare the DAP treated to the Check (no DAP) which we assume is 100%. So if we look at the graph below the plots were at 75% relative stand (i.e. 25% loss) at approx 5 lbs N per ac. By about 15 lbs N the stand was down to 50%.
There are a few things to keep in mind first, in the case of these trials stand loss did not always mean yield loss. Canola is a great compensatory crop, if there is open space it will grow into it. I will have to run the final yield data to get more answers. These trials were planted on 15″ rows putting down 5 lbs seed per ac, or at least that was the target rate. Many have shown that the seeding rate does not have to be that high if sown properly. I believe in a few cases we may have actually benefited from thinning the stand. However if you were planting 2.5 lbs seed per acre a small loss of stand may be a bigger yield loss. This is one of the question we will have to answer in the future.
And finally it should be noted that canola is planted on a wide range of spaces 6″,7.5″, 12″, 15″, 30″ are some of the most common. As the row width changes the amount of N placed with the seed changes. In other words if the goal is 50 lbs DAP per acre you will put twice as much in a 15″ row than you do a 7.5″ row. The Table at the bottom provide a guide for equivalent rate based on 15″ rows. For example if your target a excepted stand loss of 25% (5 lbs N according to the Figure) but you are planting on 6″ row spacing the recommendation would be apply no more than 13 lbs N per ac in the row or 72 lbs DAP/ac (13/.18)

Impact of DAP (18-46-0) placed in-row on canola stand in terms of lbs N ac-1.

Equivalent amount of N based on 15″ row spacing.
