Update to the delayed nitrogen study.
Joao Bigatao Souza, PhD. Student Precision Nutrient Management|
Brian Arnall Precision Nutrient Management Extension Specialist.
Due to the surprising results seen from the delayed N study that was first reported below we repeated the the study for a third year at two locations, the Lake Carl Blackwell Research farm near Perry OK and the Ballagh Research Farm near Newkirk OK. Due to the excessive rain fall the wheat was planted and trials established later than normal and a cool winter and spring and winter the crop green up (end of dormancy) was delayed compared with the two first cropping seasons. For this season we started applications before visual symptom difference between the N-rich Strip (pre-plant) and the rest of the field actually occurred. This can be seen with the pre-plant dates of late Oct-Early Nov and the notation of visual difference above the yield bars. Just as the other two previously crop years, the timing of the application did impact wheat yield and protein. In this season at LCB we see a increase in yield with application of N during the first part of March compared to the preplant with yields dropping off below the preplant when N was applied in mid April. At the Ballagh farm there is no yield benefit from delaying N after preplant but there was steady increase in protein, again at this location yield is lost when N was delayed past mid April. In both of these locations mid April was after the growth stage of Feekes 7. After three cropping seasons with some extremely different weather patterns we saw that in this work, pre-plant N was never better than in-season N applied prior to mid April, Feekes 7. In most cases N applied in-season yields and protein values were greater than that of the pre-plant treatment. My take home message from this project is multi fold; First, pre-plant may be cheaper and easier but it often falls short of in-season applications, Second that there should be no reason to rush putting top-dress nitrogen on. The application window is much wider than most ever expected and the closer we get to peak demand the better the yield and quality will likely be. And third, and final make the application of nitrogen when the conditions are the most conducive to getting the N in the ground and limiting losses.
Note: This trial used ammonium nitrate as its N source to evaluate the plants response and remove potential fertilizer efficiency problems. However while these trials were being conducted mirror studies using Urea as the N source were also being conducted. Those results are currently being compiled right now and we hope to share the results soon.

Grain yield and protein results from the delayed nitrogen study preformed at the Lake Carl Blackwell near Perry in 2018-2019. 11/7/2018 was the pre-plant application date.

Grain yield and protein results from the delayed nitrogen study preformed at the Ballagh research farm near Newkirk in 2018-2019. 10/24/2018 was the pre-plant application date.
Questions for comments feel free to contact me via email at b.arnall@okstate.edu
Original Post made Oct 1, 2018
How long can wheat wait for Nitrogen?
Joao Bigatao Souza, PhD. Student Precision Nutrient Management|
Brian Arnall Precision Nutrient Management Extension Specialist.
The N-rich strip method allows wheat producers a greater window of decision making regarding the application of nitrogen (N) fertilizers. Besides having greater accuracy in N rates than standard methods (based on the SBNRC – OSU) also helps to reduce costs in the production system and to preserve the environment avoiding over N applications.
With the experiments performed in the last two crop seasons (2016/18 and 2017/18), we can now be even more accurate with regard to the best application time to increase the N use efficiency by the crop. The objective of our study was to determine the impact of prolonged nitrogen deficiency on winter wheat grain yield and protein. Eight studies were conducted with 11 N application timings in no-till dryland conditions. A pre-plant treatment of 90 lbs ac-1 of N was broadcast applied as ammonium nitrate (AN). We used AN as our source because we wanted to measure the crops ability to recover and eliminate the impact of source efficiencies. When visual symptom differentiation (VSD) was documented between the pre-plant and the non-fertilized check, i.e the N-Rich Strip showed up, top-dress applications were performed every seven growth days (GDD> 0) (https://www.mesonet.org/index.php) until 63 growth days after VSD at all sites. The only N the treatments received where applied according to treatment structure. No preplant N was applied other than trt 1, and all locations had residual N under 15 lbs 0-6” sample.
The first visual response to fertilizer N ranged from November 11 to February 5 (Table 1). The soil can have residual N from the previous season which can supply the subsequent crop in the beginning of the development what makes the wheat not demonstrate any sign of stress in the early season. For example LCB2017 a and b which were located 100 yards apart but under a different point in the crop rotation (LCBa was wheat after wheat and LCBb wheat after canola) had a 30 day difference in date of first N response. This range in first and last dates allowed us to evaluate N application over a wide range of dates and determine whether the first sign of stress is actually the best indicator of top dress application timing.
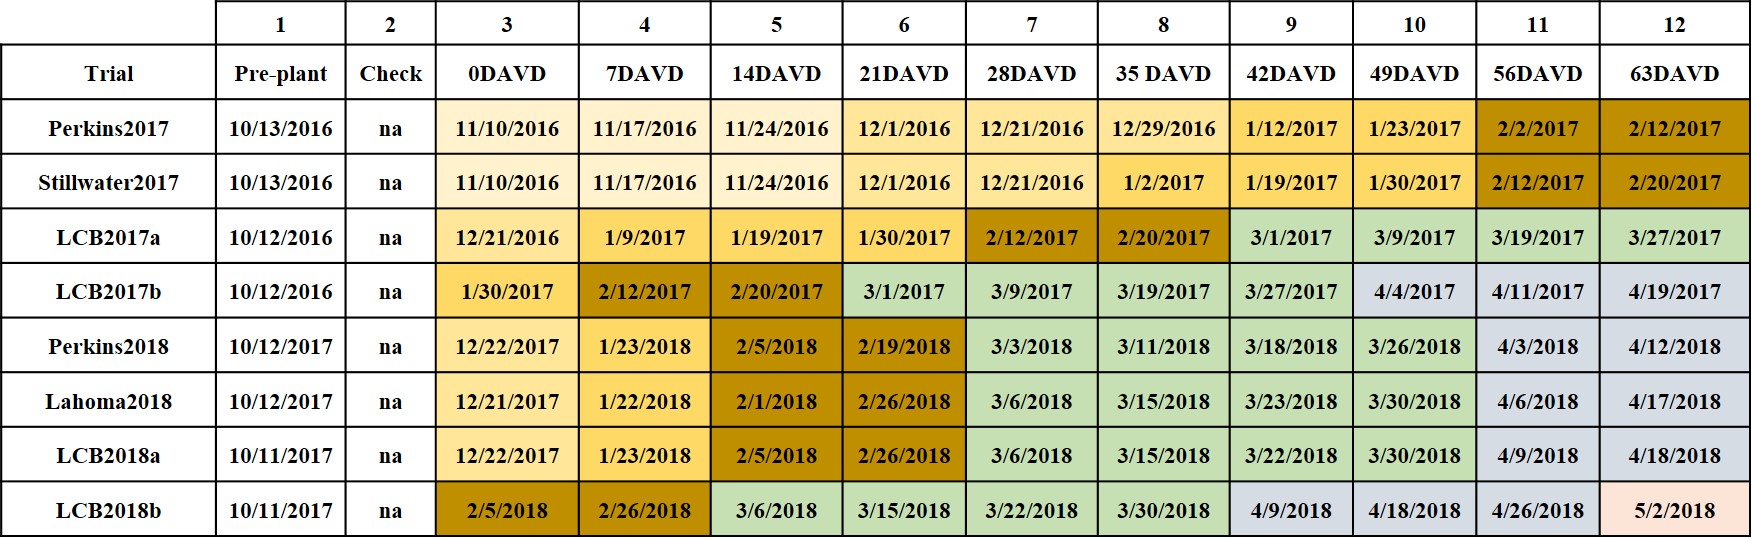
Table 1 shows the planting date, date of first visual difference (0DAVD) and each of the application dates for all locations. Different colors represent individual months. Hollow stem occurred approximately Feb 20 in the 2017 crop and March 10th in the 18 crop.

Image of the 2016-17 Perkins location. Image collected March 21 2017.
As shown in the Tables 2 and 3 below only three of the 78 comparisons made back to the pre-plant application were significantly less in terms of grain yield. All three of these comparisons where from when N application was delayed until late March or April. When the delayed applications were compared to 0DAVD yields only two of the 68 comparisons showed a significant decrease on yield. One was the pre-plant application for LCB2017a while the other were the 63DAVD application for LCB2017b. In most locations applications made in March yields were at the highest point, however when delayed till April yield trends on the downward trend. The 2017 crop reached hollow stem (Feekes 6) around Feb 20th while the 2018 crop reached hollow stem around March 10th.
Grain protein concentration was decreased only once when compared to both the pre-plant and 0DAVD treatments. This one timing, LCB2018b 64DAVD, was the only application made in May. During this time the crop was in the early stages of grain-fill. In all locations delaying N application until February/March increased grain protein content above the check, and in most cases above the 0DAVD trt.

Tables 2-3 shows the winter wheat grain yield and protein concentration, respectively, of all treatments. The colors of the cells represent statistical difference from the Pre-plant treatment. Treatments with cells shaded yellow are equal to the pre-plant, Green is statistically greater than while red is statistically less than the pre-plant treatment.

2016-2017 Delayed nitrogen winter wheat grain yield and protein results. For the locations of Perkins and N40 the Dec-1 application has a higher yield due to a 2x application of N to equal 180 lbs.

2017-2018 Delayed nitrogen winter wheat grain yield and protein results. The Perkins location in 18 was the only location in the study which did not have a statistically significant response to added N.
All the data was combined and plotted by cumulative GDD’s>0 from planting (GDDFP) across all locations to determine a general “best” timing. Using the pre-plant application yield as a base there was no yield loss if the applications was made prior to the 143 GDDFP. When the results were normalized by 0DAVD N there was no yield loss if the applications were made prior to 130 GDDFP. The quadratic model created provides the opportunity to identify the point of highest grain yield, which was approximately 94 GDDFP. In terms of the relationship between the application of N based on GDDFP and % of protein content on the grain, a linear response of N delay application observed for grain protein concentration. Our results suggest that the later the application, the higher the protein % in the grains.

Growing degree days > 0 from planting and equivalent calendar days for all experimental sites (Lake Carl Blackwell, Perkins, Lahoma, Stillwater) utilized in the study evaluating the impact nitrogen fertilizer timing on winter wheat, conducted in north central Oklahoma over the 2016-2017 and 2017-2018 winter wheat growing seasons.
We have concurrent work looking at similar approaches with other sources of N such as Urea and UAN. While all of these studies are being continued the past two years of work have presented some easy take homes.
First: Timing of N application does matter, but yellow wheat does not necessarily mean yield loss.
Second: Two years in a row ALL Nitrogen could be delayed until hollow stem without yield Loss, in fact yields of trts with N applied at this time typically better than that of the pre-plant.
Third: Protein content increased as N applications was delayed.
Fourth: The conclusions of this and other studies support that N-Rich Strip concept does not increase risk of lost yield.
Fifth: Applying the majority of the N at or just after hollow stem maximized grain yield and protein with a single shot.
Sixth and Final: Be more concerned about applying N in an environment conducive to increased utilization and less about applying at the first sign of N stress. Take a look at the wheat N uptake curve by K-State.The crop really doesnt get going in terms of N-uptake until jointing i.e. hollow Stem.

Wheat N-uptake. Figure adapted from Lollato et al.
Questions for comments feel free to contact me via email at b.arnall@okstate.edu

[…] it significantly increase yield and protein. This data is falling in line with the grain only data (How late can you wait) showing that an application of N at Feekes 6 (Hollow stem) and even shortly after can provide […]
[…] team is the evaluation of fertilizer timing. Mr. Souza’s research shared in the blog post How Long Can You Wait has shown, with three years of data, that if fertilizer application is delayed until in-season, not […]
[…] Learn more about how late you can wait with this OSU delayed nitrogen study. […]
[…] Our delayed N work over the past several years show that we have maintained the yield on our trials even when fertilizer was delayed into the first week of April. https://osunpk.com/2019/08/14/how-long-can-wheat-wait-for-nitrogen-one-more-year-of-data/ […]
[…] https://osunpk.com/2019/08/14/how-long-can-wheat-wait-for-nitrogen-one-more-year-of-data/ https://osunpk.com/2021/09/21/split-n-application-pays-in-graze-out-wheat/ https://osunpk.com/2020/09/10/value-of-in-season-application-for-grain-only-wheat-production/ […]