Home » Posts tagged 'Canola'
Tag Archives: Canola

Green Peach Aphids Are Showing Up in Oklahoma Canola
Ashleigh Faris, Cropping Systems Extension Entomologist
Josh Lofton, Cropping Systems Extension Agronomist
Recent reports from growers in north central Oklahoma indicate increased green peach aphid activity in winter canola. Although green peach aphid is often overshadowed by cabbage aphid and turnip aphid, it can cause significant damage through direct feeding and by transmitting plant viruses. Given current field reports and ongoing dry conditions, producers should scout fields now and determine whether treatment thresholds have been reached.
Green Peach Aphid Identification
Accurate identification is the first step in management because green peach aphid behaves differently than other aphid species and is often more resistant to certain insecticides.
Appearance: Green peach aphids are small, about 1.5 to 2.5 mm long, and vary in color from pale green to yellow or pinkish. Unlike cabbage aphids, they do not have a thick, waxy or powdery covering. One of the most important identifying features is the presence of prominent swellings at the base of the antennae, that point inward and create a distinct “W” or “U” shape between the antennae (Figure 1). Their cornicles (tailpipes) are relatively long and usually match body color, although the tips may appear slightly darker.
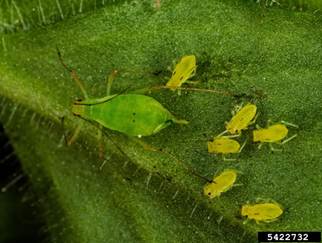
Figure 1. Green peach aphid adult and nymphs. Image courtesy invasive.org.
Differentiating Green Peach Aphid from Other Aphid Species
Cabbage aphids are typically covered in a grayish-white waxy bloom (Figure 2) and often form dense, crusty colonies on the youngest leaves and flower stalks. Turnip aphids are light green and lack the waxy bloom seen on cabbage aphids. They often have dark bands across the abdomen (Figure 3).
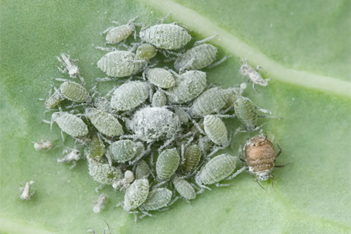
Figure 2. Cabbage aphid adults and nymphs. The brown, globular aphid in the bottom right has been parasitized (aphid mummy). Image courtesy biologicalservices.com/au.
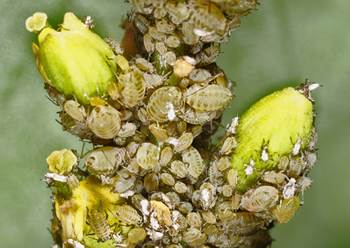
Figure 3. Turnip aphid adults and nymphs. Image courtesy Claude Pilon.
Green Peach Aphid Scouting and Distribution
Green peach aphids typically colonize the undersides of lower leaves first. This differs from cabbage aphids, which more often infest terminal buds and flower stalks.
Where to look: Focus on the undersides of leaves in the mid- to lower canopy. Green peach aphids are often solitary or found in small, scattered groups rather than the large, tight colonies commonly associated with cabbage aphids.
Sampling: Examine 5 to 10 plants in at least 10 different areas of the field.
Signs of injury: Watch for yellowing (chlorosis), leaf curling, or stunted growth, which are common symptoms of green peach aphids feeding.
Green Peach Aphid Management and Thresholds
Because canola can compensate for some early-season feeding injury, insecticide applications should be based on established thresholds.
Economic threshold: Treatment is generally recommended when populations reach 50 to 100 aphids per plant before flowering. Use the lower end of that range when the crop is moisture stressed. From budding to early bloom, treatment may be justified when 20% of racemes are infested with 25 to 50 or more aphids. For cabbage aphid, the comparable threshold is 15% infested racemes. Oklahoma State University research suggests that an average of one turnip aphid or one green peach aphid per plant during reproductive stages may result in approximately 0.5 lb/acre of yield loss. Treatment decisions should always be weighed against crop value and application cost.
Biological control: Before spraying, check for beneficial insects such as lady beetles, lacewings, and parasitic wasps. Aphid mummies are a good indicator of parasitism. When temperatures are warm enough for beneficials to remain active, they can substantially reduce aphid populations.
Chemical Control for Green Peach Aphid and Resistance Warning
Green peach aphids are well known for developing resistance to several insecticide classes, especially older pyrethroids and organophosphates.
Product Selection: Several insecticides are labeled for aphids in canola, but products containing sulfoxaflor (Transform WG) or flupyradifurone (Sivanto Prime) have generally shown strong efficacy against green peach aphid while being relatively less disruptive to beneficial insects. Be aware that some products have restrictions related to bloom timing, petal fall, and preharvest intervals. Always read and follow the label. For a list of registered insecticides and rates, refer to CR-7667: Management of Insect and Mite Pests in Canola.
Coverage: Because green peach aphid commonly feeds on the undersides of lower leaves, thorough coverage is critical. Use high carrier volumes of at least 10 to 15 gallons per acre for ground applications. For aerial applications, at least 10 gallons per acre is recommended.
The information given herein is for educational purposes only. Reference to commercial products or trade names is made with the understanding that no discrimination is intended and no endorsement by the Cooperative Extension Service is implied.

2015-16 Wheat Crop Nitrogen Review
From trials to phone calls (and text messages, and tweets, and ect. ect) I have gathered a fairly good picture of this years winter wheat nitrogen story. And as normal, nothing was normal. Overall I seen/heard three distinct trends 1) Did not take much to make a lot 2) took a ton to make a lot 3) saw a response (N-rich strip or cow-pow) but fertilizer never kicked in. Covers most of the options, doesn’t it.
The N-rich strips really came out over all very good this year. N-Rich Strip Blog. On average many of those using the N-Rich Strip and SBNRC (SBNRC Blog) producers have been getting in the neighborhood of 1.0-1.3 lbs of N applied per bushel produced. This year the numbers ran from 0.66 to 2.3 lbs of N per bushel. In both extremes I believe it can be explained via the field history and the N-Cycle.
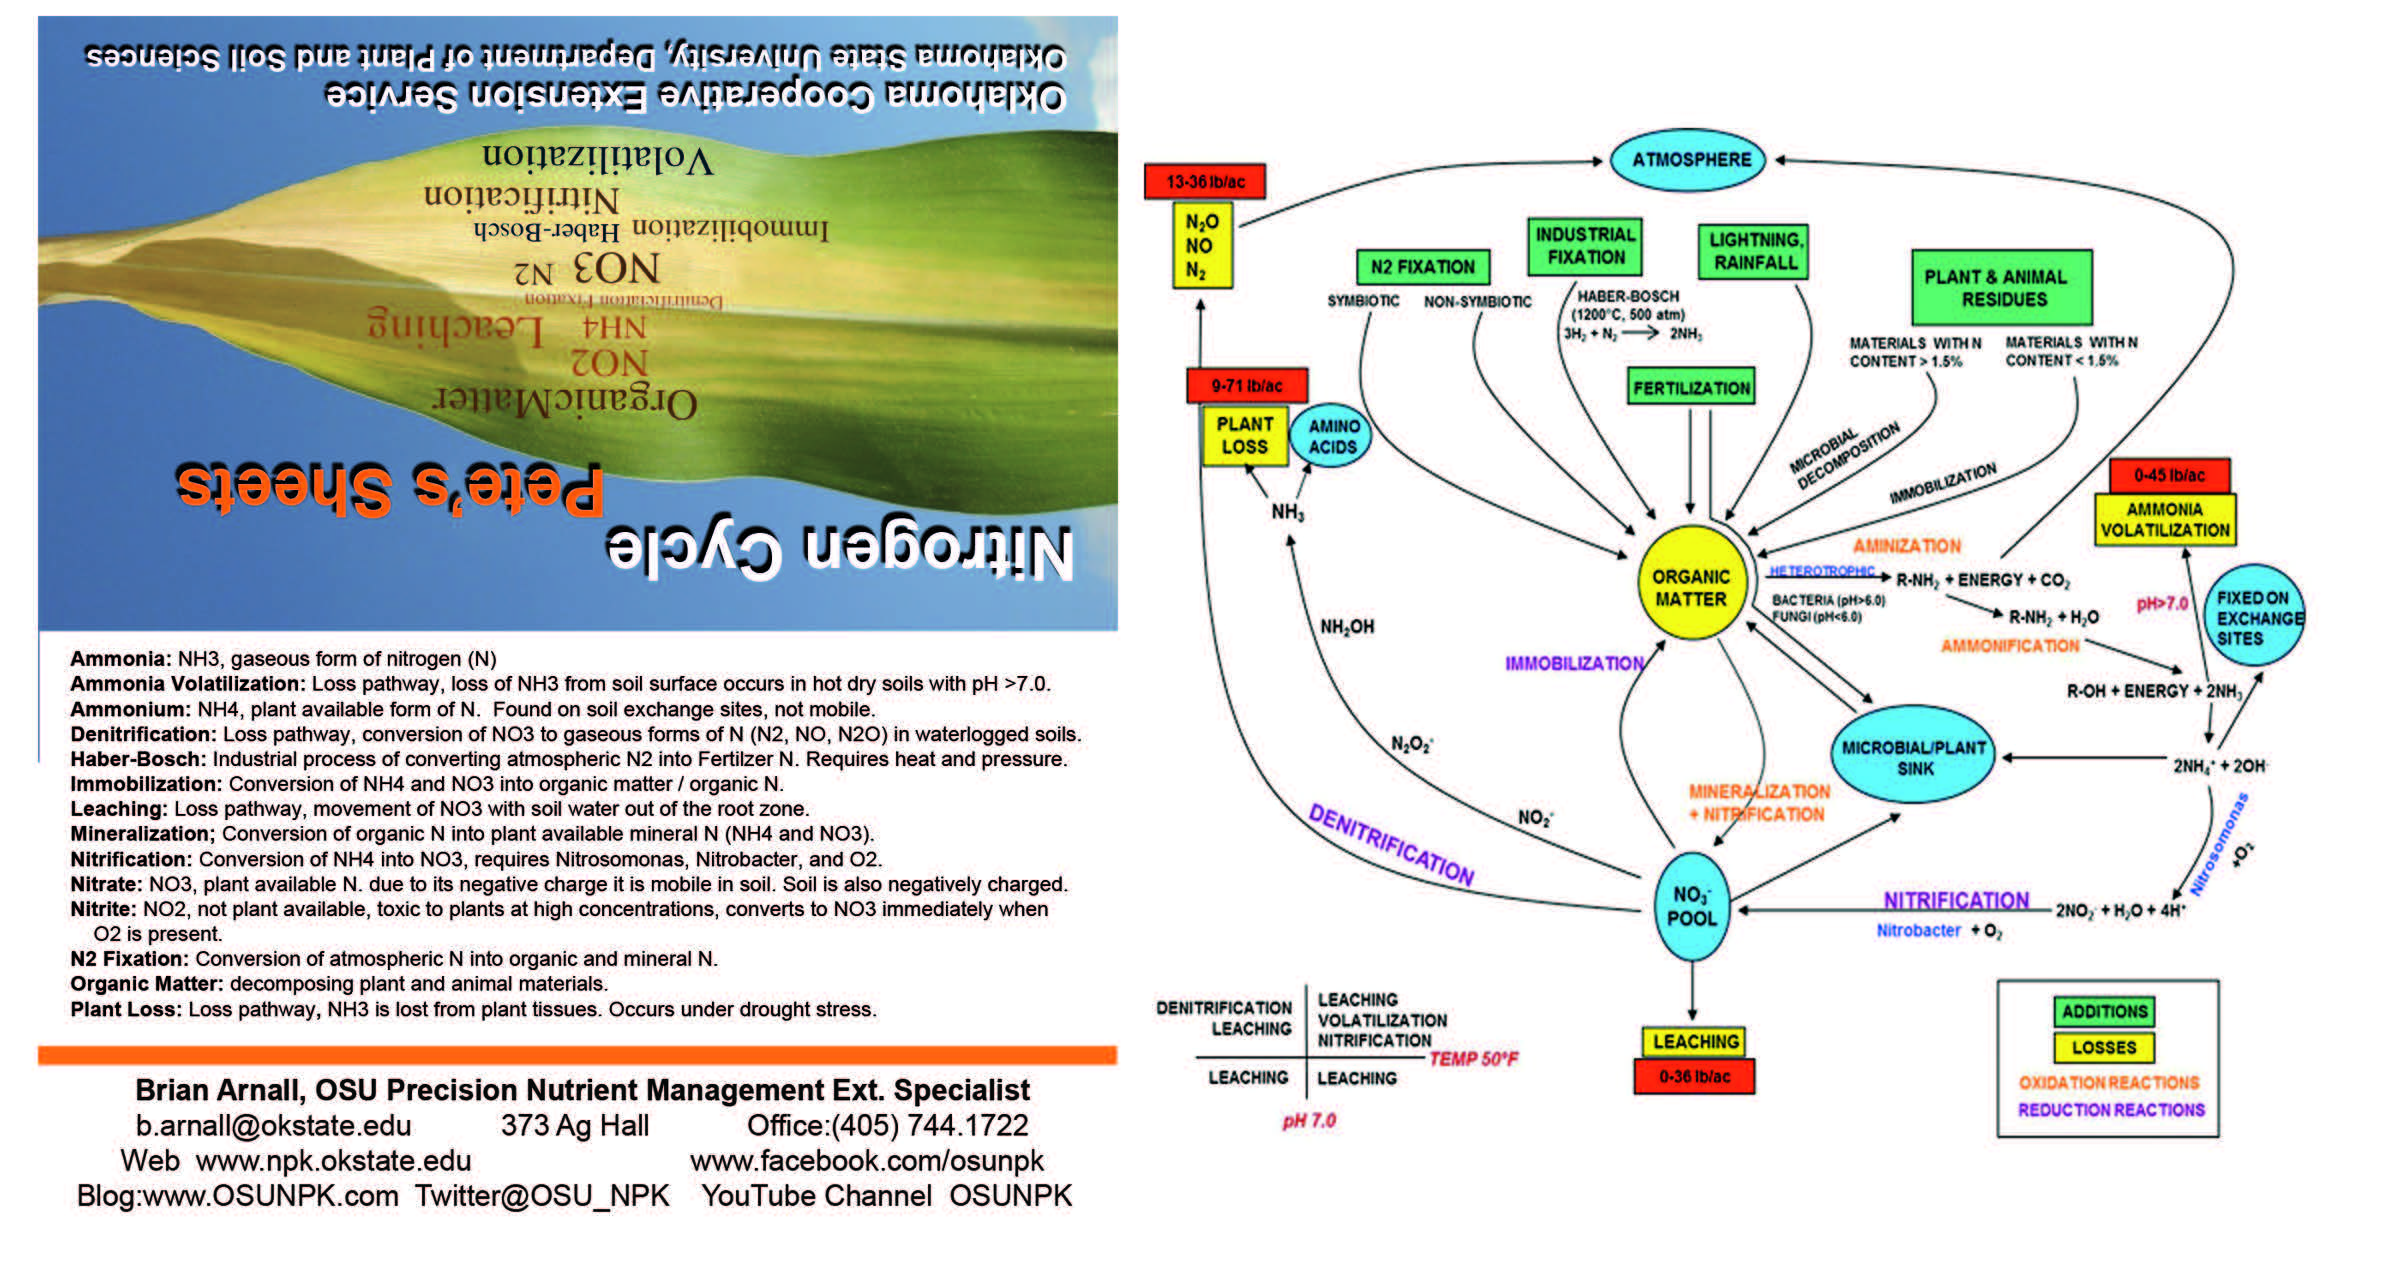
Nitrogen Cycle Pete’s Sheet
In at least two fields, documented with calibrated yield monitors, the N-Rich Strip and SBNRC lead to massive yields on limited N. One quarter of IBA bumped 86 bpa average on 47 lbs of N while a second quarter, also IBA, managed 94 bpa average on about 52 units of N. We are currently running grain samples from these fields to look protein levels.
The other side of the boat were those with N-Rich strip calling for +2.0 lbs N per bushel. I had received notes from producers without N-rich strips saying that they could predict yield based on the amount of N applied and it was a 2 to 1 ratio. Not always but many of these high N demand fields where wheat following a summer or double crop or corn or sorghum. While many of the low N demand fields were wheat after wheat or wheat after canola. In a rotational study that had been first implemented in the 2014-15 crop year I saw big differences due to previous crop. The picture below was taken in early March. The straw residue in wheat after wheat had just sucked up the nitrogen. While it was evident the residue from the canola broke down at a much more rapid pace releasing any and all residual nutrients early.

The yield differences were striking. The canola rotation benefited the un-fertilized plots by 22 bpa and even with 90 lbs of N applied having canola in the rotation increased yields by 12 bpa. We are looking and grain quality and residual soil sample now. I am sure there will be a more indepth blog to follow.

Canola Wheat Rotation study year two yield average. yields average across previous years N-rates.
Another BIG story from the 2015-16 wheat crop was the lack of benefit from any N applied pre-plant. It really took top-dress N this year to make a crop. Due to our wet early fall and prolong cold winter N applied pre was either lost or tied up late. Work by Dr. Ruans Soil Fertility Program really documented the lack luster pre-plant N effect. The figure below shows 4 location of a rate by timing student. The number at the bottom of each graph is a rate by time (30/0 means 30 lbs Pre-0 lbs Top, 60/30 means 60 lbs Pre-30 lbs Top). At every single location 0/60 beat 60/0. Top-dress N was better than Pre-plant N.
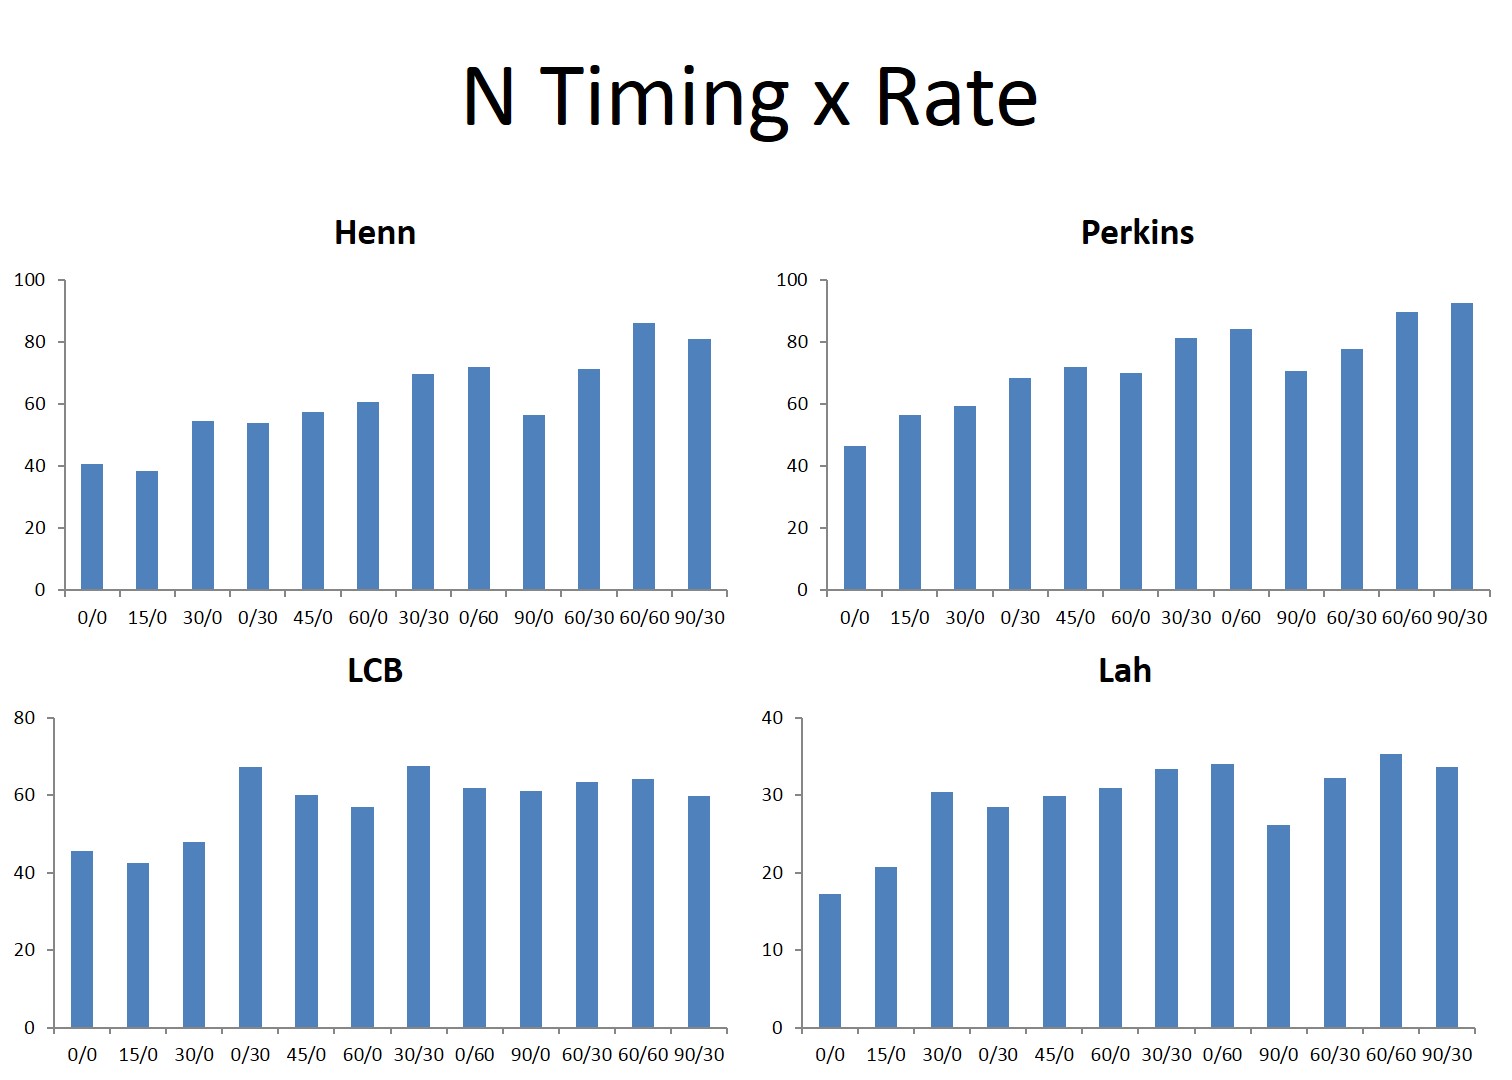
Figure 1. Work from Ethan Driver and Dr. Bill Raun. Study looked at rate and timing of N fertilization in wheat. Treatments are ordered by total N applied.
The last observation was lack of response from applied N even though the crop was deficient. Seen this in both the NE and NW corners. I would hazard with most of the circumstance it was due to a tie up of applied N by the previous crops residue. The length at which the winter stretched into spring residue break down was also delayed.
Take Home
Here it is folks APPLY NITROGEN RICH STRIPS. Just do it, 18 years of research preformed in Oklahoma on winter wheat says it works. Hold off on heavy pre-plant N even if anhydrous is cheap. It does matter how cheap it is if it doesn’t make it to the crop. Will we see another year like 2015-16, do not know and not willing to place money on either side. What we do know is in Oklahoma split applying nitrogen allows you to take weather into account and the N-Rich strip pays dividends.
There are several fact sheets available on top-dressing N and the application of N-Rich strips. Contact your local Oklahoma Cooperative Extension Service county educator to get a copy and see if they have a GreenSeeker sensor on hand.
Check Canola for Aphids
Tom A. Royer, Extension Entomologist
I have received scattered reports of cabbage aphids infesting canola racemes and low levels of green peach aphids feeding on canola leaves. Cabbage aphids are small, 2.0-2.5 mm (1/12 inches) blue-gray aphids with short cornicles. They are usually covered with a powdery wax coating. They are often found clustering on the developing panicle (Figure 1). They can cause plant stunting, distortion of growth, and flower abortion.
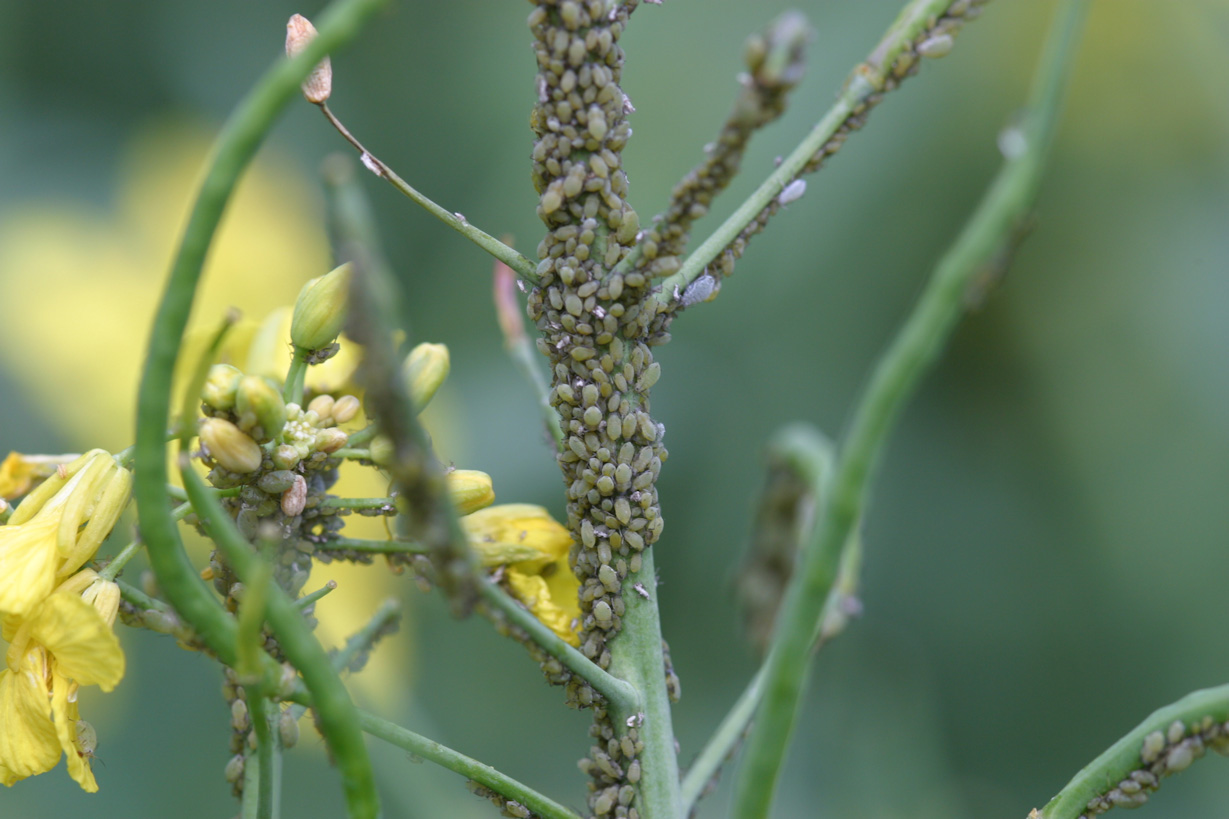
Cabbage Aphids
Green peach aphids are pale green to yellow (and sometimes pink) with long cornicles and antennae and measure 1/8 inch. They are found in winter and spring on leaves (Figure 2). Their feeding can cause stunting and defoliation. They can also transmit plant disease-causing viruses such as cauliflower mosaic and turnip mosaic viruses.

Green Peach Aphids
Scout for aphids by looking on the underside of the leaves, and racemes. For cabbage aphids, research conducted in Australia suggests that an insecticide application is justified if 20% of the racemes are infested with cabbage aphids.
")

For green peach aphids, research conducted by Dr. Kris Giles at OSU found that and average of one green peach aphid per plant can reduce seed yield by about 0.5 lb per acre. Thus, if the cost of an application is $10 per acre, and canola is bringing $0.2 per pound (quote from ADM Farmer Services 04/08/2016 www.adm.com), an infestation of 100 aphids per plant would cause yield loss of $10.00 (50 lb, x $0.2/pound) which is equal to the cost of the application. This is known as the ECONOMIC INJURY LEVEL (EIL). We typically set the ECONOMIC THRESHOLD (ET) below the EIL, in this case at 80% of the EIL (80 aphids per plant) to give time to schedule an application before the EIL is reached. Below is a set of suggested ECONOMIC THRESHOLDS, based on the cost of the application.
Application Cost Economic Injury Level Economic Threshold (Application cost/
0.5 lb/aphid x $0.2/lb (0.8 x EIL)
$8.00/acre 80 aphids/plant 64 aphids/plant\
$10.00/acre 100 aphids/plant 80 aphids/plant
$12.00/acre 120 aphids/plant 98 aphids/plant
$14.00/acre 140 aphids/plant 112 aphids/plant
Current recommendations for control of aphids in canola are listed in CR-7667, Management of Insect and Mite Pests in Canola which can be obtained online at http://pods.dasnr.okstate.edu/docushare/dsweb/Get/Document-3045/CR-7667web2009.pdf.
Transform® insecticide is no longer registered for use in canola as of November 11, 2015. Only existing stocks that have already been purchased and delivered to the grower before the cancellation can be applied according to the label.
Remember, green peach aphids have a history of developing resistance to pyrethroids, which are the primary registered insecticides for use in canola. Thorough coverage of an insecticide application is necessary to obtain optimal control.
If you notice natural enemy activity, especially lady beetles, and want to preserve their activity, keep several things in mind. Our research shows that Beleaf® insecticide is particularly benign to natural enemies because of its slow acting efficacy on aphids, which allows aphid-feeding beneficials to continue to eat them with little to no consequence on their biology. That being said, cabbage aphid may contain toxins that they acquire through their feeding which make them less palatable to some predators, and reduces their effectiveness as natural controls.
With all pesticides, review label restrictions for applications during bloom, as honeybees can be killed if exposed to several of the registered products. One registered product, Beleaf® (FMC Corporation) does not have any restrictions for application during bloom.
Herbicide and UAN tank mixed for top-dress
Spring is the time that many wheat producers apply herbicide and nitrogen (N) fertilizer. For many this can be accomplished in a single pass by tank mixing the herbicide and UAN. In most cases this is an effective practice which eliminates one pass over the field. There are some scenarios in which this practice is ill advised. One such scenario is high temperatures which would lead to excessive leaf burn and crop damage. The other scenario is no-till and that will be the focus of this article. Ruling out warm temperature tank mixing herbicides and nitrogen, assuming the herbicide can be tank mixed, is a good practice. No-till on the other hand can be a different issue.

Situations with a lot of residue and smaller wheat is common during top-dress.
The problem in no-till comes from the liquid application method needed to apply herbicides, flat flan. To get a good kill with the herbicide the spray pattern needs to have good coverage, i.e a lot of small droplets to ensure maximum surface area impacted. Unfortunately there are four primary fates of UAN when applied via flat fan nozzles. The UAN could be taken directly up into the wheat plant via absorption through the leaves, the UAN could reach the soil and go into the soil solution or absorbed onto the soil itself, the UAN can be taken up by weeds, or the UAN droplet may hit dead plant tissue and be adsorbed into the residue.

UAN applied with a flat fan will hit a growing plant, the soil, or residue.
The fourth fate of UAN presented is what can make the tank mix less efficient than a two pass system. In a no-till system any UAN that hits residue should be counted as lost, for the short term. The decision to go with a one pass or two pass system can be aided by evaluating the amount of canopy coverage. For example if the no-till field has 50% canopy coverage then one could estimate 50% of the UAN applied via a one pass system would be tied up in the residue. The cost of a second application could then be compared to the lost N. If 15 gallon of 28-0-0 was being applied then approximately 22.5 lbs of N would be tied up by the straw. At a price of $0.40 per lb on N, that is $9.00 worth of N. Conversely if the canopy coverage was 80% only 20% or 9 lbs of N would be tied up in the residue. Saving the $3.60 in nitrogen would not justify a second trip over the field. Luckily OSU recently released the Canopeo app which uses a cell phones camera to take pictures and quickly and accurately determine % canopy coverage. Canopeo is available for iOS and android http://canopeoapp.com/.


In fields with a high amount of residue or limited canopy coverage UAN should be applied with streamer nozzles. This will concentration the fertilizer into streams which will allow the UAN to have enough volume to move off the residue and into the soil.


So as the decision is being made to tank mix herbicide and UAN or make two passes take into consideration: % canopy coverage, rate of UAN (how much could be lost), cost of UAN per pound, and cost of a second trip over the field.
Below is an excerpt from the publication Best Management Practices for Nitrogen Fertilizer in Missouri; Peter C. Scharf and John A. Lory. http://plantsci.missouri.edu/nutrientmanagement/nitrogen/practices.htm
Broadcasting UAN solution (28 percent to 32 percent N) is not recommended when residue levels are high because of the potential for the N in the droplets to become tied up on the residue. Dribbling the solution in a surface band will reduce tie-up on residue, and knife or coulter injection will eliminate it. Limited research suggests that the same conclusions probably apply for grass hay or pasture. Broadcast UAN solution is also susceptible to volatile loss of N to the air in the same way as urea, but only half as much will be lost (half of the N in UAN solution is in the urea form).


Canola fertilizer rates when skip row seeding.
When drilling canola a common strategy to improve seeding rate accuracy is to only use every other row which effectively doubles the rate of seed going through each meter. There are also many producers who utilize air seeders and just prefer the wider spacing. Every season I get several questions about determining total fertilizer rates if the seed is dropped every other row but fertilizer is dropped every row. Regardless of whether or not fertilizer goes down every row it is important that the amount of salts placed with seed does not exceed the limit. The table below provide the limits in terms of lbs of salt per acre. If using 18-46-0 (DAP) or 11-52-0 (MAP) this is equivalent to pounds of N per acre. However if the fertilizer you use contains potassium (K) or sulfur (S), those have to be considered. An easy rule of thumb for determining total salt level of a fertilizer is pounds of N + K + 1/2 S.

Maximum amount of salt that can be applied in furrow with canola seed. Application rate should be at or below this value.
In a scenario in which canola is seeded in skip rows but every row will get fertilizer the total amount of fertilizer can be doubled. For example on a 15″ row spacing the max salt rate is 5 lbs per acre. If you were using DAP as your starter that maximum rate to place in furrow would be 28 lbs of DAP per acre. If using a drill set of 7.5″ spacing and putting fertilizer down every row the max rate would increase up to 56 lbs DAP per acre.

Seed, colored blue, is placed in every other row while an equal amount of fertilizer, dark grey circles, is placed in every row.
Some producers may have the capability of applying different rate in every other row. In this scenario it is important to maintain that safe rate in the seed furrow. In the opposite row, fertilizer rate can go as high as you wish or the equipment can handle.
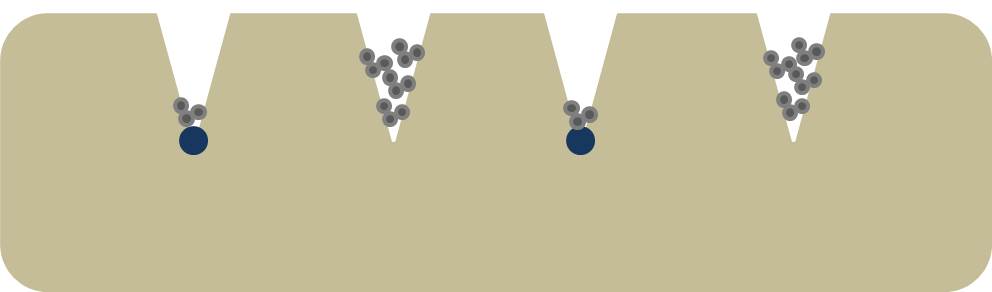
Seed, colored blue, is placed in every other row while fertilizer, dark grey circles, is placed in every row. In this scenario a high rate is placed in the row without seed.
Now the big question is, “Is between row fertilization a good idea?” While we do not have results on this style of application (trials will be going out this year) we can draw upon upon similar work in other crops. For me the best win would be the second scenario in which a higher rate could be place between the rows. In this row I would use a urea and DAP blend. Any time we can put urea below the soil surface its a win and in fields with very soil soil test phosphorus (P) it would create something similar to the deep P bands once popular in corn production. Now if the field had adequate soil test P, I would focus on urea between rows. Keep in mind it is never a good to place urea in furrow with canola seed. For the average producer who is using a box drill the first scenario is the only option. In this case the rate of the between row bands will be reduced however I still believe on fields with very low soil test P this is potentially a great way to get the rest of it on. Remember if on 15″ and using DAP max rate only gets 12.9 lbs of P2O5 down. If fertilizer is dropped down every tube that number increases to about 26 lbs P2O5, which is still not enough for fields with low soil test P, but is better. With hope we will have some good results to share from the 2015-2016 canola crop.
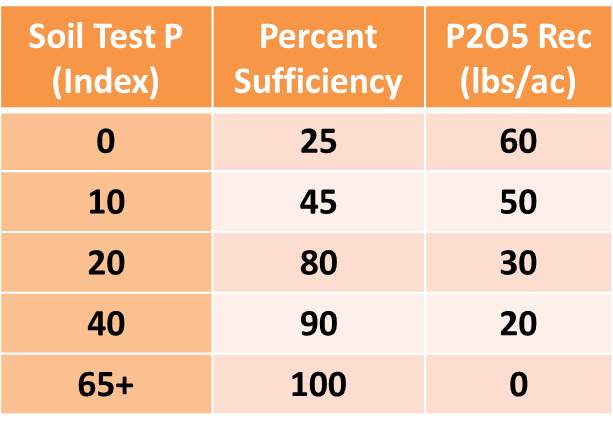
Phosphorus fertilizer recommendations based upon Mehlich 3 P test, reported as STP index (ppm * 2)
Canola Planting Considerations.
Pre- and Early-Season Weed Management-
Dr. Angela Post- Small Grains Extension Weed Scientist
Winter canola is an excellent rotational partner with wheat. Integrating canola into a wheat system allows for the cleanup of weedy fields with primarily grassy weed problems. Conventional and Roundup Ready (RR) varieties are excellent choices for managing most grassy weeds including ALS-resistant populations, because grass-only herbicide options can be used in canola without crop injury. For specific grasses that are very difficult to control, like cereal rye and jointed goatgrass, it is advisable to use canola in year one of your rotation and Clearfield wheat in the second year of your rotation before going back to conventional wheat varieties. Due to sensitivity of canola, Clearfield wheat varieties should not be used the year prior to rotating into canola.
Canola planting time is just around the corner and many are going out now with preplant burndown applications. Remember that canola is sensitive to dicamba, 2,4-D, and MCPA and these products should not be used inside of 30 days before planting. Glyphosate, glufosinate and paraquat are all potential options for removing broadleaf weeds in no-till systems prior to planting. These products have no planting restriction for canola. Tillage is the best option to remove weeds in conventionally tilled systems.
It is important to consider your previous herbicide choices when planning for canola in the fall. Many herbicides used for spring weed control in wheat can limit rotation to winter canola. These include all Group 2 herbicides all of which have long rotation restrictions to canola, meaning you cannot plant canola in these fields for 18-24 months depending on the product. See Table 1 for a list of specific restrictions. If you have used one of these products in wheat in the spring, you must plant a canola variety with the SURT trait. Examples of varieties with this trait include: DKW 45-25, DKW 46-15, DKW 47-15, HyClass 115W, HyClass 125W. All of these varieties are also RR. Kansas State also has an open-pollinated non-RR variety called Sumner with the SURT trait for growers that prefer to grow conventional canola. Note that the SURT trait is not a genetically modified trait.
No additional in-season herbicide options have been added to the toolbox for winter canola growers in the upcoming season. Both trifluralin (Treflan) and ethalfluralin (Sonolan) can still be used as preemergent weed control options in canola in conventionally tilled systems. Both need to be mechanically worked into the ground and need an activating rainfall to work properly. Quizalofop (Assure II), sethoxydim (Poast), and clethodim (Select and many generics) are the grass control herbicides available for use in canola and can be used on any canola variety including RR varieties. Roundup Ready canola growers are allowed two applications of glyphosate at 22 oz/A each over the top of the emerged crop. Clopyralid (Stinger) is the only over-the-top broadleaf control option other than glyphosate. These weed control applications should be made early in the season between 2- and 6-leaf canola, and prior to bud formation, while weeds are still very small. Applications should be spaced at least 14 days apart. Early applications will eliminate fall weed competition with canola and protect yield. For more information or questions involving weed management in canola contact Extension Weed Specialist Angela Post at 405-744-9588 and follow @OSUWeedScience.
Table 1. Rotation restrictions for planting canola following wheat. For herbicides
applied in crops other than wheat please refer to the herbicide label.

1Minimum interval between herbicide application and seeding canola. Refer to full herbicide labels for specific information as geography, pH, and rainfall may affect this interval.
2Rotation restriction can be overcome with use of a SURT canola variety.
3Rotation intervals depend on geography.
4Rotation interval depends on herbicide rate.
Pre plant fertilizer concerns with Canola
Dr. Brian Arnall- Precision Nutrient Managment Extension Specialist
When it comes to pre-plant fertility issues with canola, I typically have two soap boxes. But at this point in the canola game we are behind in terms of getting soil samples collected or applying lime and getting a boost at emergence. So assuming pH is good and you know what your soil nutrient level is we can move on to planting. One thing that over the past seven or eight years keeps coming up is the importance of starter fertilizers and the rates and sources used. Getting that little canola plant off to a good start is extremely important however with that little bitty seed a little goes a long way.
The figure below shows the impact of DAP (18-46-0) placed in row, on relative canola stands, when canola was planted in 15” rows. At 5 lbs/A of N or 28 lbs/A of DAP, the canola stand is reduced to 75%. While this seems like a great loss, the compensating nature of canola and the fairly high seeding rates used, this is a manageable level. The benefits of the additional nitrogen and phosphorus applied with the seed also help out-weigh the loss of stand. The addition of the P near the germinating seed is vital. The phosphorus aids in early root and shoot growth, helping the crop to get off to a good start. In areas where soil pH is of concern the P near the young seedling will reduce aluminum toxicity and allow the plant to tolerate the low pH. Keep in mind, while banding P will help in acidic soils, canola is still very sensitive and will not tolerate the same low pH conditions as our winter wheat’s.

Impact of DAP (18-46-0) placed in-row on canola stand in terms of lbs N ac-1.
One very important factor to keep in mind is the impact of the critical rate and row spacing. The 5 lbs of N per acre critical level set for 15” row spacing is increased to 10 lbs on 7.5’s and cut to 2.5 lbs on 30’s. The change in rate is because we use lbs per acre. So if you apply the same amount of material per acre on a 15” spacing and a 30” spacing there is actually twice as much material in the 30” row. Table 1, shows the equivalent amount of N placed in row for popular row spacing’s.

Equivalent amount of N based on 15″ row spacing.
Oklahoma State has released a smart phone app, available for both apple and android devices, to aid in determining maximum in-furrow rates. Canola Starter app provides guidelines based upon the nutrient concentrations of the fertilizers you plan to use. The final note on in-furrow fertilizer with Canola, avoid using urea. The likelihood of injury from the urea converting to ammonia greatly outweighs any potential benefits. For further information, comments, or questions please contact Dr. Brian Arnall Extension Precision Nutrient Specialist 405-744-1722 or following me on Twitter @OSU_NPK.
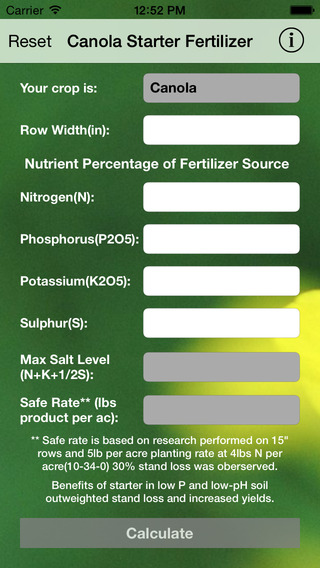
Canola Starter available on iOS and Android. For more information see http://www.dasnr.okstate.edu/apps.
Winter canola planting decisions:
Josh Lofton- Cropping Systems Specialist
Josh Bushong- Extension Associate
Stand establishment is one of the most critical practices in canola planting. This is not only because these stands are highly influential to end of the season yields but because getting the crop up with adequate growth will be critical to give the plants the best over-winter survivability possible. To accomplish this, growers need to make sure they make good field selection and follow good planting practices
Field Selection:
Soil nutrients are a critical aspect. Soil samples should be collected on a regular basis to ensure optimum productivity. Also, ensure recommendations for winter canola are followed, as nutrient recommendations for other crops may be invalid. For more information canola fertilizer management refer to the nutrient management section by Dr. Arnall.
Winter canola grows similar to winter wheat. Fields that can adequately produce wheat have the potential to produce canola. These include, well-drained soils with adequate soil nutrients. However, canola can be more sensitive than wheat. One aspect that canola can be more sensitive to is soil pH. While wheat can be grown in soils as low as 5.5 without significant yield loss, canola must be grown on soils with pHs above 5.8. In fact, canola is best grown in soils with soil pHs ranging from 6.0 to 7.0. Therefore, it is essential that if fields have lower pH, lime be applied with adequate time to neutralize the acidic soil pH before rotating into canola.
In addition to all the soil conditions, crop rotation should be considered prior to planting canola. One of the major hindrances in growing canola in rotation with other crops is herbicide carry-over. For detailed information regarding this aspect, refer to table 1 in the weed management section. To account for this, detailed field records should be kept and consulted before rotating with canola.
Planting Date:
Planting time depends on many aspects. Insured growers should plant within the constrained planting dates. For Oklahoma, the earliest planting date is September 10th with the latest date being October 10th. However, within these guidelines, seedbed and environmental conditions should be the driving factor to determine when to plant. The goal of these planting dates is to have the crop germinate, emerge, and establish 6-8 true leaves prior to the first killing freeze. As a general rule, the crop should be planted 4 to 6 weeks before this freeze. To achieve good establishment of the crop, canola should be planted into firm seedbed with adequate soil moisture. If canola is planted into dry soil (dusted in), the effective planting date will be delayed until adequate conditions for germination and emergence exist. In no-till systems, it is important to remember that canola emergence and growth will be slightly delayed. Therefore, if adequate conditions exist, no-till fields should be planted before similar conventionally tilled fields.

Uneven canola emergence. Canola on left emerged later and did not
have enough time to put on adequate growth (Photo courtesy of Josh
Bushong)
Planting depth, plant spacing, and seeding rate:
Since canola is a small seeded crop, shallow planting is required. For best germination and emergence, seeds should be planted between 0.5 and 1 inch. If adequate moisture is available deeper, planting depth can be increased. However, deeper planting has the potential to decrease germination, percent emergence, and early fall growth, so deeper planting should only be used when the planting condition advantage is present and only on certain soils. Therefore, caution should be used in planting deeper than 1 inch. Furthermore, even though moisture may be present deeper, seeds should not be planted deeper than 1.5 inches.
Oklahoma growers have options when deciding row spacing used for planting canola and depend on what equipment there is available and their production system. Since canola is typically rotated within a winter wheat production system, box drills and air seeders are typically widely available. Row-spacing for these can range from 6 to 15 inches. Row spacing within this range has little impact on final yields. As producers move from drills and air seeders to planters, row spacing typically increases from 15 up to 30 inches. All of the row-widths have the potential to produce adequate canola. Some, however, will be more beneficial than others. Narrow row spacing has the potential to result in early canopy closure, reduce potential weed competition, and may help reduce shatter prior to harvest (especially when direct harvested). Wider spacing, however, allows for some flexibility in specialized planter attachments used, especially row-cleaners, which can be greatly beneficial in no-till systems.
Seeding rates for canola in Oklahoma range from 1 to 5 lbs/A. However, row spacing plays a critical role on seeding rates. When canola is planted on less than 15 inch spacing, some flexibility exists for planting rates. Higher seeding rates can produce more uniform stands, uniform maturity, and thinner stalks that can greatly help harvest efficiency. Too high of stands can increase disease incidence, winterkill, and lodging. When row spacing is increased beyond 15 inches, care should be taken not to over seed. High seed populations can increase fall growth and potentially increase hypocotyl height, which in turn can lead to high winterkill. Optimum populations for this wider row spacing typically range from 2 to 3 lbs/A.
For further information, comments, or questions please contact Josh Lofton Extension Cropping Systems Specialist at 405-744-3389 or follow me on Twitter @OSU_oilseeds.
While producers have faced many challenges over the last couple of seasons in Oklahoma agriculture, the outlook for winter canola looks very promising for the upcoming season. Producers should focus on taking all of the right steps to ensure the 2015-2016 crop starts on the right foot and takes full advantage of the promising conditions this season. Good luck to everyone one on their upcoming production season and if anyone from Oklahoma State extension can help or assist in any way, please feel free to contact.
2013 Wheat and Canola preplant soil test results
Every few years I request the results of all soil samples submitted to OSU Soil, Water, & Forage Analytical Labs (www.soiltesting.okstate.edu) under the crop codes of winter wheat and winter canola. Within this data set I can look at trends occurring across the state over time. In this report I will focus on the 2013 results but make some comparison with the 2011 sample values.
As it pertains to mobile nutrients such as N, S, and B there is little that can be applied from the previous year’s soil samples because their levels in the soil change rapidly. Samples must be collected every year to determine the current status. However the soil test levels of immobile nutrients, P, K, Mg, ect are relatively stable over time and the recommendation is to take a close look at these values every three to five years.
In 2013 the number of sample submitted increase. There were nearly 1000 more wheat soil samples (2733 to 3574) and 200 more canola soil samples (33 to 231). If the distribution of nutrient levels of the two years are compared the only significant change is that the soil test NO3 level was significantly lower in 2013 (Tables 1 and 2). This is attributed to the extremely dry 2012 spring and summer which delayed the breakdown of wheat straw and immobilization of residual N.

Table 1 and 2. Summary from all samples submitted to SWFAL under the wheat and canola crop codes in 2001 and 2013.
Reviewing the 2013 values the most concerning aspect is that 72% of the 3800+ soils samples had a Mehlich 3 P value below optimum soil test phosphorus (STP) of 65 (Figures 1 and 2). That adds up to 109,000 acres needing phosphorus, if you assume each sample represents 40 acres. There is no way to determine how much P2O5 if any was applied to these particular fields. However, an estimated impact of not fertilizing can be calculated. Based on the Oklahoma typical average yield of just below 40 bpa, it would cost the state approximately 575,000 bushels if the land went unfertilized. At $5.00 a bushel that is $2.8 million in revenue. To remedy the low STP it would take approximately 2.76 million lbs P2O5 at a cost of $1.5 million ($0.50 per lb).
In the NPKS response study wheat fields across the state were evaluated for a response to additional (in addition to producer’s standard practice) nitrogen, phosphorus, potassium, and sulfur. Phosphorus was the most limiting nutrient at 7 of the 59 harvest locations. A response to P occurred more often than any of the other nutrients tested. It is important to note at all seven fields had been fertilized with P that season, however each time it was below the OSU recommended rate. The response study was a great reminder that it is important to have a good soil test and to follow the recommendations.

Figures 1 and 2. 1)Range of soil test P levels (Mehlich 3) for all samples submitted to SWFAL in 2013 under the wheat and canola crop codes. 2) Range of Soil Test P level for all samples with STP<65.
Soil pH on the other hand showed a slight improvement from 2011. The percent of samples under 5.5 decreased by 4%, 25 to 21. Of the samples <5.5 the majority fall within the 5.0-5.5 category, which for winter wheat is still within the optimum growth window (Figures 3 and 4). These numbers are a good sign however two points should be made. There is a significant amount of winter wheat acres that is not sampled; much of this is likely to fall below 5.5 soil pH.
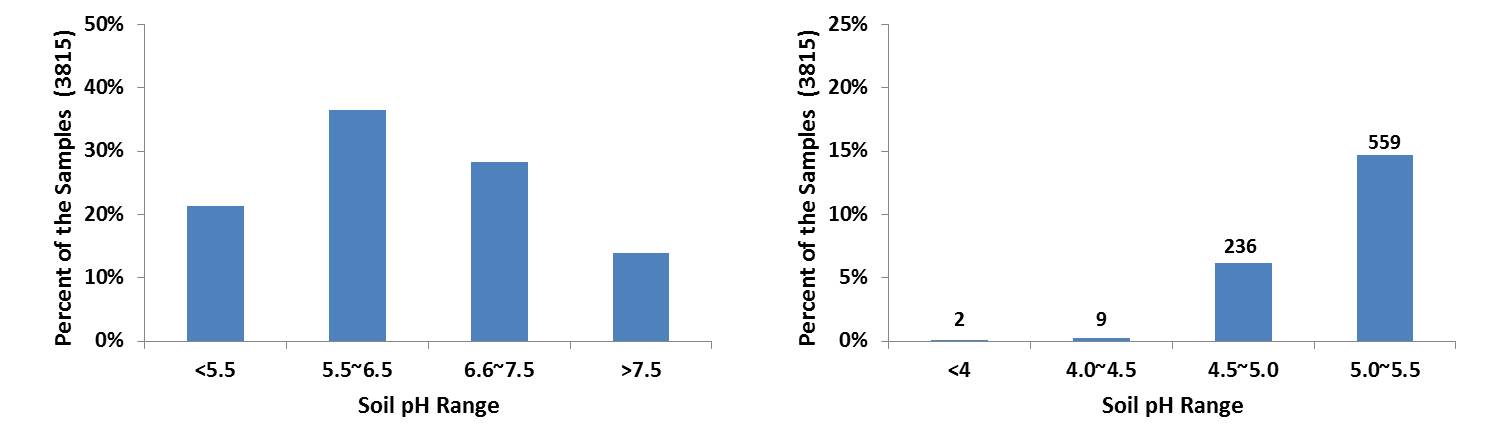
Figures 3 and 4. 1)Range of soil pH levels for all samples submitted to SWFAL in 2013 under the wheat and canola crop codes. 2) Range of soil pH levels for all samples with pH<5.5.
Additionally grid soil sampling and variable rate lime should consider on any field which the composite soil sample pH ranges from the high 4’s to the high 5’s. For example a 75 ac field near Deer Creek had a composite soil sample test pH of 5.3 and buffer index of 6.5. The OSU lime recommendation, for a wheat crop, was 2.2 ton per acre for a total of 166 tons to lime the entire field. However the producer grid soil sampled the field himself at a 2.5 acre resolution (31 samples). Figure 5, shows that the pH of the field ranged from 4.4 to 7.9. Only 33 tons of lime would be required if the field were limed using a variable rate technologies. Cutting the total amount applied by 133 tons would save the producer approximately $4000.
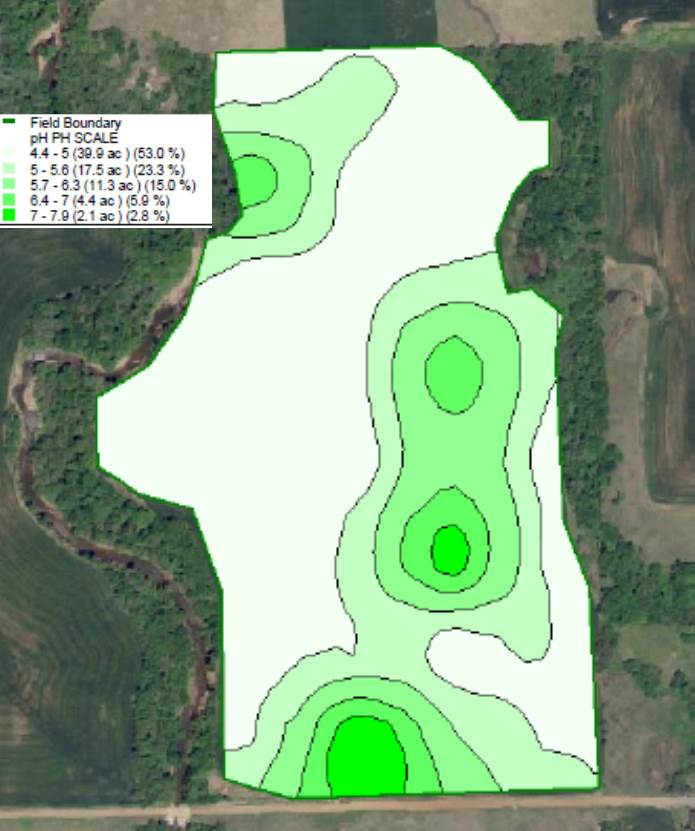
Figure 5. Soil pH results from a 75 acre field that was grid soil sampled at a 2.5 ac resolution.
Oklahoma wheat and canola producers must take advantage of the weather when it goes their way. Yet if the crop does not have the proper soil pH and nutrients under it, it will never reach its potential. Take the time to collect a soil sample and send it in to a lab. The hour it takes to collect the sample a few dollars you spend on analysis will help ensure that crop you are producing has the best chance of hitting maximum yield in the most economically and environmentally sound manner.
Related Factsheets
OSU Soil Test Interpretations
http://npk.okstate.edu/documentation/factsheets/PSS-2225web2013.pdf
Fertilization Based on Sufficiency, Build-up and Maintenance Concepts
http://npk.okstate.edu/documentation/factsheets/PSS-2266web.pdf
Ag Apps Updated
Since my Ag App post in July I have presented on the topic an additional five times and have two more on the books for 2014. A good thing about doing talks is that you have to update the information to remain current. Which in all honesty, when it comes to technology of any kind this is quite challenging and even more so for Smart Phone Apps. In July when I first blogged on the subject I had 76 apps on my iPad. Today (1.3.14) I have 111 apps on my iPad, for both the iPhone and iPad, that I deem to be Ag related. Since the summer I have found new favorites, changed some, and added categories but for the most part I still maintain my 2 minute rule stated in the first blog. I have allowed a bit more leniency in that I now say “If I cannot figure it out in 3 minutes it’s GONE. An app should be intuitive, easy to use and have a purpose. They only exception to the 3 minute rule is the Scouting and Mapping Apps. Because of their complexity I allow them 5 minutes, and then I am done. Any app with GIS in its name gets much more time” I guess I am just getting soft.
Again I must make the obligatory statement; I am not a developer, designer, or expert. I am just a user who has had a chance to look at a few apps. Almost all of the apps I have are free and I am sure I have missed a few. Please share those with me. I am also not discussing Mobi’s, this is another large group of quality decision aid tools. I am also not discussing none apples apps. This is not because they are not relevant or important, it is because I do not have that technology.
I now have nine Ag folders on my iPad:
Ag News/Weather/Markets, Scouting/Mapping, Record Keeping, ID Tools, Crop Tools, Calculators, Sprayer/Chemicals, Fertilizer, Seed Select.
Apps are nice because the majority are stand alone and do not need internet or cell connection. This means they can be used when you are in the middle of nowhere, which is a great deal of Oklahoma, and have no service. This will exclude many of the Ag News/Weather/Markets, Scouting/Mapping, and Record Keeping apps that need positioning or location information.
Now let’s discuss some of the new and old apps.
Ag News/Weather/Markets


Not much change in this group however I have added one or two.
Scouting/Mapping


This category has changed the most. Record keeping apps have been removed and several new apps added. The only free apps which can create boundaries are still Scout and Sirrus. To date Scout remains to be my favorite app for in field scouting notes. Pictures tagged with Lat Long and a note is very useful. My knock on is app is its boundary creation. It is a challenge every time as it is hard to remember the steps and not make a mistake. That is where Sirrus comes to play, by far the best boundary creation app. Sirrus has easy to use tools for both point and pivot boundaries. I like the edit vertex zoom in tool that resembles a rifle scope. I was able to add 12 fields in a matter of 20 minutes. Being able to create grid soil sampling scheme and record samples is also a very nice tool. My favorite part of the app, the UNDO button, and all apps should include this. The drawback to Sirrus is that it has no ability to take notes such as Scout. An additional nice scouting tool is South Dakota States NPIPM (North Plains IPM) app. This app provides not only a pest id tool with morphological drop down, I will discuss this in the ID Tools cat, but also management recommendation for the identified insect.
Record Keeping,

The majority of the apps in this category are “Pay to Play”, which makes since as they deal with data management and storage. Many would also fit the Scouting/Mapping category. As I do not pay for many apps I do not have experience with any of these. However this is the category that I would recommend any group to look at as they should be the all-inclusive app. However, PeRK by the University of Nebraska is a free app designed for field records of pesticide applicators.
ID Tools,


I have added a few apps to this category but my favorites have not changed. I regularly use Plant Images, ID Weeds, and the Pestbook as references. I will add more discuss to app ID tools. The importance of being able to ID weeds and Pest via morphological drop down menus (ID Weeds and NPIPM) is extremely important. Many of the ID tools just have pictures and names. Well is I am using an ID Tool I likely do not know what I am looking at or what it is called.
Crop Tools,

Crop Tools includes my second “Paid in Full” app. And this one hurt a bit more. Not because it cost money but because I have multiple versions of the hard copy. However Field Guide by Purdue is one of my most recommended apps. Field Guide is the electronic version of the Purdue Corn and Soybean Field Guide, which the majority of consultants in the Corn Belt likely have this sitting in their truck. The Stoller apps also have nice very nice image bank of plant developmental phases. FieldGuide and CornAdvisor, another good app, are great examples of what I expect to be coming out of the majority of the Land Grant Universities very soon. Cooperative Extension has hundreds if not thousands of quality hard copy publications just waiting to be turned in to handy dandy apps. To be honest I am working on turning my Nutrient Management Field Guide into an app right now.
Calculators,


Only two apps has been added to this category. I am still using Fert.Removal, HarvestLoss and Growing Degrees on a regular basis.
Sprayer/Chemicals,


Many apps have been added to this group but none of them have been good enough to kick TankMixCalc and SpraySelect of my favorites list.
Fertilizer,


Similar to the Sprayer/Chemicals category several apps have been added to this group, including several from Ok State. For me the Fert Cost Calc is still very useful. I do not get to use the Manure Calc I am very impressed by its layout and user friendliness. This app allows for applicator calibration, nutrient recs and manure value estimator.
Seed Select,

It is no surprise the apps in this category are company created. I will say for the central Great Plains Pioneer’s Canola Calc is very useful tool for selecting canola planting rate providing input for row spacing live plants, seed weight, Germ percent, and survival percent.
To wrap up this blog I want to share with you may new Favorite none ag app. Bump is a huge time saver for anyone who takes pics with your iPhone or iPad. Bump allows easy transfer between mobile devices but more importantly between your mobile device and desktop by a simple tap of the space bar. This file share will go both directions. This means no more emailing pictures from your phone so that you can have them on your desktop. Bump is a iPhone app that can work on the iPad.
When searching with an IPad, remember to switch the search to include IPhone apps, there are some good ones out there that are IPhone only. Check out www.npk.osktate.edu/presentations to see screen shots from many of my favorite apps.
Placing Fertilizer with Canola at planting has positives and negatives.
With all things holding constant the last canola trials of our project should be picked up by the plot combine Thursday 6-20-13. Before the first yield results comes to my desk I can tell you that we are learning a great deal from the trials this year. In particular the DAP (18-46-0) placed with seed trail that was supported by the Oklahoma Oilseed Commission. This past year at the no-till site in Perkins, which has a low soil pH, the check plots that did not receive any fertilizer, preplant or banded, did not survive the winter. Additionally at both of our locations, Lahoma (low soil test P) and Perkins, we have documented that oil content was reduced when phosphorus was left out of the treatment.
Additionally out of the four site years, that is two locations over two years, the addition of DAP with the seed in-row reduced stand. The graph below shows just how much stand was reduced on a relative basis. Relative stand is a way to compare the DAP treated to the Check (no DAP) which we assume is 100%. So if we look at the graph below the plots were at 75% relative stand (i.e. 25% loss) at approx 5 lbs N per ac. By about 15 lbs N the stand was down to 50%.
There are a few things to keep in mind first, in the case of these trials stand loss did not always mean yield loss. Canola is a great compensatory crop, if there is open space it will grow into it. I will have to run the final yield data to get more answers. These trials were planted on 15″ rows putting down 5 lbs seed per ac, or at least that was the target rate. Many have shown that the seeding rate does not have to be that high if sown properly. I believe in a few cases we may have actually benefited from thinning the stand. However if you were planting 2.5 lbs seed per acre a small loss of stand may be a bigger yield loss. This is one of the question we will have to answer in the future.
And finally it should be noted that canola is planted on a wide range of spaces 6″,7.5″, 12″, 15″, 30″ are some of the most common. As the row width changes the amount of N placed with the seed changes. In other words if the goal is 50 lbs DAP per acre you will put twice as much in a 15″ row than you do a 7.5″ row. The Table at the bottom provide a guide for equivalent rate based on 15″ rows. For example if your target a excepted stand loss of 25% (5 lbs N according to the Figure) but you are planting on 6″ row spacing the recommendation would be apply no more than 13 lbs N per ac in the row or 72 lbs DAP/ac (13/.18)
Impact of DAP (18-46-0) placed in-row on canola stand in terms of lbs N ac-1.
Equivalent amount of N based on 15″ row spacing.
