Every few years I request the results of all soil samples submitted to OSU Soil, Water, & Forage Analytical Labs (www.soiltesting.okstate.edu) under the crop codes of winter wheat and winter canola. Within this data set I can look at trends occurring across the state over time. In this report I will focus on the 2013 results but make some comparison with the 2011 sample values.
As it pertains to mobile nutrients such as N, S, and B there is little that can be applied from the previous year’s soil samples because their levels in the soil change rapidly. Samples must be collected every year to determine the current status. However the soil test levels of immobile nutrients, P, K, Mg, ect are relatively stable over time and the recommendation is to take a close look at these values every three to five years.
In 2013 the number of sample submitted increase. There were nearly 1000 more wheat soil samples (2733 to 3574) and 200 more canola soil samples (33 to 231). If the distribution of nutrient levels of the two years are compared the only significant change is that the soil test NO3 level was significantly lower in 2013 (Tables 1 and 2). This is attributed to the extremely dry 2012 spring and summer which delayed the breakdown of wheat straw and immobilization of residual N.

Table 1 and 2. Summary from all samples submitted to SWFAL under the wheat and canola crop codes in 2001 and 2013.
Reviewing the 2013 values the most concerning aspect is that 72% of the 3800+ soils samples had a Mehlich 3 P value below optimum soil test phosphorus (STP) of 65 (Figures 1 and 2). That adds up to 109,000 acres needing phosphorus, if you assume each sample represents 40 acres. There is no way to determine how much P2O5 if any was applied to these particular fields. However, an estimated impact of not fertilizing can be calculated. Based on the Oklahoma typical average yield of just below 40 bpa, it would cost the state approximately 575,000 bushels if the land went unfertilized. At $5.00 a bushel that is $2.8 million in revenue. To remedy the low STP it would take approximately 2.76 million lbs P2O5 at a cost of $1.5 million ($0.50 per lb).
In the NPKS response study wheat fields across the state were evaluated for a response to additional (in addition to producer’s standard practice) nitrogen, phosphorus, potassium, and sulfur. Phosphorus was the most limiting nutrient at 7 of the 59 harvest locations. A response to P occurred more often than any of the other nutrients tested. It is important to note at all seven fields had been fertilized with P that season, however each time it was below the OSU recommended rate. The response study was a great reminder that it is important to have a good soil test and to follow the recommendations.

Figures 1 and 2. 1)Range of soil test P levels (Mehlich 3) for all samples submitted to SWFAL in 2013 under the wheat and canola crop codes. 2) Range of Soil Test P level for all samples with STP<65.
Soil pH on the other hand showed a slight improvement from 2011. The percent of samples under 5.5 decreased by 4%, 25 to 21. Of the samples <5.5 the majority fall within the 5.0-5.5 category, which for winter wheat is still within the optimum growth window (Figures 3 and 4). These numbers are a good sign however two points should be made. There is a significant amount of winter wheat acres that is not sampled; much of this is likely to fall below 5.5 soil pH.
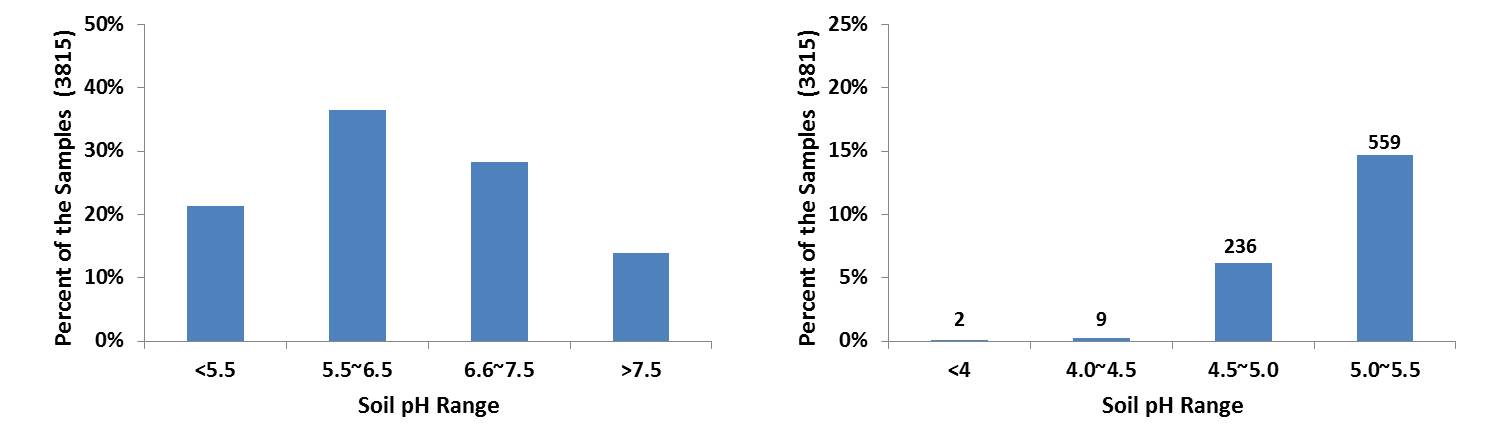
Figures 3 and 4. 1)Range of soil pH levels for all samples submitted to SWFAL in 2013 under the wheat and canola crop codes. 2) Range of soil pH levels for all samples with pH<5.5.
Additionally grid soil sampling and variable rate lime should consider on any field which the composite soil sample pH ranges from the high 4’s to the high 5’s. For example a 75 ac field near Deer Creek had a composite soil sample test pH of 5.3 and buffer index of 6.5. The OSU lime recommendation, for a wheat crop, was 2.2 ton per acre for a total of 166 tons to lime the entire field. However the producer grid soil sampled the field himself at a 2.5 acre resolution (31 samples). Figure 5, shows that the pH of the field ranged from 4.4 to 7.9. Only 33 tons of lime would be required if the field were limed using a variable rate technologies. Cutting the total amount applied by 133 tons would save the producer approximately $4000.
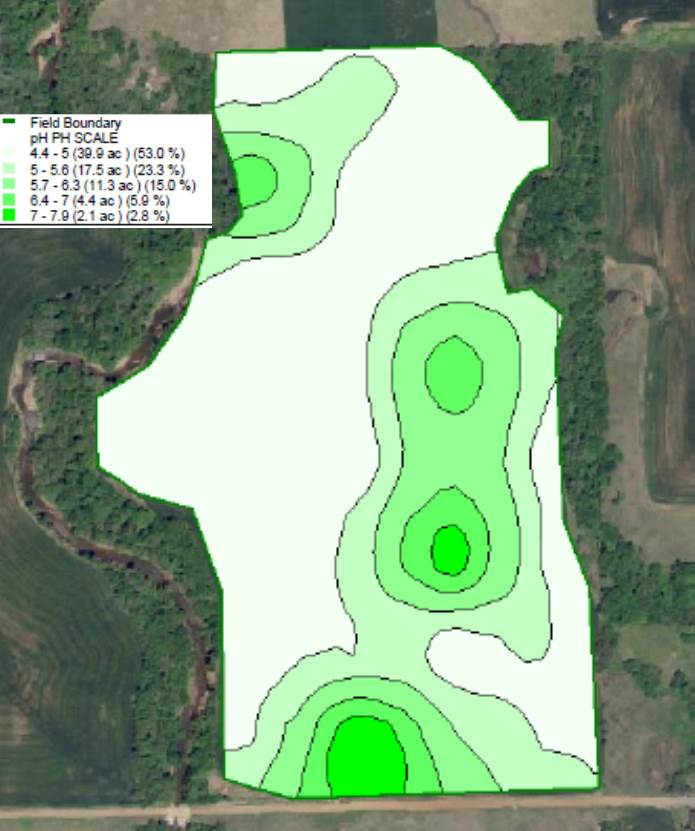
Figure 5. Soil pH results from a 75 acre field that was grid soil sampled at a 2.5 ac resolution.
Oklahoma wheat and canola producers must take advantage of the weather when it goes their way. Yet if the crop does not have the proper soil pH and nutrients under it, it will never reach its potential. Take the time to collect a soil sample and send it in to a lab. The hour it takes to collect the sample a few dollars you spend on analysis will help ensure that crop you are producing has the best chance of hitting maximum yield in the most economically and environmentally sound manner.
Related Factsheets
OSU Soil Test Interpretations
http://npk.okstate.edu/documentation/factsheets/PSS-2225web2013.pdf
Fertilization Based on Sufficiency, Build-up and Maintenance Concepts
http://npk.okstate.edu/documentation/factsheets/PSS-2266web.pdf
