Home » 2020
Yearly Archives: 2020

Value of in-season application for grain only wheat production.
Data used in this blog is summarized from work by
Joao Souza, under the leadership of D.B. Arnall
Lawrence Aula, under the leadership of W.R. Raun
Key Points
- Wheat is highly resilient and can endure nitrogen stress for a significant period of time and fully recover.
- Delaying all nitrogen until the Feekes 5 to Feekes 7 time frame resulted in improved yields over the pre-plant 32% of the time and a loss of yield 5%. However, grain protein was improved 82% of the time with delayed nitrogen.
- It is better to delay nitrogen application to avoid conditions conducive to N loss.
Historically winter wheat producers have utilized pre-plant nitrogen (N) fertilizer application due to efficiency of time and the lower cost of the primary N source, anhydrous ammonia. However, as the growing cycle of winter wheat is approximately 9 months long with only 80% of the total N accumulation reached by flowering. Research as shown that N applied prior to planting is more likely to be lost due to leaching or denitrification. Researchers at Oklahoma State University have invested significant efforts in evaluating N management strategies. This blog will present the data from multiple trials which allowed for the comparison of nitrogen applied pre-plant versus in-season. The trials were conducted over a four-year period at multiple locations across central Oklahoma.
Delayed Nitrogen – NH4NO3
This study was started in the fall of 2016 and concluded with the 2020 wheat harvest. In all, twelve trials were established and achieved maturity. This study was designed to evaluate the recovery of winter wheat grain yield and protein after the crop was N stressed. Treatments included an untreated check, pre-plant application and ten in-season treatments. The application of in-season treatments was initiated when N deficiency was confirmed and treatments were applied in progressive order every seven growing days to the point of 63 growing days after visual deficiency (DAVD). A growing degree days is any day that the average daily temperature is at or above 40⁰ F. Ammonium nitrate (NH4NO3) was applied at a rate of 90 lbs N ac-1 for all treatments.
Nitrogen response was observed at eleven of the twelve locations, and those sites will be the focus of this review. Nitrogen applications were started ranging from Nov. 10th to Mar. 7th for 0 DAVD and, concluded with 63 DAVD occurring between mid-February and early-May. The analysis of the data evaluated the yield and protein of the in-season applications compared to both the pre-plant application and the application made at the first sign of N deficiency, 0DAVD.
Across the eleven responsive years, the pre-plant application never outperformed the 0DAVD in terms of grain yield or protein. In fact, across all location if the in-season application was made prior to the end of March, the yield and protein was equal to or better than pre-plant applications. Four out of elevens sites, yield was significantly improved with in-season applications, and protein was improved in ten out of eleven locations. For the ten site/years that had applications in March, the mid-March application of 90 lbs of N, which is about the stage of hollow stem (Feekes 6), statistically increased yield four times and protein nine times compared to the pre-plant treatment.
The studies objective was to evaluate how long the crop could be deficient and fully recover. There was no relation between when the crop became deficient and when the crop could no longer recover. Yield as maintained as long as the N was applied by late March, or just before the flag leaf is visible (Feekes 8), grain yield was the same as if applied on the first day of deficiency. However, if the N was delayed to March protein was increased six out of the eleven locations.

Delayed Nitrogen – Urea
A mirror study to the Delayed Nitrogen – NH4NO3 was established in the fall of 2018 and concluded with the 2020 harvest. This study was placed next to the NH4NO3 and treatments applied on the same days using the same rate (90 lbs N ac-1) applied as urea to evaluate efficiency of urea applications over a range of dates.
Three of the four locations produced a positive response to N fertilizer and documented similar results as the NH4NO3 project. Across these three sites in-season N was always equal to the pre-plant rate if applied before the flag leaf is visible. In addition, if the urea was applied just after hollow stem, not only was yield maintained but protein was significantly increased compared to both the pre-plant and 0DAVD treatments at all three responsive sites.
Split Rate Nitrogen – NH4NO3
This study looked at multiple rates and times of N application but for this factsheet we will focus on a small set of treatments. Performed over two years and four total sites this project looked at split application of N versus a one-time application, 45/45 split or 90 lbs of N. Application timing was 0, 30, 60, 90, 120 growing days (GDD>0), trying to have applications at planting in December, February, March and April. In three of the four sites the 90 day application produced the greatest yield and protein for both 45/45 and 90 treatments. In this study the one-time application of 90 lbs N ac-1 out yielded the 45/45 split in two of the four years and was equal the other two. The 90 day application of 90 lbs N ac-1 produced a higher protein concentration at all sites compared to the 45/45 split applied on the same date.
Nitrogen Rate by Time – Urea Source
This study evaluated four rates of N (0, 40, 80, 120 lbs N) applied at three times (30 days pre-plant, pre-plant, and Feekes 5) using urea. Feekes 5 is the growth stage prior to hollow stem when the wheats leaf sheaths are becoming strongly erect. This project was completed over two locations for two years, however of the four site/years only three statistically responded to N fertilizer. In those three responsive trials the Feekes 5 application grain yield was equal to pre-plant once, greater than pre-plant once, and less than pre-plant once. The grain protein was only statistically different between the pre-plant and Feekes 5 once, with an increase in protein with late N. The one location with yield loss can be likely attributed to N loss from urea volatilization. The urea was applied on no-till immediately after a heavy rainfall with no substantial precipitation occurring for a week after application.
Summary
This factsheet summarizes four separate research projects which can contribute data from 24 trials to evaluate the application of in-season N compared to pre-plant N, see Table 1. Of these 24 site/years we can draw conclusions from the 22 that responded to N fertilizer applications. Across these trials applying all N pre-plant resulted in the highest grain yield once, applying all N in-season near or after hollow stem resulted in an increase in grain yield above that of the pre-plant seven times. However, the delaying of N application until hollow stem resulted in a significant increase in grain protein concentration at 18 of the 22 trials.
These results are significant for the winter wheat growers of the southern Great Plains as this research documented not only the ability but the necessity to move away from pre-plant and fall N applications for winter wheat grain production. The window for N application is likely much greater than most wheat producers would have considered. This work showed that not only could N be delayed and yield not sacrificed but, when delayed; yield will be maintained and protein concentration increased.
The final conclusion is that the timing of N application should not be based upon the presence of N deficiency or calendar date. Rather the timing should be based upon the weather and enviroment during application. While many of the projects used NH4NO3 as the N source to limit the impact of N loss via volatilization, the primary source for in-season nitrogen in the region are dry urea and urea ammonium nitrate (UAN) solution. Both of these sources have well documented loss due volatilization. The location from the Nitrogen Rate by Time trial which Feekes 5 applications were statisically below the pre-plant application supports this. This data set provides signifiant evidence that the optimum application window is quite wide and allowing producers more flexiabltiy to avoid those environments which will likely lead to N losses.
Special thanks to EDC Ag Products Co LLC for suppling NH4NO3 used in the delayed N project.

Table 1: Summary of all trial locations and years. The X represents statistical significance, alpha = 0.05. In-season application represents all treatments applied at least 30 growing degree days after planting. Majority of the treatments in the studies were applied after spring green up.
Yellow Wheat the 2020 Edition.
I have been trying to write this blog addressing the yellow wheat for about two weeks now. But with finally finding a dry”ish” day or two and a lot of calls and emails about yellow wheat, I am just now getting to it.
So the short story is there is a lot of wheat out there in the state that is show signs of chlorosis, or yellowing. I wish I could say I have all the answers for you in this article, but I will have to lay heavily upon the agronomist best answer, “Well it Depends.”.
Cow pox showing up in a wheat field in Kay County.
First we will start with the things I know least about and then move on to things that are more in my wheelhouse. In the last two weeks I have been on multiple email strings trying to chase down the cause of chlorosis in fields all over the state. One of these included Dr. Bob Hunger and the Plant Disease & Insect Diag Lab (PDIDL) and in one field his final thought was “So, my best guess is cold and wet soils along with fungi colonizing the older leaves that are starting to senesce.” At the same time I am finding regular occurrence of Tan Spot and Leaf Rust increase. All these pathogen cause some level of chlorosis and if you do not get down and pull some samples you will never know the cause.

Originally thought to be leaf rust, but corrected by Dr. Hunger who suggested it is early stages of striped rust, found in Stillwater Oklahoma 3.27.2020.
A new for me this year is what I am calling the herbicide ding. I was able to get over a lot of my wheat that first week of March with a shot of herbicide, everything was almost to hollowstem. The wheat really got dinged. Very visual yellowing and stunting of the plants. Talking with Dr Manucheri, she had seen the same thing in her plots in Tipton. I have also visited several farmer fields with the same symptoms. Dr. Manucheri shared with me the Finesse label. Directly from the label “Temporary discolorations and/or crop injury may occur if herbicide is applied when the crop is stressed by severe weather conditions (such as heavy rainfall, prolonged cold weather, or wide fluctuations in day/night temps), disease or insect damage, low fertility, applications to course soils, or when applied in combination with surfactant and high rates of liquid fertilizer solutions.” This can be found on page 5, http://www.cdms.net/ldat/ldFSL002.pdf . You can just about mark off every weather and application condition mentions, on the same field.
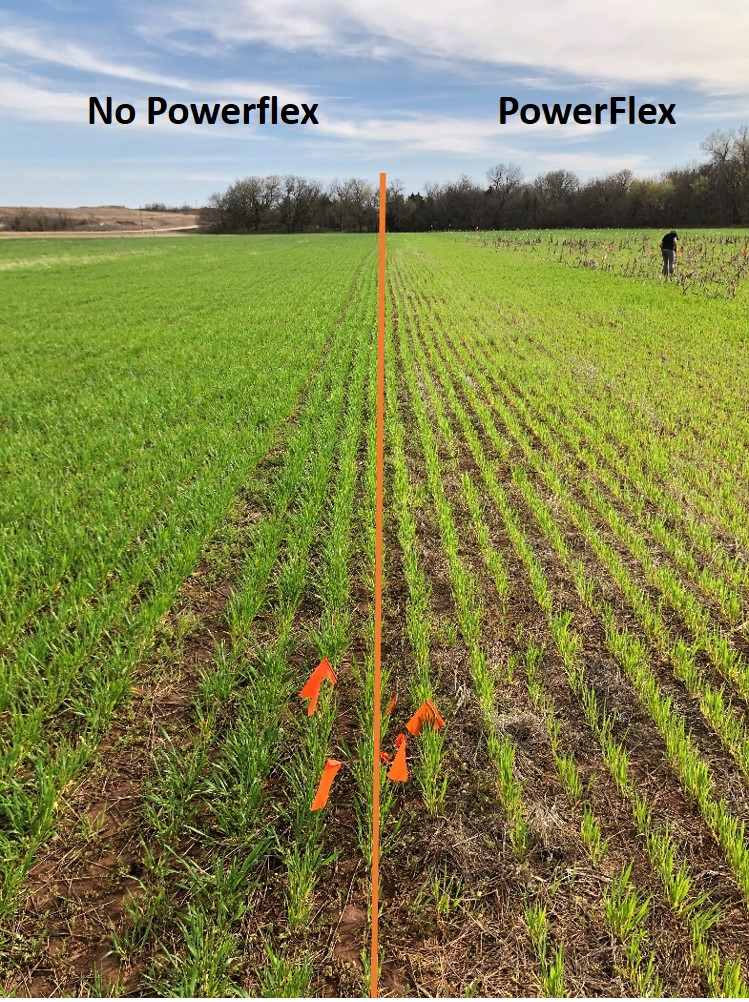
Image collected 3.25.20. The right side was treated with Powerflex on 3.5.20. The left side was not treated so that sorghum could be planted in April.
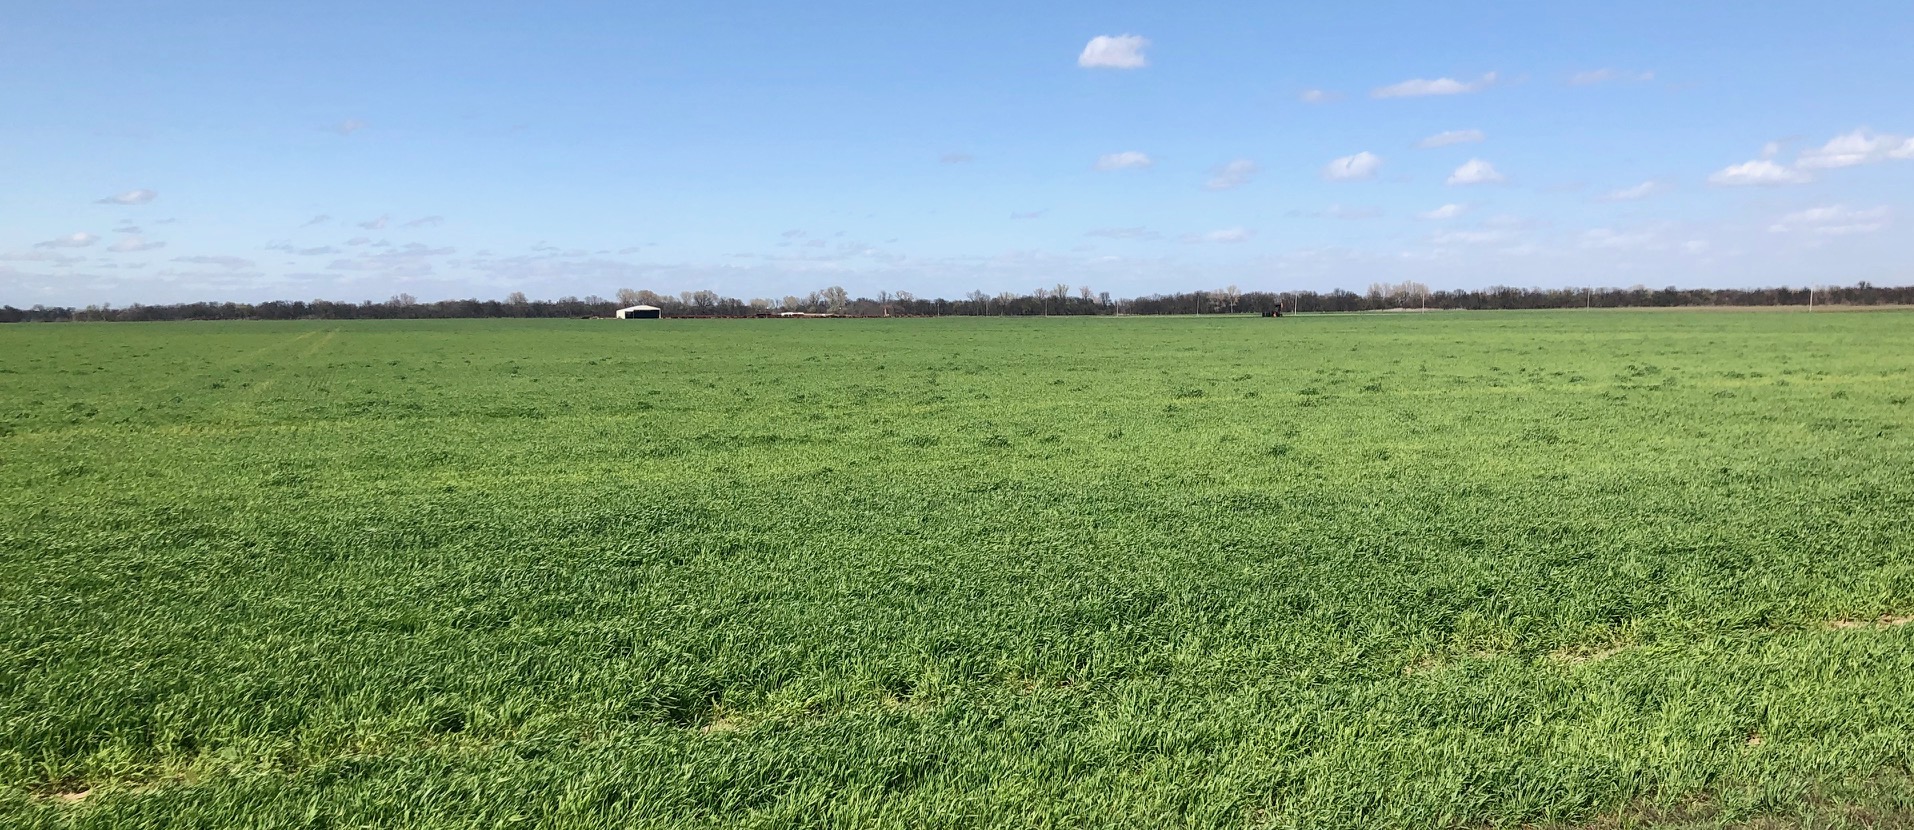
Now to the yellow wheat I can comfortably talk about. There is nitrogen deficiencies out there. That should not come as a shock with the amount of rain we have received over the last couple months. I also believe that a fair amount of the wheat crop out there is a bit lacking on roots department.

The overarching wet cools soils that we have more than likely have led to reduced root exploration in some areas. And if you combine short roots with a nitrate leaching then the probability of N being out of the reach of the crop is high. Then the question is “Is there still time to do anything?”. The trip I look over the weekend (3/28, 3/29) that encompassed a great deal of the North Central Ok wheat belt showed me that the majority of the wheat had really progressed physiologically in the last two weeks. At this point, a positive return on N investment hinges on the stage the wheat is at.
Our delayed N work over the past several years show that we have maintained the yield on our trials even when fertilizer was delayed into the first week of April. https://osunpk.com/2019/08/14/how-long-can-wheat-wait-for-nitrogen-one-more-year-of-data/

Each graph is from a location where the delayed N study was preformed. The objective of our study was to determine the impact of prolonged nitrogen deficiency on winter wheat grain yield and protein. Eight studies were conducted with 11 N application timings in no-till dryland conditions. A pre-plant treatment of 90 lbs ac-1 of N was broadcast applied as ammonium nitrate (AN). We used AN as our source because we wanted to measure the crops ability to recover and eliminate the impact of source efficiencies. When visual symptom differentiation (VSD) was documented between the pre-plant and the non-fertilized check, i.e the N-Rich Strip showed up, top-dress applications were performed every seven growth days (GDD> 0) (https://www.mesonet.org/index.php) until 63 growth days after VSD at all sites. The only N the treatments received where applied according to treatment structure. No pre-plant N was applied on the trials other than the Pre-plant treatment.

This table shows the application dates of the 10 site years of the delayed nitrogen study. The first column is the location, to the right of the location is two rows the top is grain yield and the bottom is grain protein. Each of the following columns corresponds to an application date. Applications began at each study when the The colors are related to whether that application was statistically (Alpha=0.05) worse than, equal too, or better than applying nitrogen at the first sign of deficiency (0DAVD). For this comparison it is important to know that at no location did preplant have significantly greater yield than 0DAVD.In the majority of those years that first week of April corresponded with the growth stage Feekes 8, last leaf just visible. As the crop moves beyond that point, catching up did not happen. Currently there is wheat out there in the state that has not hit hollow stem (Feekes 6) and there is wheat at Flag leaf (Feekes 9).

The Feekes Scale focused in on the stem extension growth phase. The period extends from hollow-stem (Feekes 6) to boot (Feekes 10).
The high rainfall totals we have could have also led to another deficiency sulfur. In the past S deficiency is fairly hard to find in Oklahoma. Our long history of low S using winter wheat and high sub-soil S levels have kept the response to Sulfur low, but not uncommon. Sulfur is a mobile nutrient and will also be lost via leaching especially in sandy soils in the northern part of the state. Sulfur deficient is different from N in that it shows in the newer growth as a general yellowing of crop. Kansas State has a lot of great resources on sulfur management in wheat. https://webapp.agron.ksu.edu/agr_social/m_eu_article.throck?article_id=2132
https://bookstore.ksre.ksu.edu/pubs/MF2264.pdf
Sulfur deficiency in wheat. Photos by Dorivar Ruiz Diaz, K-State Research and Extension
If your wheat is yellow and before you call the fertilizer applicator, first confirm it is nitrogen and or sulfur and not something else. A key point to nitrogen deficiency is that the cholorsis will be worst on the oldest leafs while new growth is green. If N deficiency is confirmed then figure out how far along your wheat is. If the crop is around hollow stem to Feekes 8, if you can get the N on soon there is a good chance to get your money back plus. Keep in mind with air temps above 60 degrees UAN will burn the tissue so it is best to use streamer nozzles, which will still burn but the tissue damage is lessened. If you do not have access to streamers you can dilute the UAN with water and use flat fan nozzles. Cutting the UAN with water reduce the impact of leaf burn, I typically recommend at least 2 part UAN to 1 part water, but a 1 to 1 is the safest.

Image of wheat with forage burn from UAN applied with streamer nozzles. Application was made two days prior with air temps where above 80 degrees.
If you have any questions or concerns please feel free to email any questions you may have.
Brian Arnall
b.arnall@okstate.edu
