Home » Posts tagged 'wheat' (Page 4)
Tag Archives: wheat

Re-Post: Sensing the N-Rich Strip and Using the SBNRC
This the recent rains across the dry wheat belt the N-Rich Strips are going to start showing up. Because I am re-posting ans older blog that walks users through the sensing process and inputting data in to SBNRC. But since post we have also release a iOS version of the Online Calculator. iOS N-Rate Calc
Original Post:
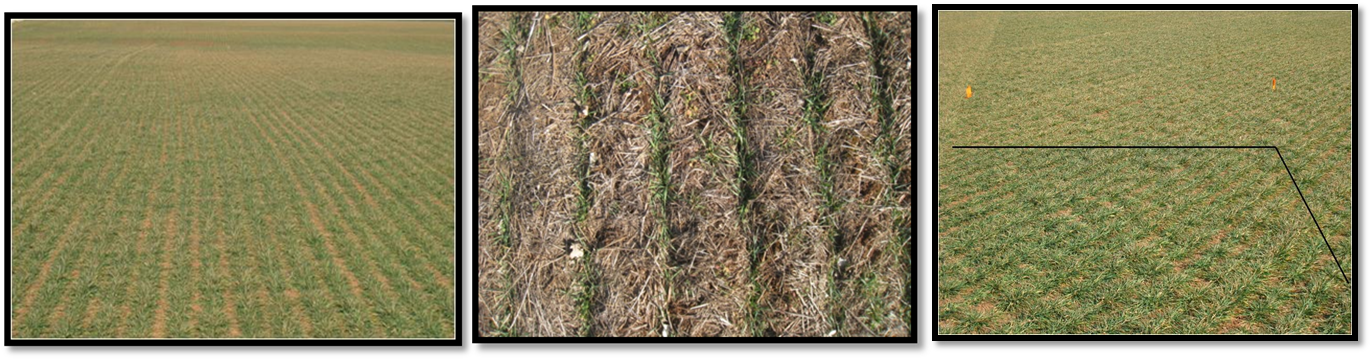
With the significant swing in temperature over the last few weeks many are chomping at the bit to get outside. The wheat is starting to respond to the good weather and N-Rich Strips are showing up around the state. Over the past week I have had several calls concerning the impact of the cold weather on the N-Rich Strips. Many of the fields either are still small due to limited days of warm weather and growth or may have a good deal of damage to the foliage. If the field of concern has only a little or no damage and the strip is visible, the time to go is NOW, but if you cannot see the strip and your field has tissue damage or is small, similar to the first two images, then you will need to wait a week or two for sensor based recommendations. Another situation fits with the third image, the field has freeze damage but the N-Rich Strip is also visible. In this case the predicted yield level would be reduced do to the dead tissue making the N rate recommendation a little off. I still however recommend using the sensor and online SBNRC (http://www.soiltesting.okstate.edu/SBNRC/SBNRC.php) to make or base top-dress N rate. Even if the recommendation is a little off it will still be much more accurate than just guessing. However you must look at the SBNRC and ensure that it makes agronomic sense, if it does not consult your county educator or myself. This is discussed in more detail in my earlier blog about freeze damage. Keep in mind no matter what, if you can see the N-Rich Strip, everything outside of the strip is suffering from nitrogen deficiency. Decisions and fertilizer applications need to be made soon, to maximize yield.
Winter Wheat and Nitrogen Rich Strips.
Regardless of whether or not the strip is visible you should be planning to sense with the GreenSeeker Handheld very soon. Remember the sensor has the ability to detect differences before your eyes can. To sense the N-Rich Strip and Farmer Practice the user should carry the sensor approximately 30 to 40 inches above the crop canopy while holding the sensor level over the crop. While you are walking the two area the trigger should be held the entire time. I recommend walking at minimum 100 paces for each. The average NDVI value seen on the screen will only stay on the screen for a few seconds. Therefore it is critical you have a method of recording the number for later use. The sensor has limited memory so it will time out is the trigger is held for an extended period of time. If you wish to collect more NDVI readings just do it in multiple trigger pulls recording each. Once you have the average NDVI for the N-Rich Strip and Farmer Practice you can go to the SBNRC site mentioned above to retrieve the N rate recommendation. Once in the calculator, for those in Oklahoma, choose the “within Oklahoma” option in the bottom left hand corner of the screen. This will allow the calculator to access the Oklahoma Mesonet to determine growing degree days. After the location is picked from the options you will need to enter Planting Date and Date Prior to Sensing. Additional information requested is the expected grain and fertilizer prices. While these inputs will provide some economic evaluations they will not impact recommended N rate.

GreenSeeker HandHeld NDVI Sensor
Below is a YouTube video in which I describe how to use the GreenSeeker to collect NDVI readings, describe the data needed to complete the online calculator, and how to interrupt the calculators output.
Managing Protein in Hard Red Winter Wheat.
A result of the 2016-17 winter wheat crop was a significant amount of discussion focused on protein levels. For two years running now, the protein levels have been low across the board. Low protein brings in a challenge to sell, could impact local basis, and even more concerning is that low protein is an indicator that nitrogen was limiting during grain fill. Therefore, the field maximum yield potential was not achieved. In this blog, we talk about what protein is, what can be done to maintain a good protein level, and what can be done to increase protein if desired.
First, the definition of protein is any of a class of nitrogenous organic compounds that consist of large molecules composed of one or more long chains of amino acids and are an essential part of all living organisms, especially as structural components of body tissues such as muscle, hair, collagen, etc., and as enzymes and antibodies. Protein is also one of the many attributes that determines end-use quality and marketability of winter wheat. Sunup TV met with Dr. Carver in the baking and milling lab to create a great video discussing wheat quality impact on baking and milling.
We determine protein by measuring the percent of nitrogen in the grain and multiplying by a factor of 5.7. So if the grain has N % of 2.5, the protein content is 14.25. The amount of N in the grain is affected by many variables such as weather during grain fill, yield level, and N availability during grain fill. If weather is conducive to good grain fill and test weight is high, we will often see protein values dip. On the other hand when grain fill conditions are hot and dry and we have light test weight, wheat protein will be higher. Research has shown (Figures 1 and 2) that generally as yields increase protein levels decrease. Of course if N is limited during grain fill, the N available for the grain is reduced, and the plant is forced to get all grain N from re-immobilizing N in the leaf tissue.
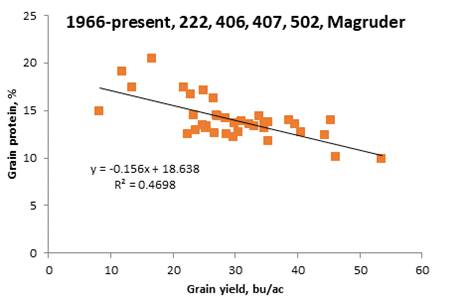
Fig 1, Yield and protein averages from all of the OkState Long Term fertility trials. Data courtesy Dr. Bill Raun.

Fig 2, Grain protein and yield of from intensively managed wheat. Data Courtesy Dr. Romulo Lollato KSU.
Maintaining Protein, and yield.
Managing nitrogen to maintaining protein and maximizing yield comes down to making sure that N is available at critical growth periods. With wheat, the critical uptake stage is typically the time frame between hollow stem and soft dough. The two graphs below show nitrogen uptake in wheat and barley. If the same graph was made for dual purpose wheat, the upward swing would start sooner but would follow the same general trend.

Fig 3, Nutrient Uptake of Wheat found in “Agricultural and Biological Sciences » “Crop Production”, ISBN 978-953-51-1174-0, Chapter 5 By Juan Hirzel and Pablo Undurraga DOI: 10.5772/56095″

Fig 4, Nitrogen uptake in Barley at two nitrogen rates. http://apps.cdfa.ca.gov/frep/docs/N_Barley.html
When it comes to making sure N is available during this time of peak need, the only way we can do that is apply just before it is needed. This means split application. While putting all the nitrogen out pre-plant as anhydrous ammonia is the cheapest method, it is also the method that provides the lowest nitrogen use efficiency and is most likely to show deficiencies late in the season. One of the challenges with 100% preplant N application is that years with good yield potential coincide with years with good/high high rainfall, which means more nitrogen loss. Some interesting results from studies implemented in the 2016-17 cropping season showed the importance of nitrogen application timing. The study is determining how long nitrogen application can be delayed after the N-Rich strip becomes visible (https://osunpk.com/2013/09/19/nitrogen-rich-strips/). For the study, 90 lbs of N was applied on one of the treatments at planting When that plot became visibly greener or bigger than the rest, N application was triggered. After the 0 DAVD (Days after visual difference where the day had growing degree days >0), another treatment was applied every 7 growing days for 63 growing days. Each plot, excluding the zero N check, received 90 lbs as NH4NO3 (we use this to take the variable of volatilization out of the data). In all cases, 90 lbs applied in late January to early February was better than 90 lbs pre-plant. Keep in mind there was 0 N applied at planting for each DAVD application timing; yet, we still hit 50-80 bushel wheat with nothing but in-season N. This is the result of supplying the N when the plant needs it. I should add this is just one year of data, and every year is different. The study is being replicated again this year and will be highlighted at the Lahoma field day.
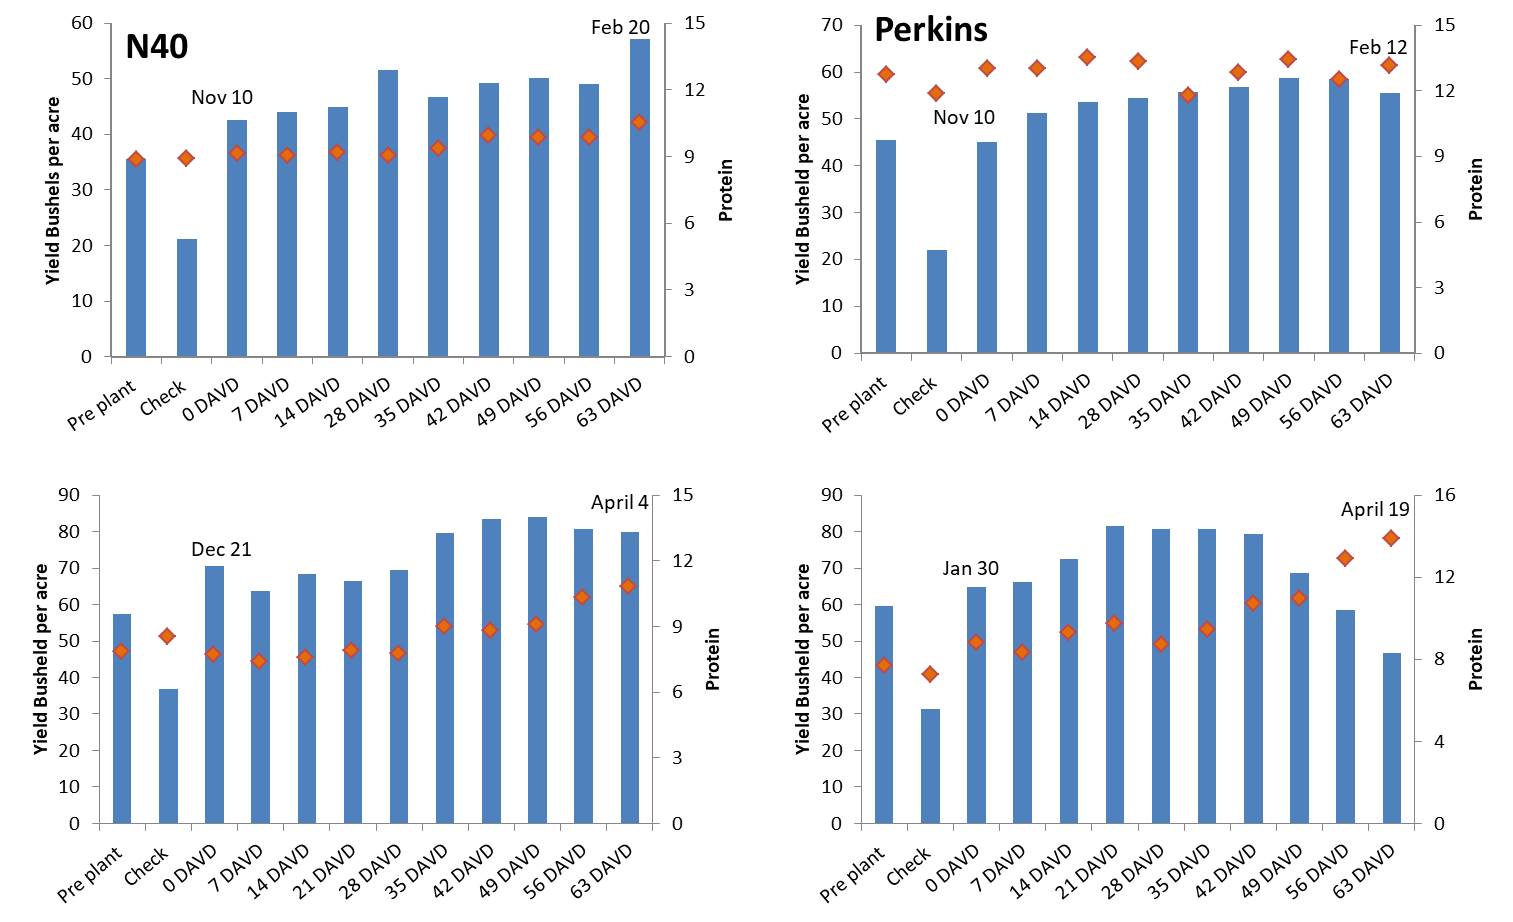
Fig 5, Results from the 2016-2017 delayed nitrogen study led by Mr. Joao Bigato Souza. The trials consisted of a preplant plot, unfertilized check plot, and then a series treatments in which N application was based on days from a visual difference between the pre-plant and check. All fertilized plots received 90 lbs N as NH4NO3. DAVD is days after visual difference. (Error in bottom left graph, the last date should be March 27 not April 4)
For dual-purpose wheat, the total amount of N expected for the forage production needs to be applied pre-plant. Oklahoma State recommends 30 lbs N for every 1,000 lbs of forage expected For grain-only wheat, there needs to be only 20 to 40 lbs of N available to the crop when planted (this includes residual N). The remaining N should be applied at green up or early spring. The only way to ensure that N is applied when the crop needs it is to utilize the N-Rich Strip method. Having a N-Rich strip in your field lets you know when the wheat needs more nitrogen and when it does not.

Fig 6. Nitrogen Rich Strip (N-Rich) showing up in a No-till wheat field.
Two years testing the N-Rich Strip and Sensor based nitrogen rate calculator (SBNRC) from the Texas boarder to the Kansas boarder showed that the SBNRC on average reduced N but maintained yield and protein when compared to standard farmer practice (Table 1).

Table 1. Results from testing the Nitrogen Rick Strip and Sensor Based Calculator Method across Oklahoma wheat fields.
Increasing Protein
Some producers may plan to market high protein for a premium if available. Fortunately, there are opportunities to increase protein via management. While most of the strategies for increasing protein happen later in the growing season, some of the early decisions can be a significant contributing factor. Variety selection and keeping the plant healthy and free of competition (i.e., pest management) throughout the growing season are going to increase the opportunity to produce high protein wheat. After that, the equation goes back to Figures 3 and 4 and making sure the crop has access to nitrogen during peak periods, including grain fill. If you will note, the bottom two graphs of Figure 5 both show significant increases in protein on the later applications. For both locations, this was when N (90 lbs N ac-1) was applied after full flag leaf emergence. There has been a significant amount of work at OSU looking at late application of N stretching back into the 1990s http://nue.okstate.edu/Index_Publications/Foliar_N_Curt.pdf. The focus has been looking at timing, source, and rate. The take home of decades of work can be summarized as such. Yes, protein can be increased with late season application, but not always. Applying N at or after flowering has a significantly greater probability of increasing protein than a application at flag-leaf. Source of N has had little impact if managed properly (UAN, 28-0-0, has to be watered down so that it does not burn the plant). The rate of N does matter quite a bit. Most of the work suggests that for every pound of N applied, the percent grain protein could increase by .05%. So to increase protein from a 12.5% to 13.5%, it would require approximately 20 lbs of N per acre. My work has shown the same trend that a 20 lbs application at post-flowering had more consistent increases in protein than lower rates at the same time or similar rates applied at flag leaf.
This wheat season we are looking to improve our knowledge of management on protein content through multiple studies by continuing the evaluation of varieties and management practices.
If you have any questions for comments please feel free to contact me.
Brian A.
B.arnall@okstate.edu
2017-18 Wheat, Nitrogen Outlook
Its that time of year and I wanted to share my thoughts on nitrogen (N) management in the up and coming winter wheat crop. This season is already shaping up to present certain challenges and opportunities. This blog will highlight many of the topics that were brought up in a recent Sunup TV shoot, video below.
This summer the price of Anhydrous Ammonia (NH3) dropped and producers made a run on NH3 for graze out and dual purpose ground. Currently the price of N is still lower than it has been than it has been in a while and producers are are taking advantage. All things are lining up for this fall to be a good forage year, nitrogen prices are low and we are going into September with a decent soil moisture profile across the wheat belt. If producers can get into the field in a timely manner and we keep getting timely rains it will make a great forage crop. But here is my cautionary statement, if this is a good forage year we are shaping up to be short on N by spring. First the market place over the past two years has overall reduced the amount of inputs into the wheat crops and I would say across the board a lot of the wheat ground is starting out this season with very little residual N. Secondly and more importantly everything which makes for a good forage year makes for a good N loss year, for Oklahoma good rain usually makes good forage. While NH3 does immediately convert to the non mobile ammonium (NH4) form, when soils are warm and moist it does not take long to convert to the mobile and leachable nitrate (NO3) of N. In a recent study looking at N applied at planting in corn, the majority of the NH4 had converted to NO3 by V4, which is usually four to five weeks after planting. Which means NH3 applied in August is likely completely converted to NO3 by September and susceptible to leaching (Since starting this blog in August we have seen a dry down, note the soil moisture on 9.7.17, and abundance of army worms). As the story line has been the low protein wheat of the 2016 and 2017 harvest attention needs to be paid to the crop going into spring.

The 1-day Average 16-inch Plant Available Water map from http://www.mesonet.org. Accessed 8.28.17
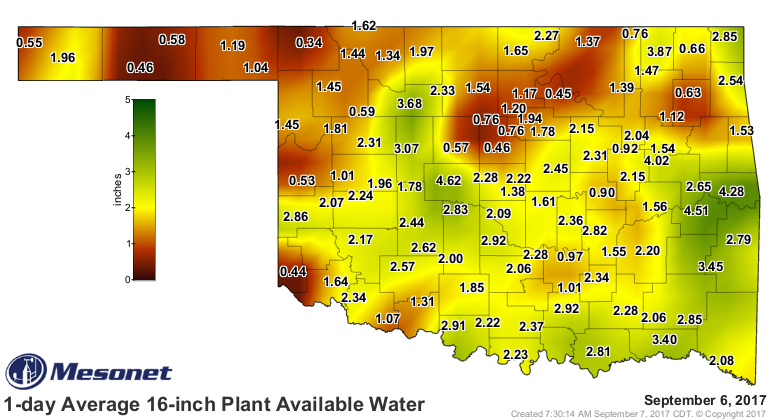
The 1-day Average 16-inch Plant Available Water map from http://www.mesonet.org. Accessed 9.07.17
At Minimum MASS BALANCE the system for dual purpose.
The most simplistic approach to nitrogen management this year is the evaluate what has been made for beef gain and what will be needed for wheat grain yield come the spring. The general rule of thumb is that is takes 1000 lbs of forage to produce 100 lbs of beef gain and depending on the N concentration 1000 lbs of wheat forage will have about 20 lbs N tied up in it. As I talk about on a regular basis, nitrogen use efficiency is not 100% so OSUs rec is 30 lbs of N for each 100 lbs of gain/ 60 lbs of N per ton of forage. On the grain side the standard rule of thumb is 2 lbs of N per bushel. So if the producer applied 100 lbs of NH3 (82 lbs of N) pre-plant and in the spring the average gain is 200 lbs per acre there is only 22 lbs left over for the grain. At that point if we use the field historic average grain yield, lets assume 30 bushel, there needs to be about 38 lbs of N added.
22 lbs (left from pre) / 2 = 11 bushels. 30 – 11 = 19. 2 lbs N per bushel * 19 bushel = 38 lbs of N.
Grain Only Systems
More and more of the grain only producers I am working with are using a 3 pass fertility approach. The approach works this way, No pre-plant N is applied except for what goes down with the seed. In all scenarios this is 40-80 lbs of 18-46-0 which delivers 7 to 14 lbs of N above what is already in the soil (residual N). The second pass comes in winter to early spring before green-up where they are typically applying about 60+ lbs of N. The third pass happens prior to hollow stem. At this point the producers are taking stock of their crop. If the stand is good and soil moisture is good the final application tops them off for the rest of the season. This system is really aided by the application of an N-Rich strip https://osunpk.com/2013/09/19/nitrogen-rich-strips/ . The strip allows the producers to observe the system and know exactly when nitrogen is limited and applications need to be made. Utilizing the Sensor Based Nitrogen Rate Calculator https://osunpk.com/2014/02/24/sensing-the-n-rich-strip-and-using-the-sbnrc/ provides an exact value to the nitrogen needed.
The approach of putting on nitrogen in-season will not only increase the efficiency of the N applied but will help in producing a wheat crop with a good final protein value.
For those wanting to go with the more traditional N application approach of 2 passes I prefer to have no more than 50% of the planned N down at pre-plant. This will allow for a spring green up based upon yield goal. If using the N-Rich strip in a two pass approach I like to see about 30-40 lbs down at pre-plant and then use the N-Rich Strip and SBNRC to fine tune your top-dress which will take place in the spring. Using this technique the research from OSU shows the we can both maximize yield and nitrogen use efficiency.
For the Full Story watch the Sunup TV YouTube video below.

N-Rich Strip Applicator. Push Spreader that can be purchased at any local hardware store.
Using a Grain Drill Grain Box for Fertilizer, Results and a Calibration guide.
For the last few years I have been challenging people to “Think Out Side the Box” when applying fertilizer. One of these application methods is to use a grain drill to put Nitrogen fertilizer into the soil. Just the act of getting N into the soil will immediately decrease the opportunity for losses. While it seems crazy many picked up on the idea of using grain drills for N applicators. The first year of a two-year study looking at documenting the practice is in the books. With data coming in from three locations, utilizing two drill types (double disk conventional and single disk no-till), the results are quite promising. The biggest take home from year one was a 2 parter: 1) if conditions are conducive to nitrogen loss from urea volatilization, applying urea with a grain drill in the spring improved efficiency. Conversely if loss potential was low, there was no difference. 2) in some soil conditions the double disk drill could not close the furrow and this reduced the positive impact of using the drill. The two tables below show the impact application and environment on yield. Each of the treatments had 60 lbs of nitrogen (as Urea) applied per acre. At Chickasha the first application was made while it was fairly dry and then it rained, but the second application was made during a period in which there was no rain but a fairly significant dew each morning. This can be seen as the small effect volatilization played on the yields of the first application timing. At Lahoma, it was the early applications that had a higher risk of loss with no difference seen later.

Partial year one results from the topdress N with a grain drill at Chickasha OK. Timing 1 was late January and timing 2 was late February.

Partial year one results from the topdress N with a grain drill at Lahoma Ok. Timing 1 was early January and timing 2 was mid February, and timing 3 was early March.
With the results from the first year of the top-dressed drilled nitrogen studies in the books, the interest has been increasing. One question keeps popping up: for grain drills without a fertilizer box, what do we put our grain box on to apply fertilizer. At one point the number of inquires hit a critical mass and I sent out my crew to find grain drills and create calibration curves for DAP (18-46-0) and Urea (46-0-0). The crew did just that.
Now please consider what is presented below is a general calibration. Much like the chart on your grain drills, it will hopefully get you close but the best-case scenario is that each drill is calibrate prior to running. As request are made we will try to add more drills to this list.
To create the following charts the guys located several different makes of drills around the OSU experiment stations. They were instructed to choose setting based on the manufacture seed rate charts in the range of 60, 90, 120 etc. For each setting they caught a couple of row units for both Urea (46-0-0) and DAP (18-46-0). They caught each setting multiple times to get a good average.
If you look at the tables you can see the Landol 5211, Great Plains 1006NT, and International 5100 are fairly similar, with the John Deere 1560 being a little lower and the John Deere 450 significantly lower at the lower rates. To use the tables below, consider what kind of grain drill you have and choose to follow one of the drills listed or the average of all five. If you use the average value I would expect most to find they applied a bit more than planned. To make it even simpler, but less accurate, you can use the % wheat value. To do this for DAP take your target rate and divide by .88, this value is what you want to set your drill to. For example for a target rate of 100 lbs DAP per acre use the following formula: 100/.88 = 114. Choose the manufacturer recommended settings 114 lbs wheat seed per acre. If you are wanting to apply Urea take your target rate of urea and divide by 0.71.
DAP 18-46-0
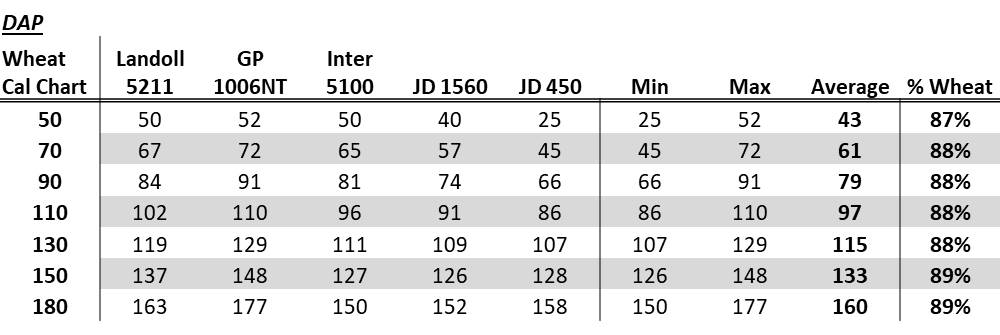
Table showing the manufacturer wheat rate setting and the resulting amount of DAP 18-46-0.

Graph documenting the manufacturer wheat rate setting and the resulting amount of DAP 18-46-0.
UREA 46-0-0

Table documenting the manufacturer wheat rate setting and the resulting amount of Urea 46-0-0.

Graph documenting the manufacturer wheat rate setting and the resulting amount of Urea 46-0-0.
Again, I cannot state this enough, this is a general guide, each drill even of the same manufacture and model will likely be different. The only way to be certain of the rate applied is to calibrate each drill individually.
Questions or comments please email me at b.arnall@okstate.edu or call 405.744.1722
Using the GreenSeeker after Freeze Damage
After discussions with producers in southern Kansas I felt the need to bring back this past blog. It seems that much of (not all) the early planted wheat lost a significant amount of biomass during the winter and the N-Rich Strip GreenSeeker approach is producing what looks to be low yield potentials and N-Rate recommendations. This should be treated much like we do grazed wheat and the planting date should be adjusted, see below. It is also important to note that in the past year a new wheat calculator was added to the NUE Site. http://nue.okstate.edu/SBNRC/mesonet.php. Number 1 is the original OSU SBNRC but the #2 is calculator produced by a KSU/OSU cooperative project. This is the SBNRC I recommend for use in Kansas and much of the norther tier of counties in OK.
Original Blog on Freeze Damage and the GreenSeeker.
Dr. Jeff Edwards “OSUWheat” wrote about winter wheat freeze injury in a receive blog on World of Wheat, http://osuwheat.com/2013/12/19/freeze-injury/. As Dr. Edwards notes injury at this stage rarely impact yield, therefore the fertility requirements of the crop has not significantly changed. What will be impacted is how the N-Rich Strip and GreenSeeker™ sensor will be used. This not suggesting abandoning the technology in fact time has shown it can be just as accurate after tissue damage. It should be noted GreenSeeker™ NDVI readings should not be collected on a field that has recently been damaged.
A producer using the N-Rich Strip, GreenSeeker™, Sensor Based N-Rate Calculator approach on a field with freeze damage will need to consider a few points. First there need to be a recovery period after significant tissue damage; this may be one to two weeks of good growth. Sense areas that have had the same degree of damage as elevation and landscape position often impacts the level of damage. It would be misleading to sense a area in the N-Rich strip that was not significantly damaged but an area in the Farmer Practice that took a great deal of tissue loss.
Finally we must consider how the SBNRC, available online at http://nue.okstate.edu/SBNRC/mesonet.php, works. The calculator uses NDVI to estimate wheat biomass, which is directly related to grain yield. This predicted grain yield is then used to calculate nitrogen (N) rate. So if biomass is reduced, yield potential is reduced and N rate reduced. The same issue is seen in dual purpose whet production. So the approach that I recommend for the dual purpose guys is the same that I will recommend for those who experienced significant freeze damage. This should not be used for wheat with just minimal tip burn.
To account for the loss of biomass, but not yield, planting date needs to be adjusted to “trick” the calculator into thinking the crop is younger and has greater potential. Planting date should be move forward 7 or 14 days dependent For example the first screen shot shows what the SBNRC would recommend using the real planting date. In this case the potential yield is significantly underestimated.
The second and third screen shots show the impact of moving the planting date forward by 7 and 14 days respectively. Note the increase in yield potential, which is the agronomically correct potential for field considering soil and plant condition, and increase in recommended N-rate recommendation. Adjust the planting date, within the 7 to 14 day window, so that the yield potential YPN is at a level suitable to the field the yield condition and environment. The number of days adjusted is related to the size and amount of loss. The larger the wheat and or greater the biomass loss the further forward the planting date should be moved. In the example below YPN goes from 37 bu ac on the true planting date to 45 bu ac with a 14 day correction. The N-rate changes from 31 lbs to 38 lbs, this change may not be as much as you might expect. That is because YP0, yield without additional N, also increases from 26 to 32 bushel.
 Image 1. Planting date 9/1/2013. YPN 37 bu ac-1 and N-Rec 31 lbs ac-1.
 Image 2. Planting date 9/8/2013. YPN 40 bu ac-1 and N-Rec 34 lbs ac-1.
 Image 3. Planting date 9/15/2013. YPN 45 bu ac-1 and N-Rec 38 lbs ac-1.
This adjustment is only to be made when tissue has been lost or removed, not when you disagree with the yield potential. If you have any questions about N-Rich Strips, the GreenSeeker™, or the online SBNRC please feel free to contact me at b.arnall@okstate.edu or 405.744.1722.
Components of a variable rate nitrogen recomendation
I recently wrote a article for the Crops and Soils magazine on the components of a Variable Rate Nitrogen Recommendation. The people at the American Society of Agronomy headquarters were kind enough to make it open access. What follows in this blog is just a highlight reel. For the full article visit https://dl.sciencesocieties.org/publications/cns/articles/49/6/24
Components of a variable rate nitrogen recommendation
Variable-rate nitrogen management (VRN) is a fairly hot topic right now. The outcome of VRN promises improved efficiencies, economics, yields, and environmental sustainability. As the scientific community learns more about the crop’s response to fertilizer nitrogen and the soil’s ability to provide nitrogen, the complexity of providing VRN recommendations, which both maximize profitability and minimize environmental risk, becomes more evident.
The components of nitrogen fertilizer recommendations are the same whether it is for a field flat rate or a variable-rate map. The basis for all N recommendations can be traced back to the Stanford equation (Stanford, 1973). At first glance, the Stanford equation is very basic and fairly elegant with only three variables in the equation.

Historically, this was accomplished on a field level through yield goal estimates and soil test nitrate values. The generalized conversions such as 1.2 lb N/bu of corn and 2.0 lb N/bu of winter wheat took account for Ncrop and efert to simplify the process.
NCrop
The basis for Ncrop is grain yield × grain N concentration. As grain N is fairly consistent, the goal of VRN methods is to identify grain yield. This is achieved through yield monitor data, remote sensing and crop models.
NSoil
The N provided by, or in some cases removed by, the soil is dynamic and often weather dependent. Kindred et al. (2014) documented the amount of N supplied by the soil varied spatially by 107, 67, and 54 lb/ac across three studies. Much of the soil N concentration is controlled by OM. For every 1% OM in the top 6 inches of the soil profile, there is approximately 1,000 lb N/ac.
efert
Historically, the efficiency at which N fertilizer is utilized was integrated into N recommendations and not provided as an input option, e.g., the general conversion factor for corn of 1.2 lb N/bu. Nitrogen concentration in corn grain ranges from 1.23–1.46% with an average of 1.31% (Heckman et al., 2003) or 0.73 lb N/bu. Therefore, the 1.2-lb value is assuming a 60% fertilizer use efficiency. More recently, recommendations have been to incorporate application method or timing factors in attempt to account for efficiencies.
Summary
While a VRN strategy that works across all regions, landscapes, and cropping systems has yet to be developed, the process of nitrogen management has greatly improved and is evolving almost daily. Those methods that are capable of determining the three inputs of the Stanford equation while incorporating regional specificity will capture the greatest level of accuracy and precision. Ferguson et al. (2002) suggested that improved recommendation algorithms may often need to be combined with methods (such as remote sensing) to detect crop N status at early, critical growth stages followed by carefully timed, spatially adjusted supplemental fertilization to achieve optimum N use efficiency. As information and data are gathered and incorporated and data-processing systems improve in both capacity and speed, the likelihood of significantly increasing nitrogen use efficiency for the benefit of the society and industry improves. The goal of all practitioners is to improve upon the efficiencies and economics of the system, and this should be kept in mind as new techniques and methods are evaluated. This improvement can be as small as a few percentages
This article is published in the Crops and Soils Magazine doi:10.2134/cs2016-49-0609. The full article includes more details on the components plus concepts of integration.
Planting Wheat After Anhydrous
Every year in August and early September I get the question “How soon after applying NH3 can I sow wheat?”. Typically my answer has been a conservative one which takes into account rate, depth, spacing and soil moisture to end up with a range of 3 days to a week. The concern with anhydrous application is that when NH3 is placed in the soil it immediately turns into NH4 by striping H from H2O. This action releases OH into the soil in increases pH, depending on rate pH can reach 10.0 this hike in soil pH is a short term as the system disperrses and NH4 immediately begins the conversion to NO3 release H and driving down pH. The high pH in itself is not the problem but if the pH is still high and soil dries the OH will strip H from NH4 and NH3 is formed. The ammonia gas (NH3) is what can easily damage the sensitive seedling.
After fielding several calls in one day I wanted to dig a bit deeper and see what the science and specialist say. I was hoping for a nice consensus, haven’t found that yet. Here are some snip-its.

From Kansas State University
Dr. Dave Mengel
As a general rule, wait about 7 to 10 days between the anhydrous ammonia application and wheat planting. The higher the nitrogen rates and the wider the spacing (creating a higher concentration of ammonia in the band), the longer period of time you should wait. Also, in dry soils you may need to wait longer.
Canada Grains Council’s Complete Guide to Wheat Management Link
In the past, it was recommended that seeding be delayed for two days after banding anhydrous ammonia (NH3). However, in many soils as long as the NH3 is placed 5- 7.5 cm ( 2-3 inches) away from the seed, NH3 can be applied at the time of seeding. Seed damage from NH3 is most likely to occur under dry conditions on sandy soils when there is insufficient separation from the seed. Placement of fertilizer nitrogen should be deeper in sandy soils than in loams or heavy textured soils. Narrow band spacing 25 to 30 cm (10-12 in) is better than wider band spacing particularly under low moisture conditions.
From University on Minnesota
Peer reviewed publication
VARVEL: EFFECTS OF ANHYDROUS AMMONIA ON WHEAT AND BARLEY AGRONOMY JOURNAL, VOL. 74. NOVEMBER-DECEMBER 1982
Field experiments were conducted 1979-1981 on a Wheatville loam soil. The treatments consisted of three rates of N as anhydrous ammonia (45, 90, and 135 kg/ha) in 1979 and four rates of N (0, 45, 90, and 135 kg/ ha) in 1980-1981 at three depths (8,16, and 24 cm) in all combinations. Spring wheat and barley were then seeded at three different times. Seedling stand counts, grain yield, and protein were used to determine the effect of the treatments. Seedling stands were reduced in some cases, but no reduction in grain yield or protein was obtained due to the reduction in stand. The most important factor in spring anhydrous application was the depth of application, which caused greater moisture loss and seedbed disruption at the 24-cm application depth.
Spring wheat and barley response to N rates was similar at all depths of application (no significant interaction between N rate and application depth). The results indicate that anhydrous ammonia can be applied safely at planting time on spring wheat and barley, if applied at the 8 to 16 cm depth and at N rates currently used in the northern Great Plains.
From University on Minnesota (referring to corn) link
The only risk of planting soon after AA application is if seeds fall within the ammonia retention zone. To avoid seedling injury separation in time or space can be important. Under ideal soil moisture conditions and proper application depth of a typical agronomic rate normally there is little risk of seedling injury even if planted on top of the application zone right after AA application. That said, this can be risky and I would not recommend planting on top of the AA row. If you have RTK guidance it is very easy to apply AA between the future corn rows. If RTK guidance is not an option, I would recommend applying AA on an angle to the direction of planting to minimize the potential for planting on top of the AA band. If application conditions are less than ideal and you have no RTK guidance to ensure a safe distance from the AA band, then waiting 3 to 5 days before planting is typically enough time to reduce the risk of seedling injury.
From University on Wisconsin (referring to corn) Link
The depth of NH3 placement was the greatest factor in determined potential seedling damage. The time after application had little impact.
Iowa State University (referring to corn)
by Regis Voss, extension agronomist, Department of Agronomy
The wet fall and spring will cause anhydrous ammonia application and corn planting date to be close. This will lead to the oft asked question, “How long do I have to wait to plant corn after ammonia application?” If there is a soil separation between the ammonia zone and the seed, planting can be done the same day the ammonia is applied. If the seed is to be placed in the ammonia zone, the longer the waiting period the less potential for root injury. There is no magic number of days to wait.

WAKO NH3 applicator used for in-season application.
My take home from several hours of reading research articles and factsheets was my favorite answer IT DEPENDS. I believe Regis Voss with ISU had it right, there is no magic number. The important aspects for determining time will be 1) Soil Moisture 2) N rate 3) Depth and 4) shank spacing. From the reading I think there may be some general rules of thumb.
On the conservative side with good soil moisture, NH3 placed at 6″ deep, rate below 80 lbs and spacing of about 15″ the next day should be ok. As any one of these factors change (drier soil, higher rates, shallower application, wider rows) the more time should be added to reduce risk. One thing to consider is field variability. While the field on average may have great moisture there could be dry spots, while on average you are 6″ deep with the NH3 there are areas the rig is bound to rise up and go shallow. So there is always a chance for hot spots. All of that said I could not find any research on this topic for winter wheat in the southern Great Plains much less Oklahoma. I will always tend to the safe side and suggest if possible to delay sowing a few days after applying anhydrous. However if time is critical proceed with caution.
Looks like I can add one more project to my list and I need to find some open ground and do some “Experimenting”.
Happy Sowing All!
Now may not be the time for Replacement
For phosphorus (P) and potassium (K) fertilizer management there are three primary schools of thought when it comes to rate recommendations. The three approaches are Build-up, Maintenance/Replacement, and Sufficiency. There is a time and place for each one of the methods however the current markets are making the decision for the 2016-16 winter wheat crop a very easy one. The OSU factsheet PSS-2266 goes in-depth on each of these methods. For the rest of the blog I will use P in the conversation but in many scenarios K should/could be treated the same.
Build-up is when soil test is below a significant amount of fertilizer, about 7.5 lbs P2O5 per 1 ppm increase, is added so that soil test values increase. This method is only suggested when grain price is high and fertilizer is relatively cheap. Given the market, this is a no go. The two most commonly used methods of recommendation are Replacement and Sufficiency. In the replacement approach if the soil is at or below optimum P2O5 rate it based upon replacing what the crop will remove. The sufficiency approach uses response curves to determine the rate of P that will maximize yield. These two values are typically quite different. A good way you boil the two down is that replacement feeds the soil and sufficiency feeds the plant.
Oklahoma State Universities Soil, Water, and Forage Analytical Lab (SWFAL) provides recommendations utilizing sufficiency only while many private labs and consultants use replacement or a blended approach. Some of this is due to region. Throughout the corn belt many lease agreement contain clauses that the soil test values should not decrease otherwise the renter pays for replacement after the lease is over. For the corn belt both corn and soybean can be expected to remove 80 to 100 pounds of P per year. Conversely the Oklahoma state average wheat crop removes 17 lbs P a year. In areas where wheat yields are below 40 bushel per acre (bpa) using the sufficiency approach for P recs can increase soil test P over time.

This conceptual soil test response curve is divided into categories that correspond with below opti-mum, optimum and above optimum soil test values. The critical level is the soil test level, below which a crop response to a nutrient application may be expected, and above which no crop response is expected. At very high soil test levels crop yield may decrease.
*Rutgers Cooperative Extension Service FS719
Back to subject of this blog, consultants, agronomist, and producers need to take a good look at the way P recs are being made this year. Profitability and staying in the black is the number 1, 2, and 3 topic being discussed right now. The simple fact is there is no economic benefit to apply rate above crop need, regardless of yield level. The figures above demonstrate both the yield response to fertilizer based upon soil test. At the point of Critical level crop response / increase in yield is zero. What should also be understood is that in the replacement approach P fertilizer is still added even when soil test is in Optimum level. This also referred to as maintenance, or maintaining the current level of fertility by replacing removal. If your program is a replacement program this is not a recommendation to drop it completely. Over a period of time of high removal soil test P levels can and will be drawn down. But one year or even two years of fertilizing 100 bpa wheat based on sufficiency will not drop soil test levels. On average soils contain between 400 and 6000 pounds of total phosphorus which in the soil in three over arching forms plant available, labile, and fixed. Plant available is well plant available and fixed is non plant available. The labile form is intermediate form of P. When P is labile it can be easily converted to plant available or fixed. When a plant takes up P the system will convert labile P into available P. When we apply P fertilizer the greatest majority of was is applied makes it to the labile and fixed forms in a relatively short period of time. For more in-depth information on P in the soil you can visit the SOIL 4234 Soil Fertility course and watch recorded lectures Fall 2015 10 26-30 Link .
How to tell if your P recs have a replacement factor, not including calling your agronomist. First replacement recs are based on yield goal, so if you change your yield goal your rate will change. The other and easier way is to compare your rates to the table below. Most of the regional Land Grant Universities have very similar sufficiency recs for wheat. Another aspect of the sufficiency approach is the percent sufficiency value itself. The sufficiency can provide one more layer in the decision making process for those who are near the critical or 100% level. Response and likelihood of response to P is not equal. At the lowest levels the likelihood of response is very high and the yield increase per unit of fertilizer is the greatest. As soil test values near critical (32.5 ppm or 65 STP) the likelihood of response and amount of yield increase due to fertilizer P decreases significantly. At a STP of 10 the crop will only produce 70% of its environmental potential if P is not added while at a STP of 40 the crop will make 90% of its potential. The combination of % sufficiency and yield goal can be used to determine economic value of added P.

*From Oklahoma State University Soil Test Interpretations. Fact Sheet PSS-2225
*Based on Mehlich 3
*PPM (parts per million) is used by most labs
*STP (soil test P) is a conversion used by some Universities. Equivalent to pounds per acre.
* for a 0-6” in soil sample PPM * 2 = STP.
This data is available from OSU in multiple forms from the Factsheet PSS-2225, the SWFAL website, Pete Sheets quick cards, and the Field Guide App.

This year with margins tight soil testing is more important than ever before. Knowing the likelihood of response and appropriate amount of fertilizer to apply will be critical maximizing the return on fertilizer invest while maximizing the quality and amount of grain we can produce. Visit with your consultant or agronomist to discuss what the best approach is for your operation. Lets ride this market out, get the most out of every input and come out of this down cycle strong.
Feel free to contact me with any questions you may have.
Brian
b.arnall@okstate.edu

2015-16 Wheat Crop Nitrogen Review
From trials to phone calls (and text messages, and tweets, and ect. ect) I have gathered a fairly good picture of this years winter wheat nitrogen story. And as normal, nothing was normal. Overall I seen/heard three distinct trends 1) Did not take much to make a lot 2) took a ton to make a lot 3) saw a response (N-rich strip or cow-pow) but fertilizer never kicked in. Covers most of the options, doesn’t it.

The N-rich strips really came out over all very good this year. N-Rich Strip Blog. On average many of those using the N-Rich Strip and SBNRC (SBNRC Blog) producers have been getting in the neighborhood of 1.0-1.3 lbs of N applied per bushel produced. This year the numbers ran from 0.66 to 2.3 lbs of N per bushel. In both extremes I believe it can be explained via the field history and the N-Cycle.

Nitrogen Cycle Pete’s Sheet
In at least two fields, documented with calibrated yield monitors, the N-Rich Strip and SBNRC lead to massive yields on limited N. One quarter of IBA bumped 86 bpa average on 47 lbs of N while a second quarter, also IBA, managed 94 bpa average on about 52 units of N. We are currently running grain samples from these fields to look protein levels.
The other side of the boat were those with N-Rich strip calling for +2.0 lbs N per bushel. I had received notes from producers without N-rich strips saying that they could predict yield based on the amount of N applied and it was a 2 to 1 ratio. Not always but many of these high N demand fields where wheat following a summer or double crop or corn or sorghum. While many of the low N demand fields were wheat after wheat or wheat after canola. In a rotational study that had been first implemented in the 2014-15 crop year I saw big differences due to previous crop. The picture below was taken in early March. The straw residue in wheat after wheat had just sucked up the nitrogen. While it was evident the residue from the canola broke down at a much more rapid pace releasing any and all residual nutrients early.

The yield differences were striking. The canola rotation benefited the un-fertilized plots by 22 bpa and even with 90 lbs of N applied having canola in the rotation increased yields by 12 bpa. We are looking and grain quality and residual soil sample now. I am sure there will be a more indepth blog to follow.

Canola Wheat Rotation study year two yield average. yields average across previous years N-rates.
Another BIG story from the 2015-16 wheat crop was the lack of benefit from any N applied pre-plant. It really took top-dress N this year to make a crop. Due to our wet early fall and prolong cold winter N applied pre was either lost or tied up late. Work by Dr. Ruans Soil Fertility Program really documented the lack luster pre-plant N effect. The figure below shows 4 location of a rate by timing student. The number at the bottom of each graph is a rate by time (30/0 means 30 lbs Pre-0 lbs Top, 60/30 means 60 lbs Pre-30 lbs Top). At every single location 0/60 beat 60/0. Top-dress N was better than Pre-plant N.

Figure 1. Work from Ethan Driver and Dr. Bill Raun. Study looked at rate and timing of N fertilization in wheat. Treatments are ordered by total N applied.
The last observation was lack of response from applied N even though the crop was deficient. Seen this in both the NE and NW corners. I would hazard with most of the circumstance it was due to a tie up of applied N by the previous crops residue. The length at which the winter stretched into spring residue break down was also delayed.
Take Home
Here it is folks APPLY NITROGEN RICH STRIPS. Just do it, 18 years of research preformed in Oklahoma on winter wheat says it works. Hold off on heavy pre-plant N even if anhydrous is cheap. It does matter how cheap it is if it doesn’t make it to the crop. Will we see another year like 2015-16, do not know and not willing to place money on either side. What we do know is in Oklahoma split applying nitrogen allows you to take weather into account and the N-Rich strip pays dividends.
There are several fact sheets available on top-dressing N and the application of N-Rich strips. Contact your local Oklahoma Cooperative Extension Service county educator to get a copy and see if they have a GreenSeeker sensor on hand.
DAP vs MAP, Source may matter!
Historically the two primary sources of phosphorus have had different homes in Oklahoma. In general terms MAP (11-52-0) sales was focused in Panhandle and south west, while DAP (18-46-0) dominated the central plains. Now I see the availability of MAP is increasing in central Oklahoma. For many this is great, with MAP more P can be applied with less material. which can over all reduce the cost per acre. There is a significant amount of good research that documents that source of phosphorus seldom matters. However this said, there is a fairly large subset of the area that needs to watch what they buy and where they apply it.
If you are operating under optimum soil conditions the research shows time and time again source does not matter especially for a starter. In a recent study just completed by OSU multiple sources (dry, liquid, ortho, poly ect ect) of P were evaluated. Regardless of source there was no significant difference in yield. With the exception of the low pH site. The reason DAP was so predominate in central Ok, soil acidity. See an older blog on Banding P in acidic soils.
Figure 1. The cover of an extension brochure distributed in Oklahoma during the 1980s.
When DAP is applied, the soil solution pH surrounding the granule will be alkaline with a pH of 7.8-8.2. This is a two fold win on soil acidity aka aluminum (Al) toxicity. The increase in pH around the prill reduces Al content and extends the life of P, and as the pH comes back down the P ties up Al and allows the plant to keep going. However, the initial pH around the MAP granule ranges from an acid pH of 3.5-4.2. There is short term pH change in the opposite direction of DAP, however the the Al right around the prill becomes more available and in theory ties up P even faster.
Below is a table showing the yield, relative to untreated check, of in-furrow DAP and MAP treatments in winter wheat. The N401 location had a ph 6.1 while Perk (green) has a pH of 4.8. At Perkins in the low pH, both forms of P significantly increased yeild, almost 20 bushel on the average. DAP however was 5 bushel per acre better than MAP. At the N40 site the yield difference between the two sources was 1 bushel.
Relative yield winter wheat grain yield MAP and DAP both applied at equal rates of P (32 lbs P2O5 ac) when compared to a untreated check.
In general it can be said that in acid soils DAP will out preform MAP while in calcareous high pH soils MAP can out preform DAP. So regarding the earlier statement about the traditional sales area of MAP or DAP if you look at the soil pH of samples went into the Oklahoma State University Soil, Water, and Forage Analytical lab the distribution makes since.

Average soil pH of samples sent into OSU soil water forage analytical lab by county.
In the end game price point and accessibility drives the system. In soils with adequate soil pH levels, from about 5.7 to around 7.0, get the source which is cheapest per lbs of nutrient delivered and easiest to work with. But if you are banding phosphorus in row with your wheat crop because you have soil acidity, DAP should be your primary source.
