Home » Posts tagged 'Nutrient Management'
Tag Archives: Nutrient Management

Yellow Wheat the 2020 Edition.
I have been trying to write this blog addressing the yellow wheat for about two weeks now. But with finally finding a dry”ish” day or two and a lot of calls and emails about yellow wheat, I am just now getting to it.
So the short story is there is a lot of wheat out there in the state that is show signs of chlorosis, or yellowing. I wish I could say I have all the answers for you in this article, but I will have to lay heavily upon the agronomist best answer, “Well it Depends.”.
Cow pox showing up in a wheat field in Kay County.
First we will start with the things I know least about and then move on to things that are more in my wheelhouse. In the last two weeks I have been on multiple email strings trying to chase down the cause of chlorosis in fields all over the state. One of these included Dr. Bob Hunger and the Plant Disease & Insect Diag Lab (PDIDL) and in one field his final thought was “So, my best guess is cold and wet soils along with fungi colonizing the older leaves that are starting to senesce.” At the same time I am finding regular occurrence of Tan Spot and Leaf Rust increase. All these pathogen cause some level of chlorosis and if you do not get down and pull some samples you will never know the cause.

Originally thought to be leaf rust, but corrected by Dr. Hunger who suggested it is early stages of striped rust, found in Stillwater Oklahoma 3.27.2020.
A new for me this year is what I am calling the herbicide ding. I was able to get over a lot of my wheat that first week of March with a shot of herbicide, everything was almost to hollowstem. The wheat really got dinged. Very visual yellowing and stunting of the plants. Talking with Dr Manucheri, she had seen the same thing in her plots in Tipton. I have also visited several farmer fields with the same symptoms. Dr. Manucheri shared with me the Finesse label. Directly from the label “Temporary discolorations and/or crop injury may occur if herbicide is applied when the crop is stressed by severe weather conditions (such as heavy rainfall, prolonged cold weather, or wide fluctuations in day/night temps), disease or insect damage, low fertility, applications to course soils, or when applied in combination with surfactant and high rates of liquid fertilizer solutions.” This can be found on page 5, http://www.cdms.net/ldat/ldFSL002.pdf . You can just about mark off every weather and application condition mentions, on the same field.
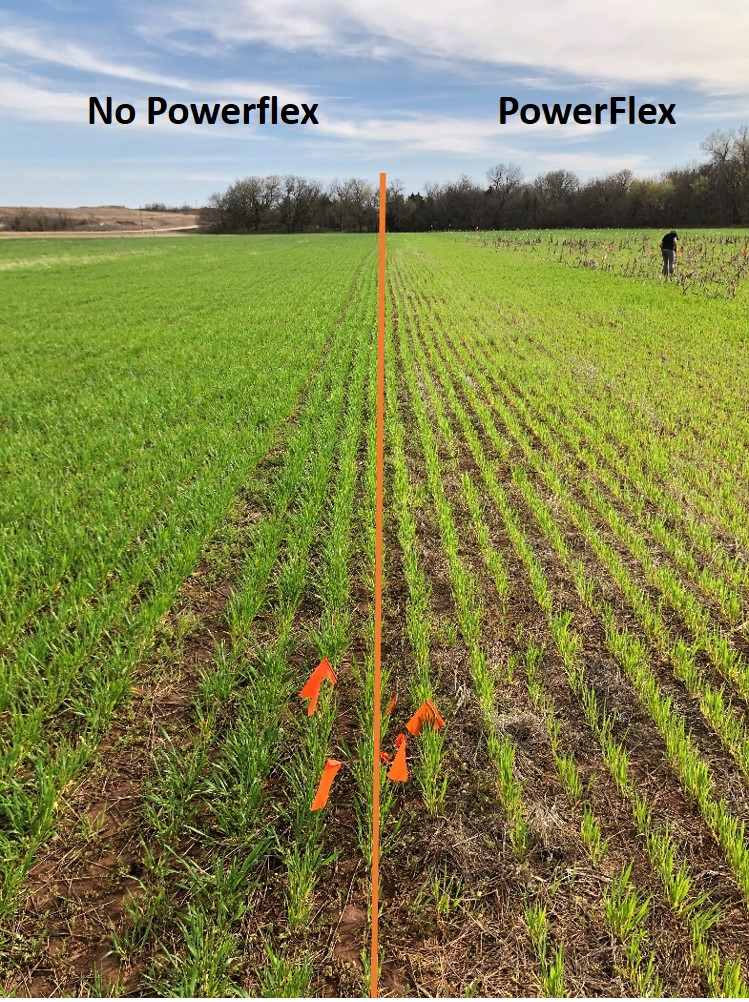
Image collected 3.25.20. The right side was treated with Powerflex on 3.5.20. The left side was not treated so that sorghum could be planted in April.
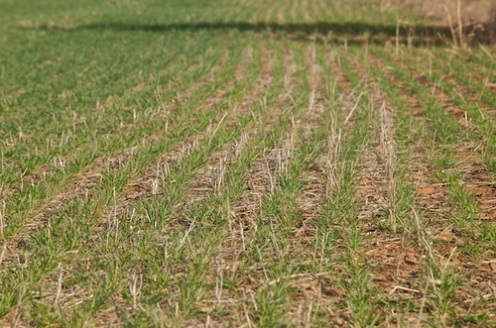
Now to the yellow wheat I can comfortably talk about. There is nitrogen deficiencies out there. That should not come as a shock with the amount of rain we have received over the last couple months. I also believe that a fair amount of the wheat crop out there is a bit lacking on roots department.

The overarching wet cools soils that we have more than likely have led to reduced root exploration in some areas. And if you combine short roots with a nitrate leaching then the probability of N being out of the reach of the crop is high. Then the question is “Is there still time to do anything?”. The trip I look over the weekend (3/28, 3/29) that encompassed a great deal of the North Central Ok wheat belt showed me that the majority of the wheat had really progressed physiologically in the last two weeks. At this point, a positive return on N investment hinges on the stage the wheat is at.
Our delayed N work over the past several years show that we have maintained the yield on our trials even when fertilizer was delayed into the first week of April. https://osunpk.com/2019/08/14/how-long-can-wheat-wait-for-nitrogen-one-more-year-of-data/

Each graph is from a location where the delayed N study was preformed. The objective of our study was to determine the impact of prolonged nitrogen deficiency on winter wheat grain yield and protein. Eight studies were conducted with 11 N application timings in no-till dryland conditions. A pre-plant treatment of 90 lbs ac-1 of N was broadcast applied as ammonium nitrate (AN). We used AN as our source because we wanted to measure the crops ability to recover and eliminate the impact of source efficiencies. When visual symptom differentiation (VSD) was documented between the pre-plant and the non-fertilized check, i.e the N-Rich Strip showed up, top-dress applications were performed every seven growth days (GDD> 0) (https://www.mesonet.org/index.php) until 63 growth days after VSD at all sites. The only N the treatments received where applied according to treatment structure. No pre-plant N was applied on the trials other than the Pre-plant treatment.

This table shows the application dates of the 10 site years of the delayed nitrogen study. The first column is the location, to the right of the location is two rows the top is grain yield and the bottom is grain protein. Each of the following columns corresponds to an application date. Applications began at each study when the The colors are related to whether that application was statistically (Alpha=0.05) worse than, equal too, or better than applying nitrogen at the first sign of deficiency (0DAVD). For this comparison it is important to know that at no location did preplant have significantly greater yield than 0DAVD.In the majority of those years that first week of April corresponded with the growth stage Feekes 8, last leaf just visible. As the crop moves beyond that point, catching up did not happen. Currently there is wheat out there in the state that has not hit hollow stem (Feekes 6) and there is wheat at Flag leaf (Feekes 9).

The Feekes Scale focused in on the stem extension growth phase. The period extends from hollow-stem (Feekes 6) to boot (Feekes 10).
The high rainfall totals we have could have also led to another deficiency sulfur. In the past S deficiency is fairly hard to find in Oklahoma. Our long history of low S using winter wheat and high sub-soil S levels have kept the response to Sulfur low, but not uncommon. Sulfur is a mobile nutrient and will also be lost via leaching especially in sandy soils in the northern part of the state. Sulfur deficient is different from N in that it shows in the newer growth as a general yellowing of crop. Kansas State has a lot of great resources on sulfur management in wheat. https://webapp.agron.ksu.edu/agr_social/m_eu_article.throck?article_id=2132
https://bookstore.ksre.ksu.edu/pubs/MF2264.pdf
Sulfur deficiency in wheat. Photos by Dorivar Ruiz Diaz, K-State Research and Extension
If your wheat is yellow and before you call the fertilizer applicator, first confirm it is nitrogen and or sulfur and not something else. A key point to nitrogen deficiency is that the cholorsis will be worst on the oldest leafs while new growth is green. If N deficiency is confirmed then figure out how far along your wheat is. If the crop is around hollow stem to Feekes 8, if you can get the N on soon there is a good chance to get your money back plus. Keep in mind with air temps above 60 degrees UAN will burn the tissue so it is best to use streamer nozzles, which will still burn but the tissue damage is lessened. If you do not have access to streamers you can dilute the UAN with water and use flat fan nozzles. Cutting the UAN with water reduce the impact of leaf burn, I typically recommend at least 2 part UAN to 1 part water, but a 1 to 1 is the safest.

Image of wheat with forage burn from UAN applied with streamer nozzles. Application was made two days prior with air temps where above 80 degrees.
If you have any questions or concerns please feel free to email any questions you may have.
Brian Arnall
b.arnall@okstate.edu
Herbicide and UAN tank mixed for top-dress
Spring is the time that many wheat producers apply herbicide and nitrogen (N) fertilizer. For many this can be accomplished in a single pass by tank mixing the herbicide and UAN. In most cases this is an effective practice which eliminates one pass over the field. There are some scenarios in which this practice is ill advised. One such scenario is high temperatures which would lead to excessive leaf burn and crop damage. The other scenario is no-till and that will be the focus of this article. Ruling out warm temperature tank mixing herbicides and nitrogen, assuming the herbicide can be tank mixed, is a good practice. No-till on the other hand can be a different issue.
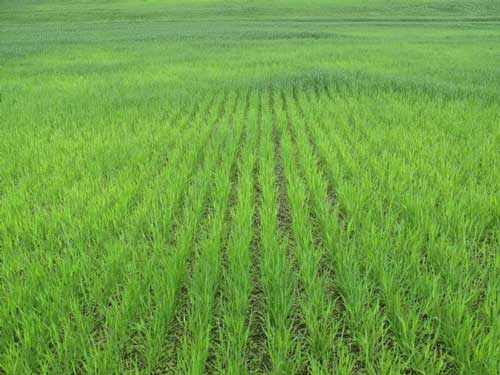
Situations with a lot of residue and smaller wheat is common during top-dress.
The problem in no-till comes from the liquid application method needed to apply herbicides, flat flan. To get a good kill with the herbicide the spray pattern needs to have good coverage, i.e a lot of small droplets to ensure maximum surface area impacted. Unfortunately there are four primary fates of UAN when applied via flat fan nozzles. The UAN could be taken directly up into the wheat plant via absorption through the leaves, the UAN could reach the soil and go into the soil solution or absorbed onto the soil itself, the UAN can be taken up by weeds, or the UAN droplet may hit dead plant tissue and be adsorbed into the residue.
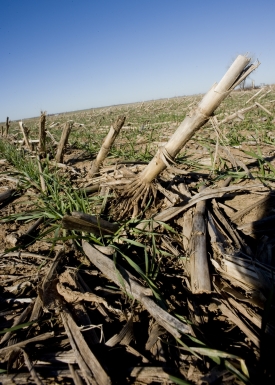
UAN applied with a flat fan will hit a growing plant, the soil, or residue.
The fourth fate of UAN presented is what can make the tank mix less efficient than a two pass system. In a no-till system any UAN that hits residue should be counted as lost, for the short term. The decision to go with a one pass or two pass system can be aided by evaluating the amount of canopy coverage. For example if the no-till field has 50% canopy coverage then one could estimate 50% of the UAN applied via a one pass system would be tied up in the residue. The cost of a second application could then be compared to the lost N. If 15 gallon of 28-0-0 was being applied then approximately 22.5 lbs of N would be tied up by the straw. At a price of $0.40 per lb on N, that is $9.00 worth of N. Conversely if the canopy coverage was 80% only 20% or 9 lbs of N would be tied up in the residue. Saving the $3.60 in nitrogen would not justify a second trip over the field. Luckily OSU recently released the Canopeo app which uses a cell phones camera to take pictures and quickly and accurately determine % canopy coverage. Canopeo is available for iOS and android http://canopeoapp.com/.


In fields with a high amount of residue or limited canopy coverage UAN should be applied with streamer nozzles. This will concentration the fertilizer into streams which will allow the UAN to have enough volume to move off the residue and into the soil.


So as the decision is being made to tank mix herbicide and UAN or make two passes take into consideration: % canopy coverage, rate of UAN (how much could be lost), cost of UAN per pound, and cost of a second trip over the field.
Below is an excerpt from the publication Best Management Practices for Nitrogen Fertilizer in Missouri; Peter C. Scharf and John A. Lory. http://plantsci.missouri.edu/nutrientmanagement/nitrogen/practices.htm
Broadcasting UAN solution (28 percent to 32 percent N) is not recommended when residue levels are high because of the potential for the N in the droplets to become tied up on the residue. Dribbling the solution in a surface band will reduce tie-up on residue, and knife or coulter injection will eliminate it. Limited research suggests that the same conclusions probably apply for grass hay or pasture. Broadcast UAN solution is also susceptible to volatile loss of N to the air in the same way as urea, but only half as much will be lost (half of the N in UAN solution is in the urea form).


Results from 1st year of Soybean Starter Work
In the spring of 2014 we initiated what was to be the first year of a three year project evaluating starter fertilizers for soybean production in the southern Great Plains. The first and second year was and is being funded by the Oklahoma Soybean Board.
Year one was a bit experimental in that with so many products on the market we needed some initial work to help focus the direction for years two and three. I also added a treatment which I knew would have significant negative impact, for extension reasons. Keep in mind two locations in a single year does not make an experiment nor provide enough information to draw a definite conclusion. It is however enough to learn some lessons from and for us to plan for our 2015 trials.
The 2014 trial consisted of 12 treatments, Figure 1 and Figure 2. In these treatments I wanted to see the impact of a standard practice, see if a specific nutrient may be more so beneficial, and evaluate a few popular products. The spring of 2014 started out dry so at one of our two locations we pre-watered. This was done by hauling water to the Lake Carl Blackwell (LCB) 1000 gallons at a time and pumping through sprinklers. The other site, Perkins, we delayed planting until we had moisture.

Treatment Structure and rates for the 1st year of the Soybean Starter Study.

List of fertilizers and products used.

Image taken while planting the Soybean Starter study at Perkins. A CO2 system was used to deliver starter fertilizers with seed.
The two locations were also selected due to differences in soil fertility. The LCB site is has good soil fertility, with exception of phosphorus (P), and the Perkins site pH was an issue. I would have expected a benefit from adding P at both of these locations. Figure 4 shows the soil test results.

Soil Test results from LCB and Perkins.
At LCB as expected some of the treatments (Thio-Sul) reduced stand, some unexpectedly reduced stand (Fe) and others had less impact on stand (APP 5.0) than expected. The growth at LCB was tremendous, the 30 in rows covered over very quickly and the majority of the treatments hit me waist high by early August (I am 6’0”). Many of the treatments showed greater growth than check. But when it comes down to it, grain pays and green does not. Statistically there were no treatments that out preformed the un-treated check, however the K-Leaf and 9-18-9 did make 3 and 2 bpa more than the check respectively. What I am hypothesizing at this site is that the added nutrients, especially those with high P levels, significantly increased vegetative grown and these big plants were delayed into going reproductive and they started setting pods later in much hotter weather. While riding in the combine I could see that the plots with compact plants with clearly defined rows out yielded those were the vines had crossed over and we harvested through more of a solid mat of mature plants. A hot August is not uncommon and I am curious on whether this trend repeats itself. If it does this may direct us into research evaluating ways to force/promote the reproductive stage to start in these big plants. Even if we can force flowering to start earlier, it’s unknown whether yields will increase or not.
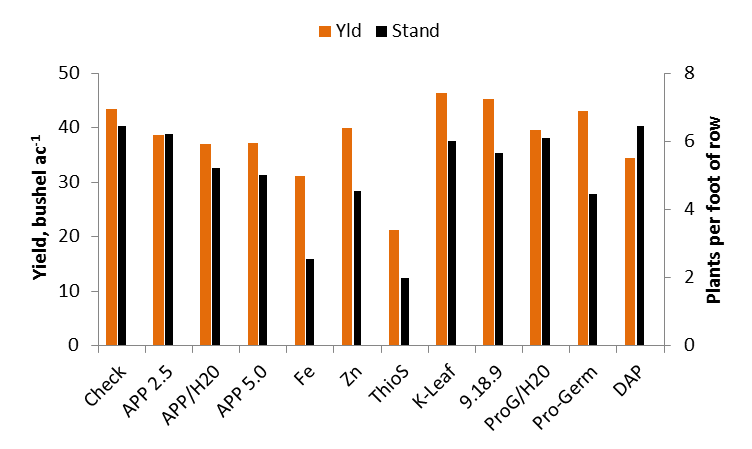
Yield and Stand counts from the 2014 LCB Soybean Starter Study.

The Check plot at LCB were plants noticeably a bit smaller and more yellow than the neighbors with phosphorus.

Soybeans at LCB on August 4th.
The same trends in treatments reducing stand can be seen at Perkins, however the impact was less extreme. Perkins being planted later due to waiting on moisture forced a later flowering date and I believe reduced overall yields. But the addition of P at this low pH site definitely made a difference. While again no treatments were statistically greater than the un-treated check the 2.5 gpa APP, DAP broadcast, APP/H2O, and Pro-Germ/H20 treatments increased yield by 5.6, 4.2, 3.8 and 1.7 bpa respectively.

Yield and Stand Counts from the Perkins 2014 Soybean Starter Study.
Take home from year one was that at LCB the addition of a starter fertilizer had little benefit and if done wrong could cost you yield while at the low pH site of Perkins an addition 2.5 gallons of APP did get a 5 bpa bump, but do to variability in the trial the increase was not statistically significant. This year we will drop some of the treatments and incorporate a few new treatments. Based on the current weather we look to potentially being able to start with better soil moisture at planting. Again do not take this work and significantly adjust any plans you have for your 2015 soybean crop. This is however some interesting findings that I wanted to share and make everyone aware of. Finally thank you to the Oklahoma Soybean Board for providing funding for this work. www.oksoy.org/
Nutrient Products: Stabilizers, Enhancers, Safeners, Biologicals and so on.
In this blog I am not going to tell you what to use or what not to use. In fact I will not mention a single product name. What I will do is hopefully provide some food for thought, new knowledge and direction.
First I want to approach a topic I have been called out on several times. I believe there is a stigma that University researchers and extension specialists do not want products to work. It may seem that way at times but it is far from the truth. The reality is that all of us are scientists and know someone may be inventing the product that changes nutrient management as we speak. The issue is that most of us have been jaded. While I may be younger I have over 11 years experience, testing “products” in the field, and that includes dozens of products. I have sprayed, spread, tossed, drilled, mixed and applied everything under the sun, with hopes that I will see that one thing I am always looking for, MORE GRAIN…
The truth is Everything works Sometimes yet Nothing works ALL the time. I and others in my profession do not expect anything to work 100% of the time, I am personally looking for something that will provide a checkmark in the win column 50% of the time. A win is the result of one of two things, more money in the producers pocket or less nutrients in the water or air. Products can increase vigor, nutrient uptake, chlorophyll concentration, greenness but not yield. What Co-op or elevator pays for any of those attributes? Grain makes green.


So many safeners, stabilizers, enhancers, biologicals, and on and on are available, so what should a producer do? Here are few things to think about. Ask yourself “ what part of my nutrient management plan can I get the most bang from improving”?
If the answer is Nitrogen (N) there are three basic categories: Urease inhibition, Nitrification inhibitor, and slow release. All are methods of preventing loss; the last two are preventing loss from water movement.
Urease inhibitors prevent the conversion of Urea to NH3 (ammonia). This conversion is typically a good thing, unless it happens out in the open. Ideally any urea containing product is incorporated with tillage or rain. However, in No-till when urea is broadcast and no significant rainfall events (>0.5”) occur, N loss is likely. The urea prill starts dissolving in the presence of moisture, this can be a light rain or dew, and urease starts converting urea into NH3. As the system dries and the day warms, if there was not enough moisture to move the NH3 into the soil the wind will drive NH3 into the atmosphere. Nitrogen loss via this pathway can range from 5% to 40% of the total N applied.
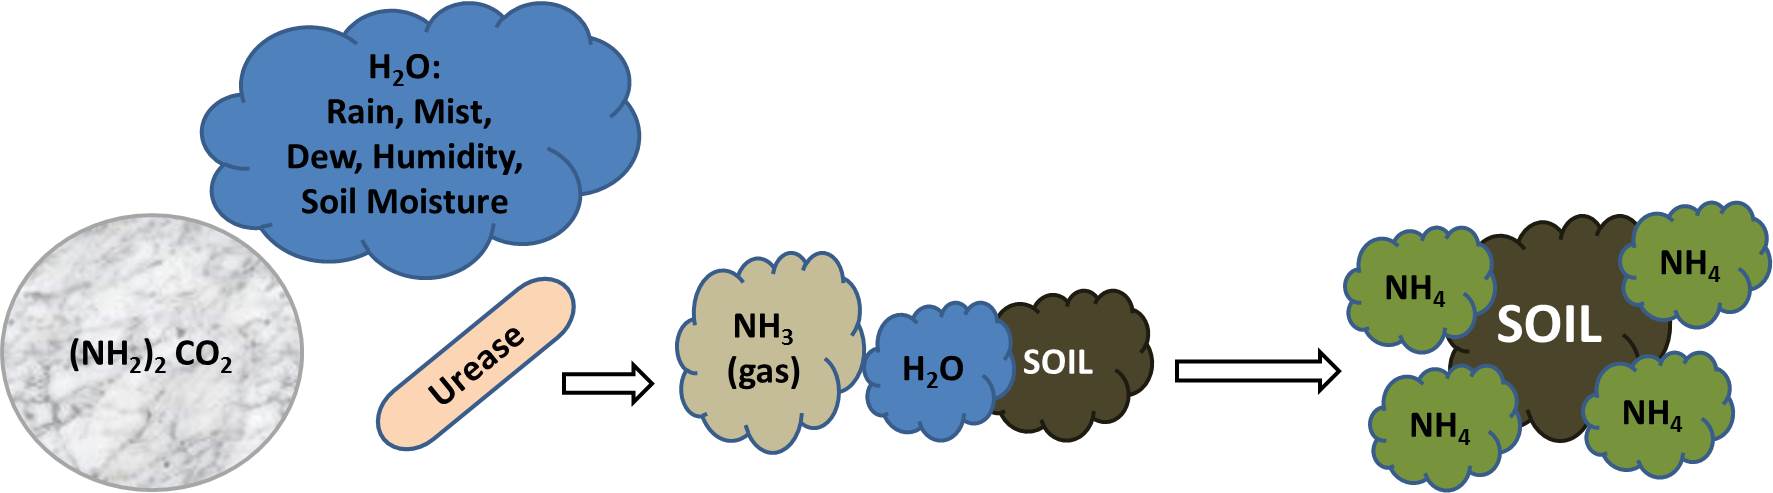
Graphic of Urea’s conversion to plant available ammonium.

Urea placed on a wet soil under two different temperatures. Number in white is hours after application.
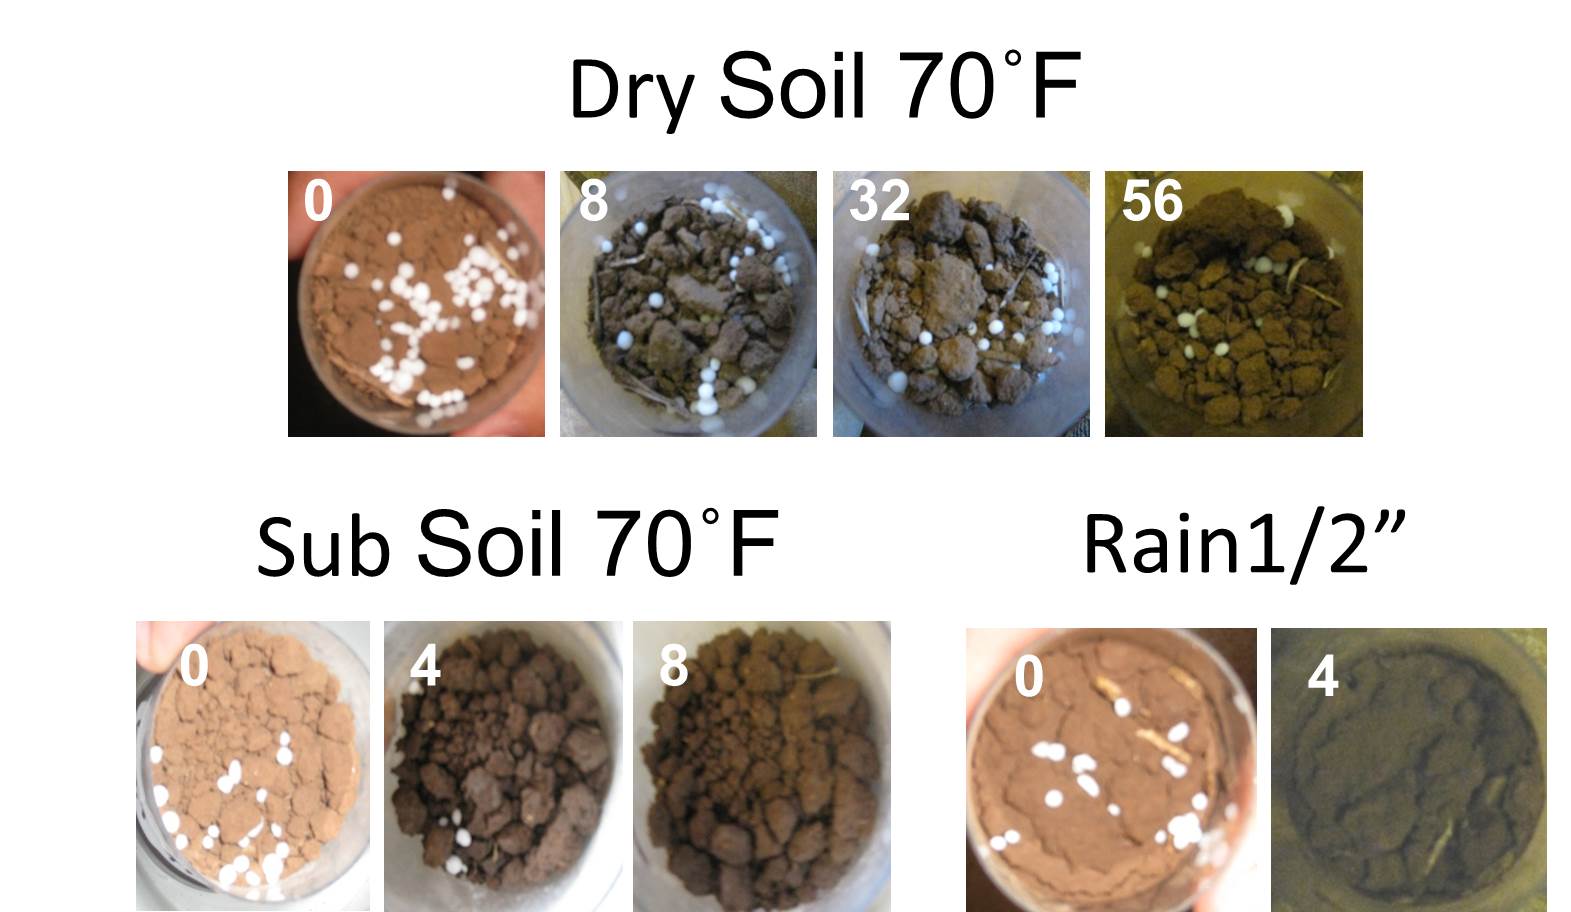
Urea placed on a dry soil, on top no water added, bottom left is moisture from the subsurface, and bottom right is simulated rain fall of 1/2″. Number in white is hours after application.
Nitrification inhibitors prevent the conversion of NH4 into NO3. Both are plant available N sources but NH4 is a positively charged compound that will form a bound with the negatively charged soil particles. Nitrate (NO3) is negatively charged and will flow with the water, in corn country that tends to be right down the tile drainage. Nitrate will also be converted to gasses under wet water logged soil conditions. Nitrate is lost in the presence of water, this means I do not typically recommend nitrification inhibitors for western OK, KS, TX dryland wheat producers.
Slow release N (SRN) comes in a range of forms: coated, long chain polymer, organic and many versions in each category. Again, water is the reason for the use of SRN sources. Slow release N whether coated or other have specific release patterns which are controlled by moisture, temperature and sometimes microbes. The release patterns of SRNS are not the same and may not work across crops and landscapes. For instance in Oklahoma the uptake pattern of nutrients for dryland corn in the North East is not that same as irrigated corn in the West. The little nuances in the growth pattern of a crop can make or break your SRN.
While N products have been on the market for decade’s phosphorus enhancers and stabilizers are relatively new, resulting in many of my peers holding back on providing recommendations until field trials could be conducted. At this point many of us do have a better understanding of what’s available and are able to provide our regional recommendations. Phosphorus products are not sold to prevent loss like their N counterparts; they are sold to make the applied P more available. On a scale of 1 to 10, P reactivity with other elements in the soil is a 9.9. If there is available Ca, Mg, Fe, or Al, phosphorus is reacting with it. In the southern Great Plains it is not uncommon for a soil to have 3,000-5,000 lbs of available Ca, a soil with a pH of 4, yes we have many of those, will have approximately 64,000 lbs of Al in the soil solution. That’s a lot of competition for your fertilizer P and for any substance that is trying to protect it.
I have been testing “biologicals” of all shapes and forms since 2003. While I have not hit any homeruns I have learned quite a bit. Many of these products originate from up north where the weather is kind and organic matter (OM) is high. Where I work the average OM is 0.75% and soil temp is brutal and unforgiving. Our soil does not have many reserves to release nor is it hospitable to foreign bodies.

Soil temperature for Stillwater OK under sod and bare soil conditions. Graph from http://www.Mesonet.org.
I hope you are still hanging on as this next topic is a bit of a soap box for me. Rate, Rate, Rate this aspect is missed both by producers and academia and it drives me crazy. If your crop is sufficient in any growth factor adding more will not increase yield. It goes back to Von Liebig’s LAW of the Minimum. I see too many research studies in which products are tested at optimum fertilization levels. This is just not a fair comparison. On the other hand, time and again I see producers sold on a product because they applied 30% less N or P and cut the same yield. If you let me hand pick 100 farms in Oklahoma I could reduce the N rate by 30% of the average and not lose a bushel on 75 of the farms. Why? Because the rate being used was above optimum in the first place, there is no magic just good agronomy. The list of products that increase the availability of nutrients is a mile long. Increasing nutrient availability is all well and good if you have a deficiency of one of those nutrients. If you don’t, well you have increased the availability of something you did not need in the first place.
University researchers and extension professionals seem to live and die by the statistics, and are told so regularly. We do rely upon the significant differences, LSD’s, and etc to help us understand the likely hood of a treatment causing an effect. However if I see a trend develop, or not develop, over time and landscape regardless of stats I will have no problem making recommendations. The stats help me when I do not have enough information (replications).
Too wrap up, have a goal. Do not just buy a product because of advertised promises or because a friend sells it. There is a right time and place for most of the things out there, but you need to know what that is and if it suits your needs. I also recommend turning to your local Extension office. We do our best to provide unbiased information in hopes of making your operation as sustainable as possible. If you are looking at making sizable investments do some reading, more than just Google. Testimonies are great but should but should not be enough to cut a check. Google Scholar www.google.com/scholar is a good resource for scientific pubs. I have done my best to put together a list of peer reviewed publications and their outcomes. To make the review work I had to be very general about outcome of the research. Either the product increased yield or decreased environmental losses or it had no impact. This was not easy as many of the papers summarize multiple studies. I did my best to make an unbiased recommendation but some could be argued. http://npk.okstate.edu/Trials/products/Product_Peer_Review.8-21-2014.pdf
2014 Harvest has wrapped up.
The last of the Precision Nutrient Management winter crop harvest was wrapped up in Chickasha June 25. Across the trial locations (Lahoma, Perkins, Chickasha, and Stillwater) the yields came in across the board in the high teens low twenties, bushel per acre. For most of the trials there was very little treatment difference, often the check ( Zero N) was not far from the fertilized plots. At this time the students are processing the grain. Some will be sent to a NIR Spectrophotometer for protein analysis the rest will be ground and analyzed for nitrogen and mineral content. The response to fertilizer was so low this year many of my trial areas have a double crop sorghum growing, in hopes to take advantage of the recent rains and harvest the residual nutrients. While I am processing the data and the students are running the samples I thought I would share a few of the images from the 2014 harvest. I will post results on the npk.okstate.edu as the become available and share the information on this blog. The best way to learn when results are posted are to follow me on Twitter @OSU_NPK or subscribe to our Extension news list serve (send me an email at b.arnall@okstate.edu to be added to the listserv).
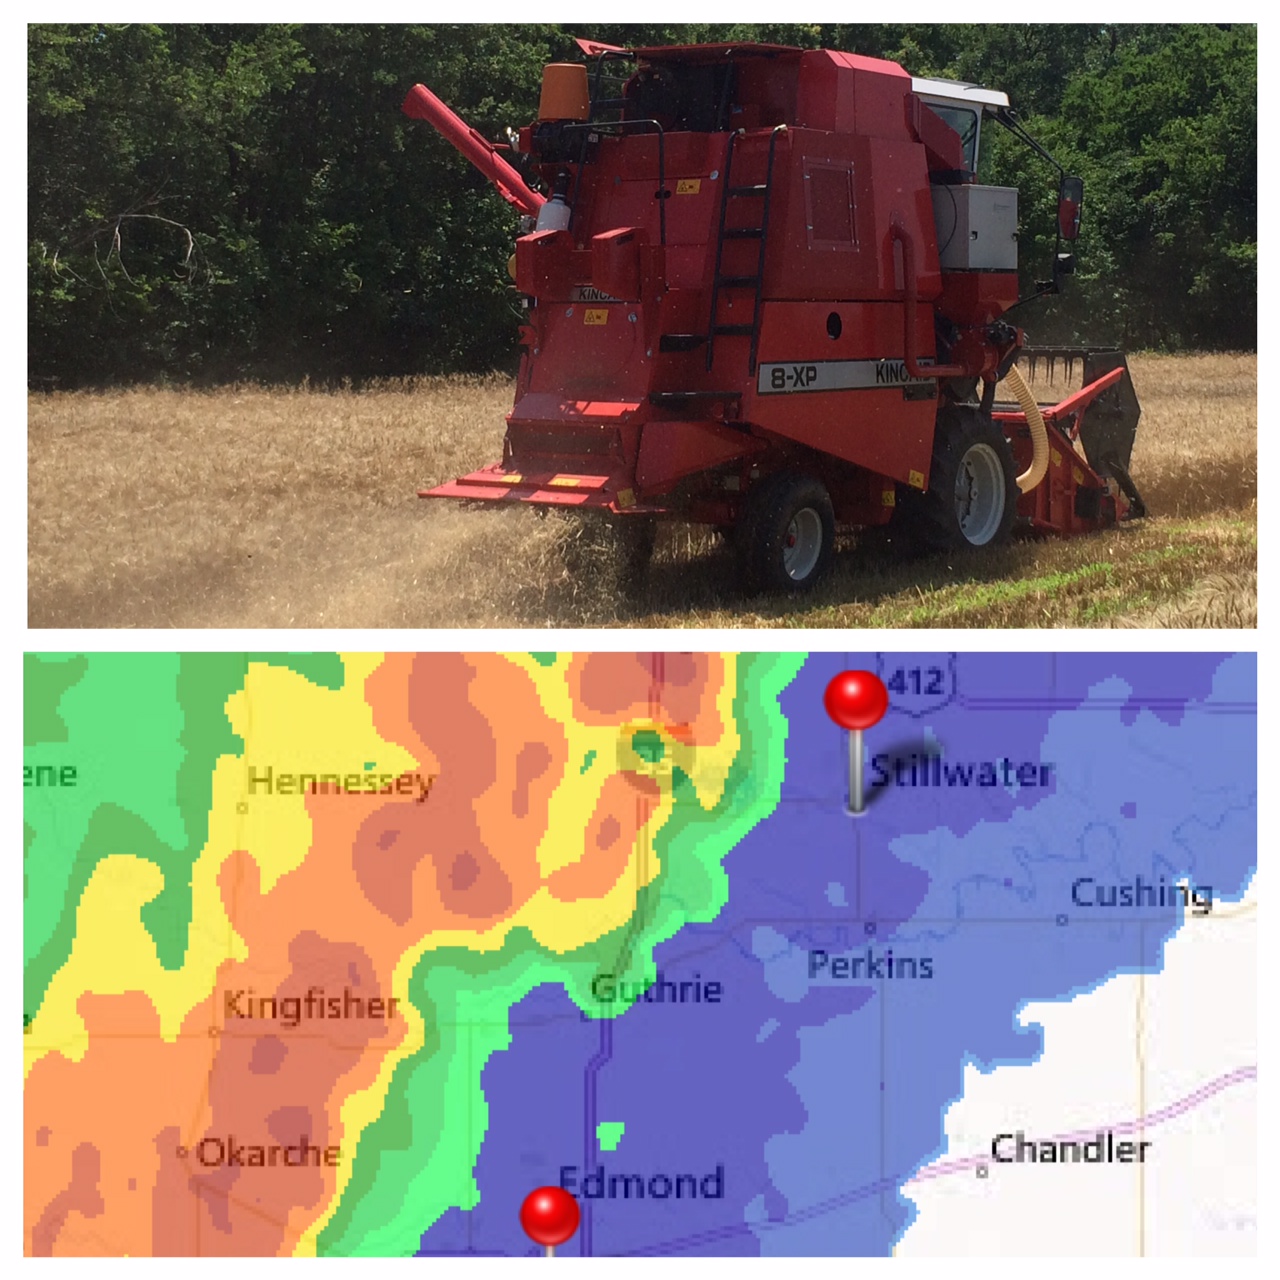
This harvest was spent watching the radar and going where the weather allowed.
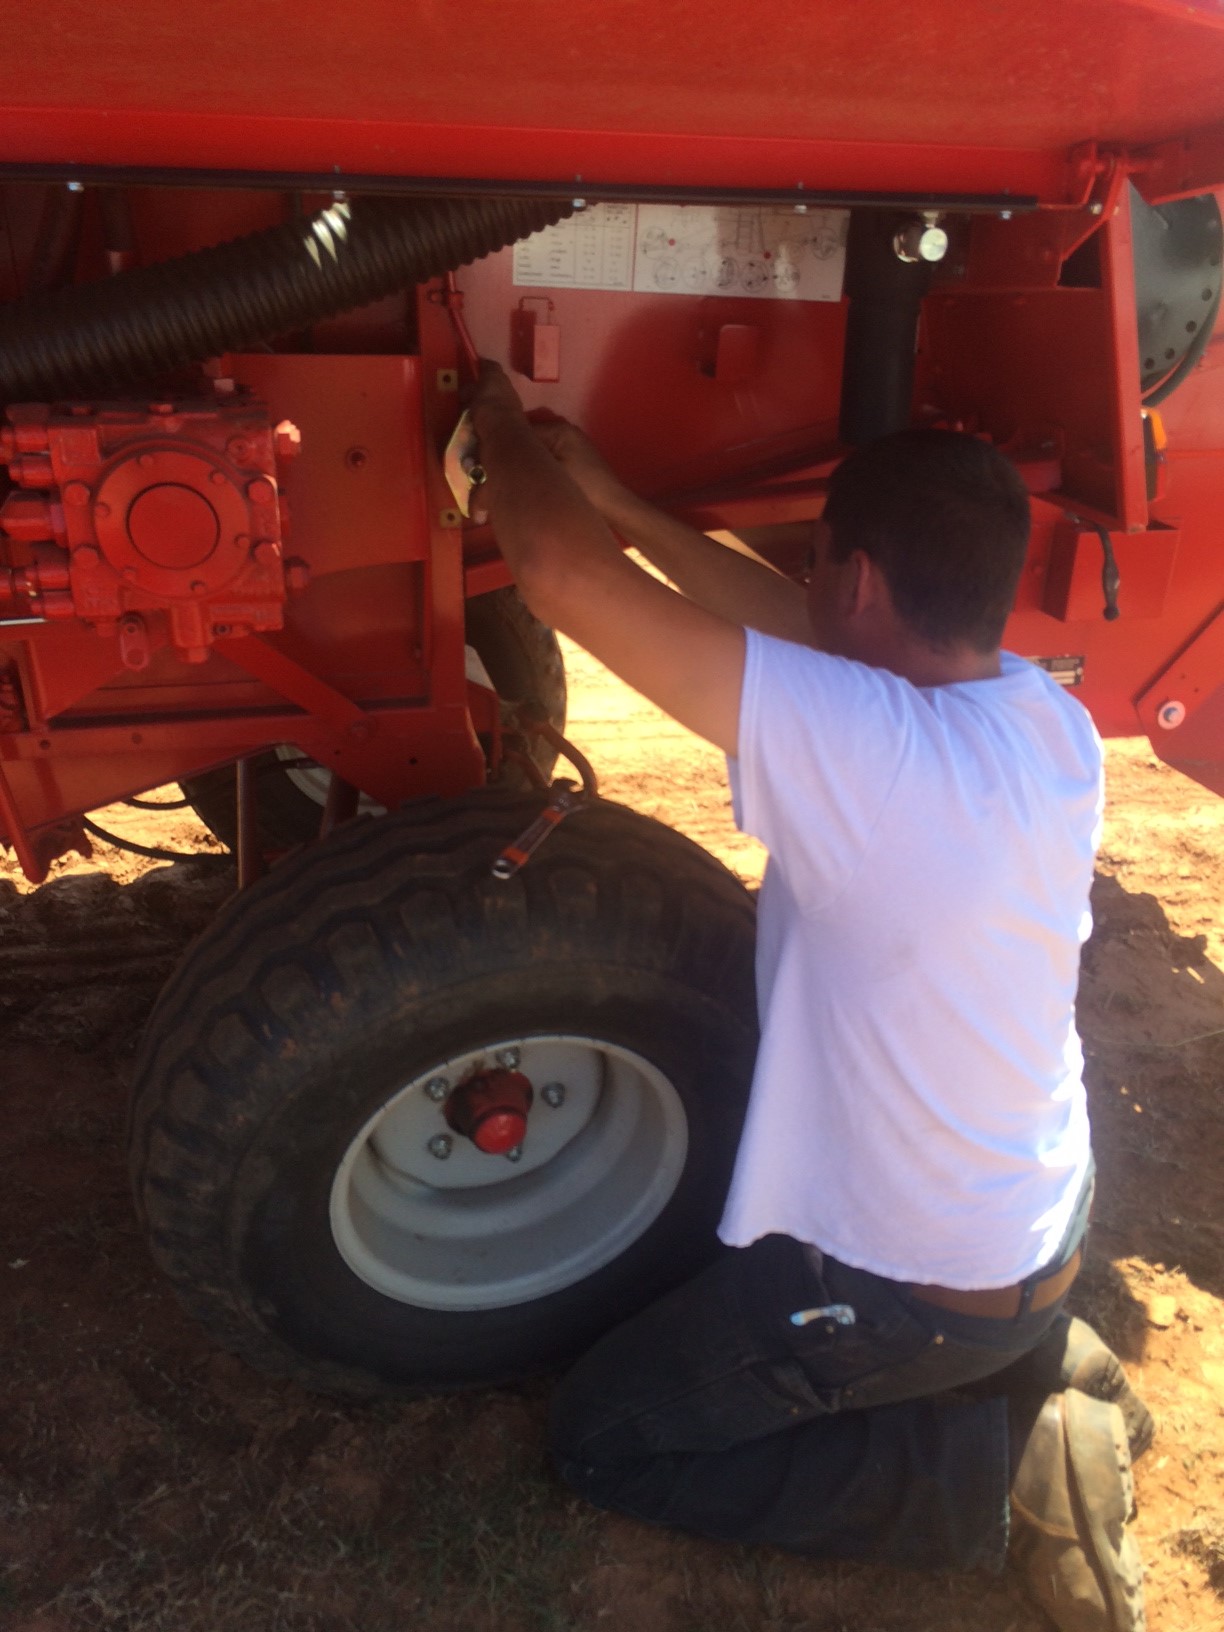
Even a new machine needs a few in field “Modifications”
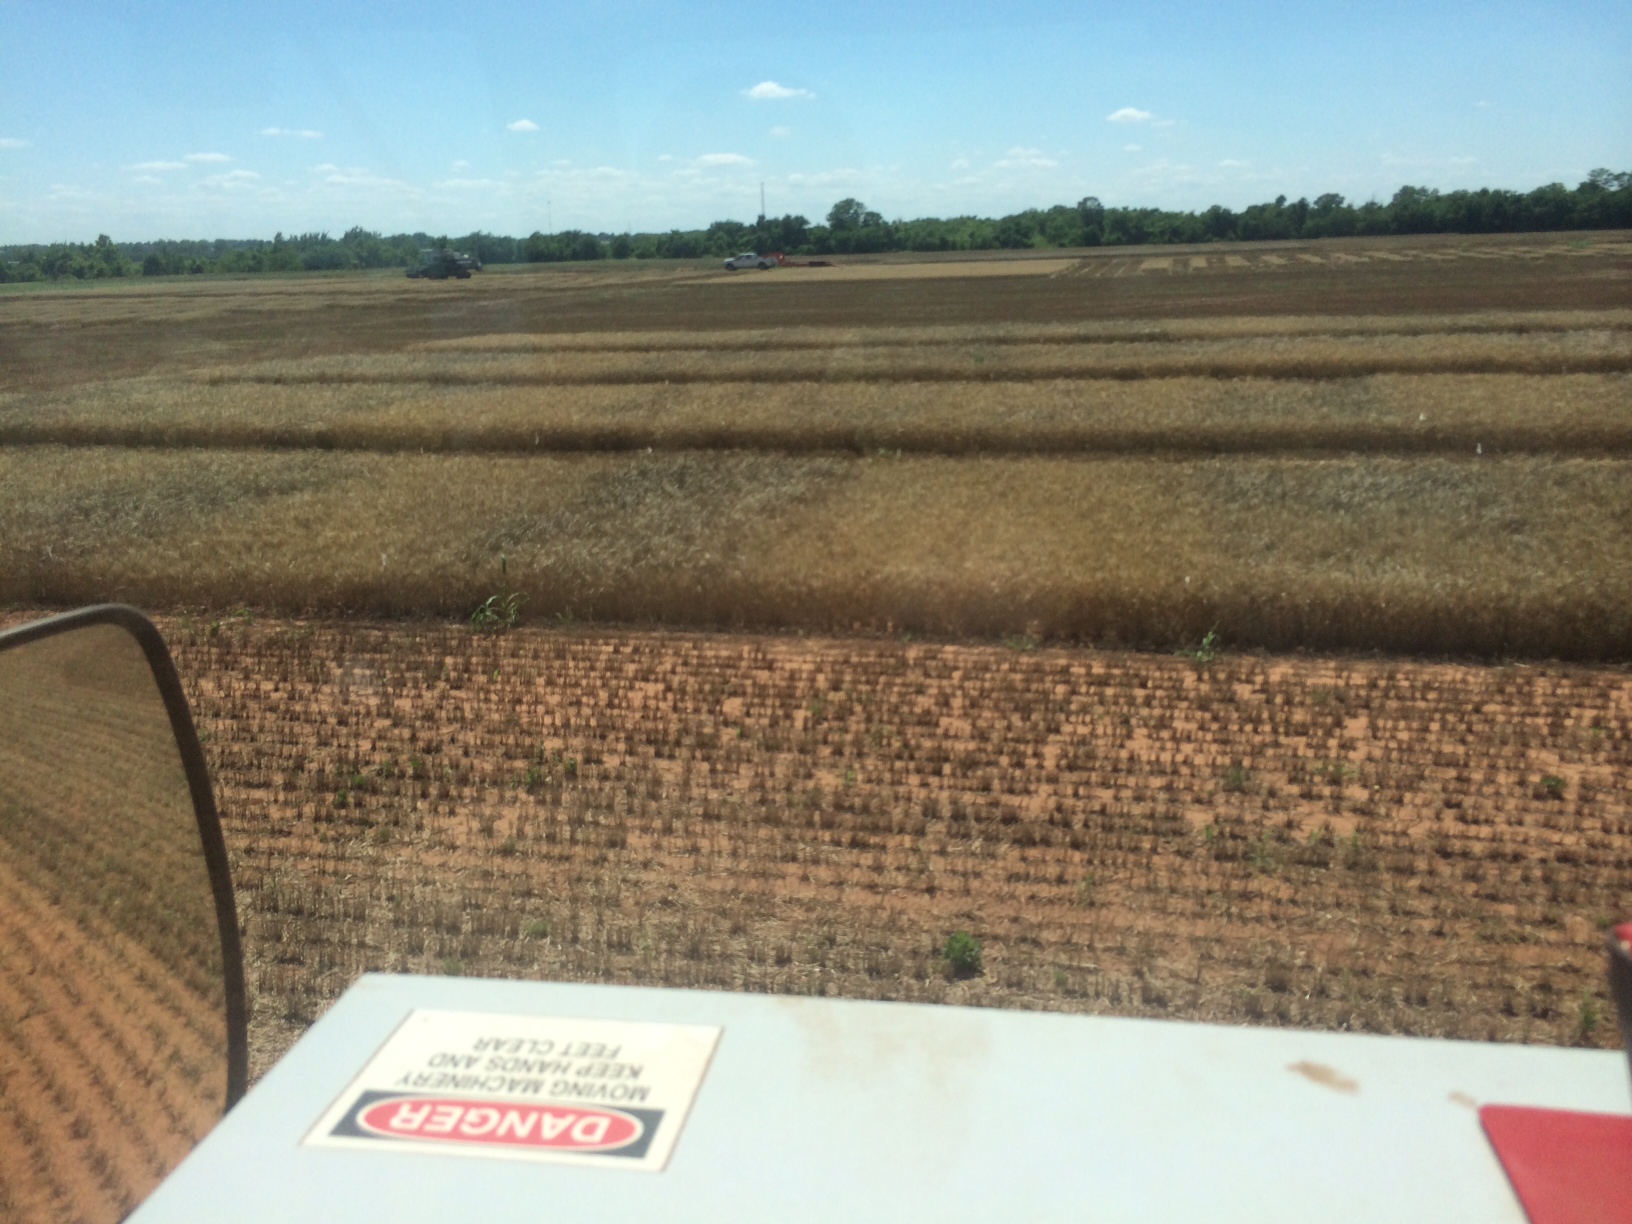
In this you can see the impact of fertility on freeze damage. The dark plots survived the freeze, the light did not and were full of smaller tiller heads. In the end no major yield differences.
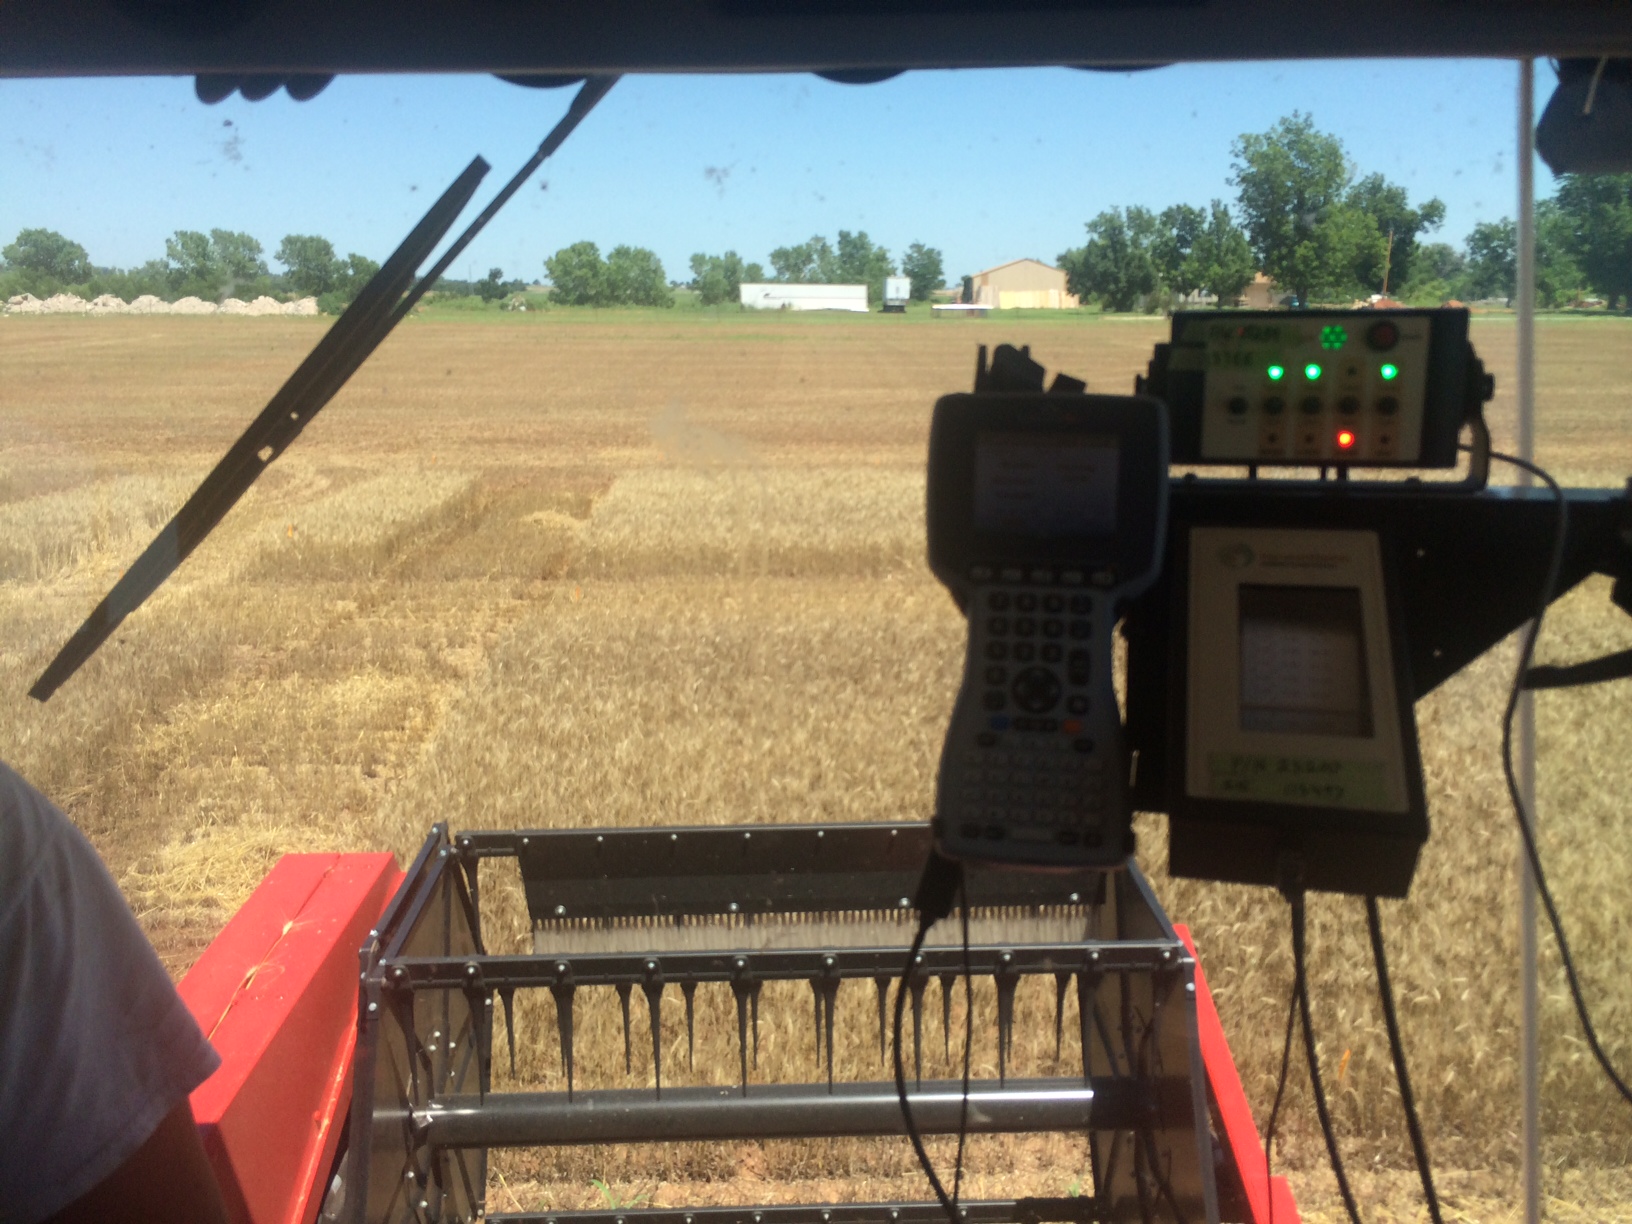
The view from the driver seat of the Massey 8XP, with the Harvest Master on the right.
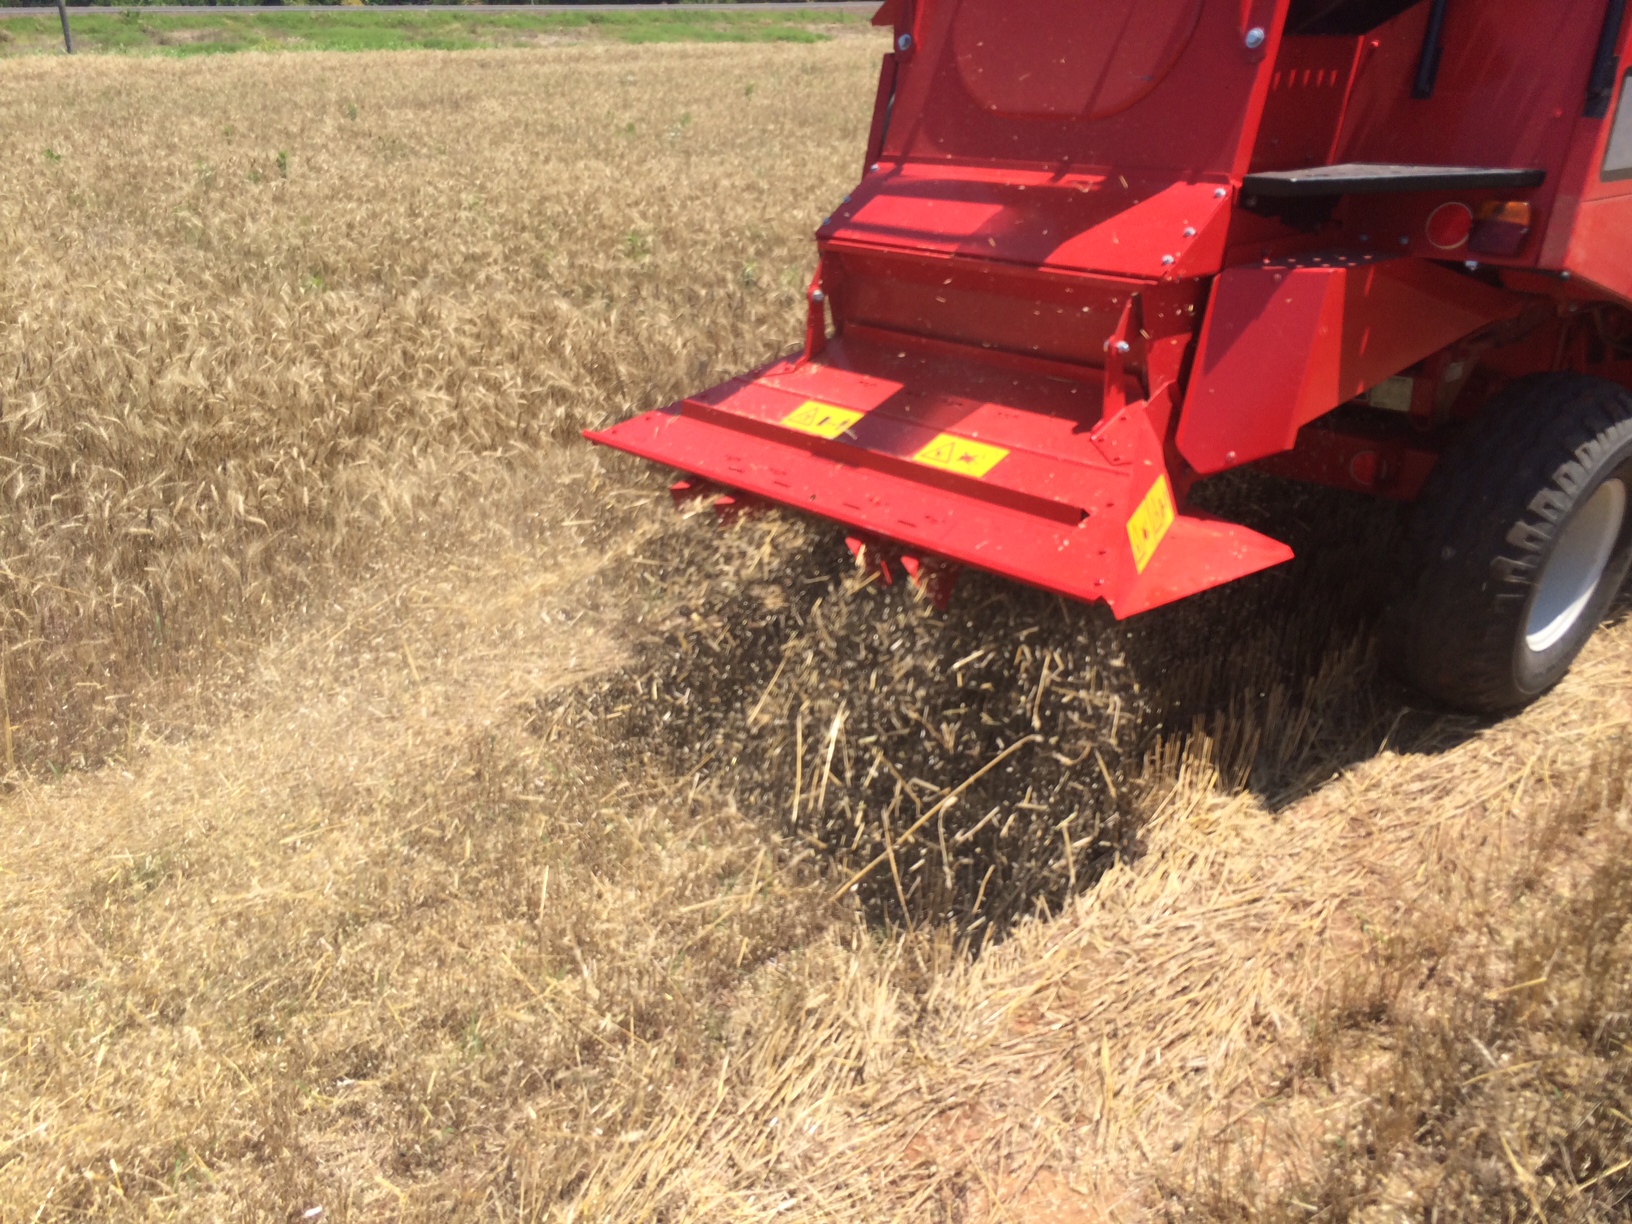
Even with a 5 ft header residue management is important.
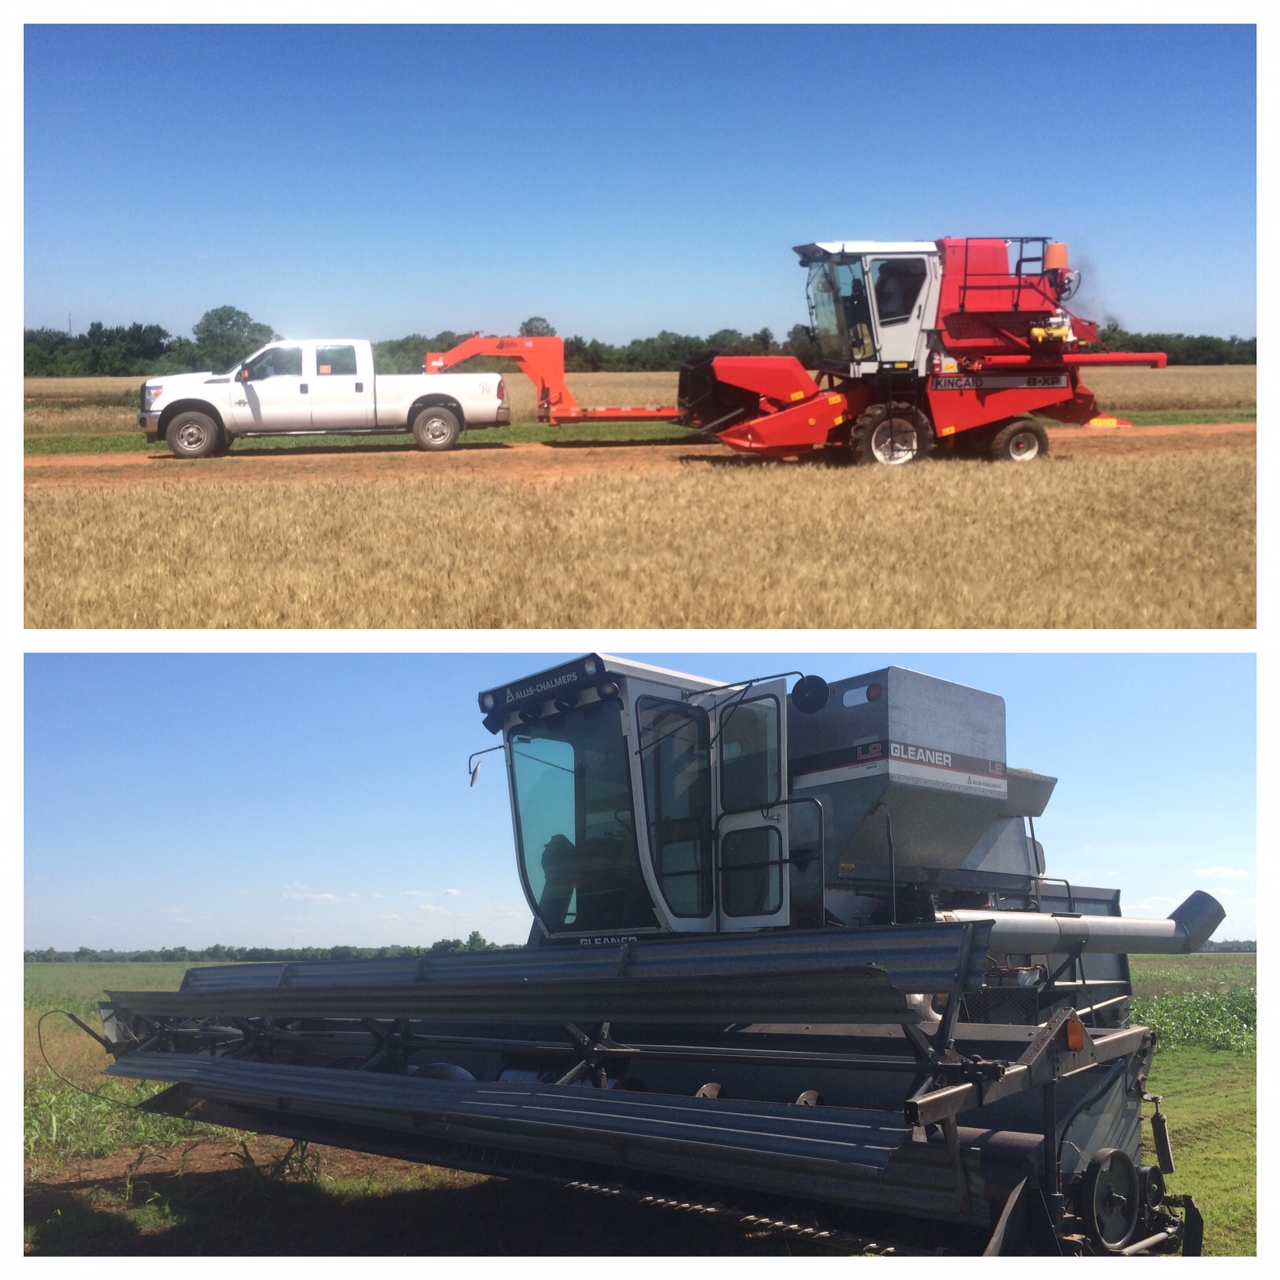
While all plots are cut with the 8XP, for cleanup we borrowed a few Gleaners when available. I liked to say we started with Young and Cute and finished with Mature and Efficient.

To beat the rains all of us at OSU ran late nights and weekends.

When possible we like to let students get as much experience as possible. In this a Brazilian intern Luciano is learning to run the 8XP.
