Home » Wheat (Page 6)
Category Archives: Wheat

Some thoughts on pre-plant nitrogen and a little outside the box thinking
It is that time of year, every Co-op I drove by the other day had a line of trucks pulling anhydrous tanks and the spinner spreaders were being loaded. For those of you who haven’t applied your nitrogen yet lets discuss the options traditional and nontraditional.
Anhydrous Ammonia, 82-0-0: by far the most widely used N source is the southern Great Plains. While it is not the most enjoyable to work with it is the cheapest per pound of N and that leads to its wide spread use without Oklahoma wheat production. Just a few simple rules with NH3, get it in the ground and close the row behind you. In conventional till this is usually easier unless the ground is too wet or too dry. In no-till this may be a little more challenging but usually easily accomplished. With the rise in low disturbance applicators I am seeing more and more acres of no-till receiving NH3. Last year I was in a field of stripper stubble and I had a hard time finding where the rig had run, minus wheel tracks.
Urea, 46-0-0: is second on the hit list in nitrogen sales in our state. It is a safe source that is easily handled and applied. In a conventional till system where the urea can be worked in shortly after application it is a very efficient and effective source. Unfortunately when it is applied to the soil surface and rain is the method of incorporation we can experience between 5-60% N losses. The losses come from how urea is converted to plant available ammonium (NH4). For urea (NH2)2CO2, to be converted to plant available NH4 it needs the enzyme urease. Urease is present everywhere but in the highest concentrations on plant residue. The figure below shows the reaction, urease converts urea into NH3 as soon as the prill dissolves. In the presence of moisture the NH3 (gas) is turned immediately to NH4 (solid) and is absorbed onto the soil particle.
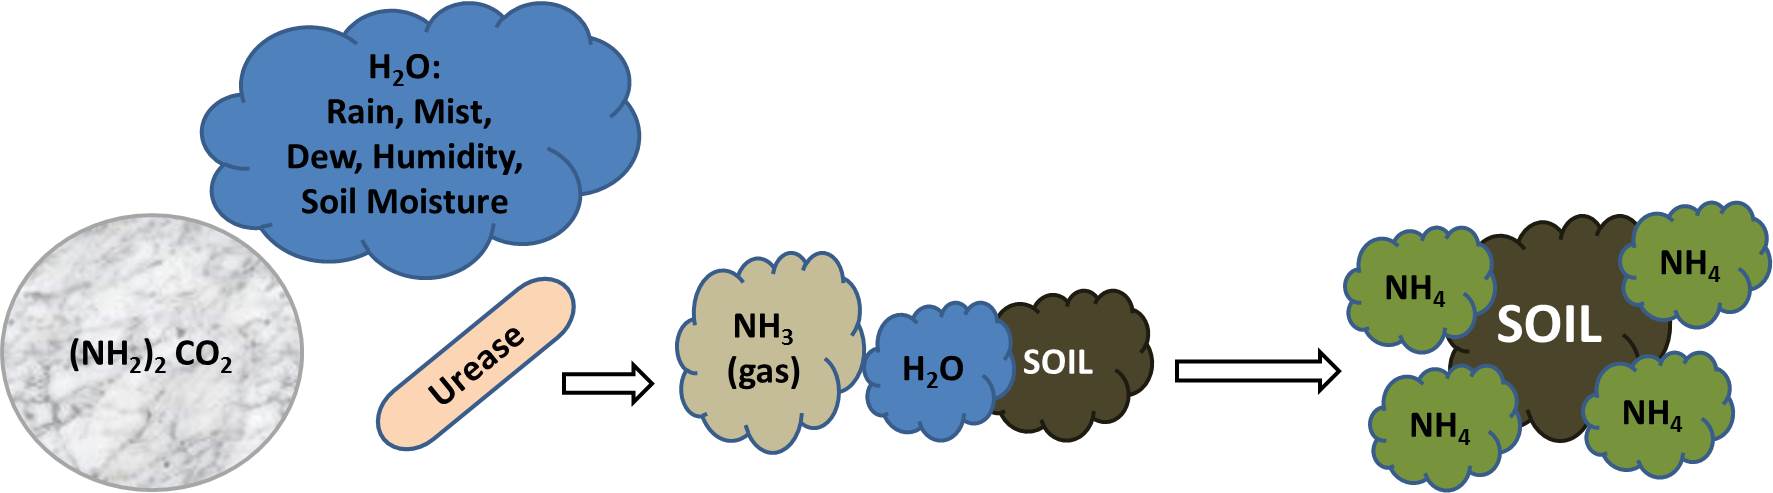
Graphic of Urea’s conversion to plant available ammonium.
The problems come when there is no soil particle for the NH4 to bind with. It usually takes 0.50 inches of rain or irrigation to fully dissolve and incorporate urea into the soil. So if we only get a few tenths or hundredths, even heavy dews, some of the urea will dissolve, be converted to NH3 then NH4 and be left on the plant/residue. When the moisture dries, some or all of the NH4 goes back to NH3 and will gas off into the atmosphere. I have even seen this happen when urea is applied on a wet/damp soil, not incorporated and it doesn’t rain for significant period of time. If the temps are cooler the urease is slower so less of the urea is converted to NH4, but if the temps are warm 60+ degrees these little enzymes can act very quickly.

Urea placed on the surface of a wet soil under two temperature regimes. White text is the number of hours after application.
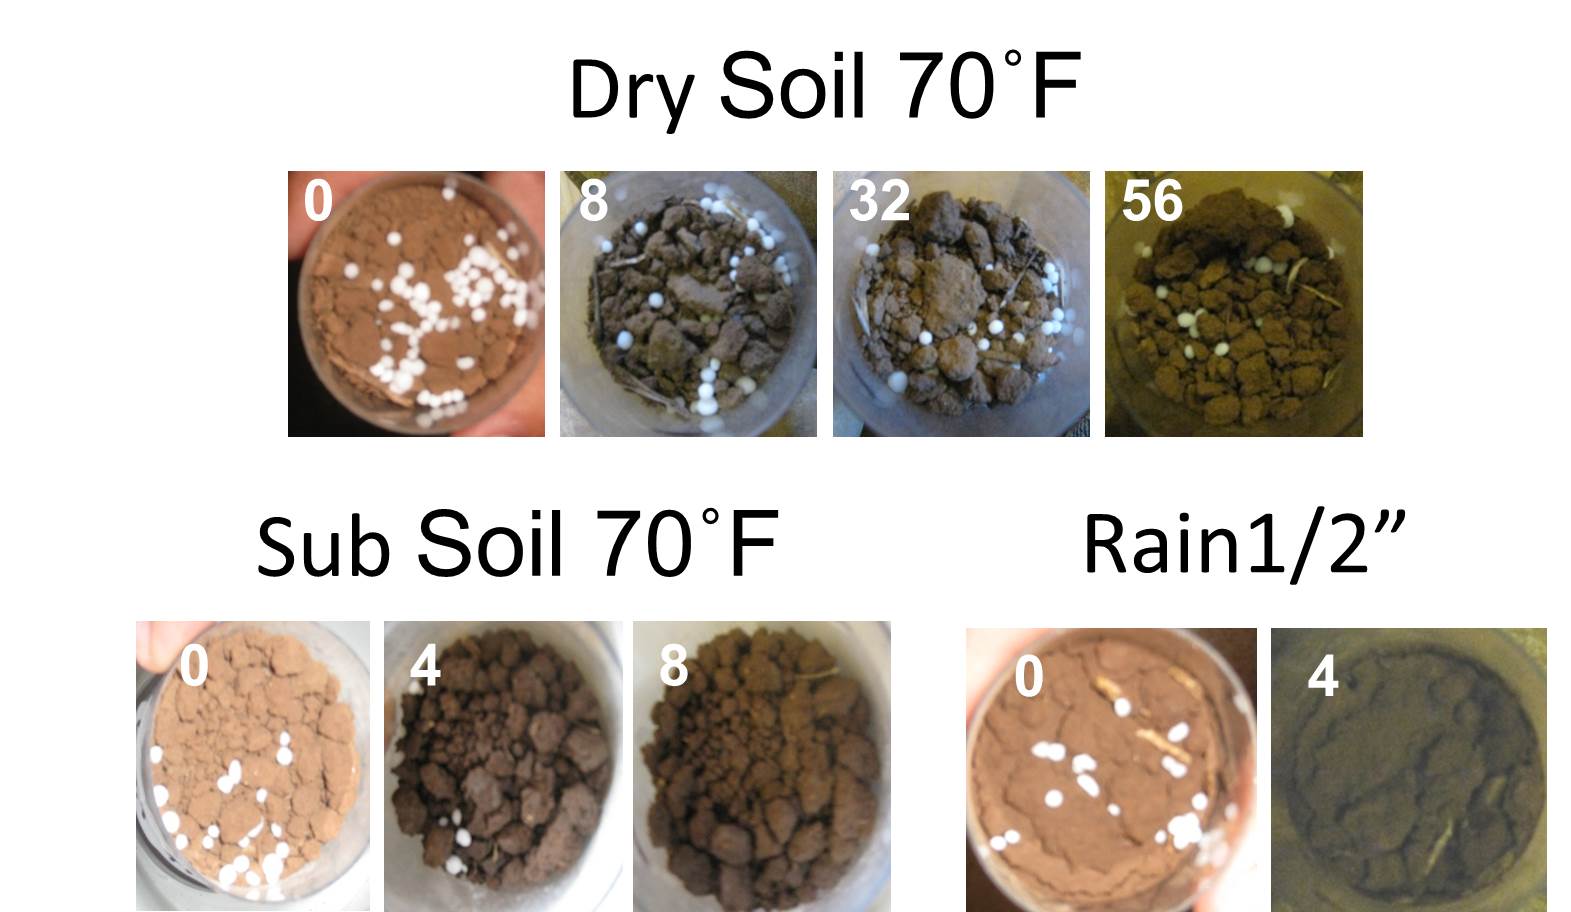
Urea placed on dry soil, Top row: dry soil no water added, Bottom left, moisture added from subsurface, Bottom right : simulated rain fall event of 1/2″. White text is the number of hours after application.
Below is a short video on using urea fertilizer.
While the recent rains are a blessing and will surely help germination, it is not aiding our N use efficiency especially in no-till. That is why in some parts of the state you may see some grain drills running right now. Some of those producers are not planting wheat they are actually applying there pre-plant urea. I have even been told in the SW part of the start some producers are using air-seeders to apply their urea. While this seems like a costly venture I have worked with the Ag Economist to create a calculator to figure up the break even for when it would pay to use an air-seeder over the traditional spinner spreader in no-till. We hope to put the finishing touches on it in the next few days. When it is completed it will be shared on this blog.
Liquid Urea Ammonium Nitrate, 32-0-0 or 28-0-0: while this is one of the more expensive forms of N many producers are utilizing this source because the can pre buy and store on site and as sprayer get larger they can cover a significant amount of ground quickly. For the most part UAN is used in no-till and is a great source. I always recommend that applicators use streamer nozzle or streamer bars to apply UAN. When UAN is applied via a flat fan nozzle it spreads the fertilizer across the residue allowing a significant portion to be tied up. The streamers concentrate the fertilizer into streams/bands reducing contact with residue and increasing the amount of UAN that reaches the soil surface.
Timing and Rates
The cost of anhydrous, about $0.1 to 0.12 less per pound N less than urea is driving its use this year. The lower price is also driving a significant about of producers to go with 100% of their N pre-plant. While this makes for sound economics now having all of your N upfront is like putting all of your eggs in one basket. If we do get that cold and wet winter as some are calling for this presents a great chance for the N to move down the soil profile and down the slope. I have always recommended split application. This allows a producer to judge the crop throughout fall, winter and even yearly spring and adjust his or her N plan accordingly. For those who plan to graze there is still a need to get enough N down to produce fall forage, this may be 50 to 80 lbs of N, but for grain only production planted later in the fall a typical crop may only need 20-30 lbs of N before going into winter. The old rules of thumb, 2 lbs N per bushel and 30 lbs N per 100 lbs of gain still work and are better than a guestimate but we have better ways. Right now is the time to plan to apply N-rich strip, a strip in the field with 40 to 50 lbs more than the rest of the field. These strips can be applied with a variety of applicators, but as long as the N goes down in at least an area 10 ft wide by 300 ft long it is good to go.

Just a few of the applicators used for putting out N-Rich Strips. ATV Sprayer, Receiver Hitch mounted Sprayer, Road sprayer with a rear boom, pull type spinner, large sprayer, push spreader. Not shown is NH3 applicator.
Below is a N-Rich Strip 101 video.
If you have got the N-Rich strips out you can set back and watch to see when and if they develop. If you can see the strip you know you need too fertilize.
While many are not ready to think about top-dressing yet, it is never too early. Don’t be afraid to think outside the box. Oklahoma’s springs tend to present the perfect conditions for N loss when urea is the primary N source. This year in a 4R Top-dress Nitrogen Application Demo, at Lahoma and Chickasha, we are going to apply just about every available commercial source in about every possible manor. Urea will be broadcast, coated with inhibitors, applied with a grain drill, NH3 will be knifed in, and UAN will be applied with flat fan nozzles, streamer nozzles and knifed in. As technologies improve and the cost of N remains relatively high the options for top-dress N application will continue to improve. The economics of wheat production don’t look great right now so don’t be afraid to think outside the box, even if it does raise the eyebrows of your neighbors. Fill free to contact myself or your local extension educator if you have any questions about N application.

John Deere double disk drill used to apply urea in-season.

WAKO NH3 applicator used for in-season application.
Sampling for pH and liming in continuous no-till fields
This article is written by Dr. David Mengel, Kansas State University Soil Fertility Specialist.
One question that commonly comes up with continuous no-till operations is: “How deep should I sample soils for pH?” The next common question is: “How should the lime be applied if the soil is acidic and the field needs lime?”
Sampling depth in continuous no-till
First, sampling depth. Should two sets of samples be taken, at different depths?
Our standard recommendation for pH is to take one set of samples to a 6 inch depth. On continuous no-till fields where most or all of the nitrogen (N) is surface applied, we recommend taking a second sample to a 3-inch depth. We make the same recommendation for long-term pasture or grass hayfields, such as a bromegrass field that has been fertilized with urea annually for several years.
Nitrogen fertilizer is the primary driving force in lowering soil pH levels, so N application rates and methods must be considered when determining how deep to sample for pH. In no-till, the effects of N fertilizer on lowering pH are most pronounced in the area where the fertilizer is actually applied. In a tilled system, the applied N or acid produced through nitrification is mixed in through the action of tillage and distributed throughout the tilled area.
Where N sources such as urea or liquid UAN solutions are broadcast on the surface in no-till system, the pH effects of the acid formed by nitrification of the ammonium will be confined to the surface few inches of soil. Initially this may be just the top 1 to 2 inches but over time, and as N rates increase, the effect of acidity become more pronounced, and the pH drops at deeper depths. How deep and how quickly the acidity develops over time is primarily a function of N rate and soil CEC, or buffering capacity.
Where anhydrous ammonia is applied, or liquid UAN is knifed or coulter banded below the surface, an acid zone will develop deeper in the soil, usually 2-3 inches above the release point where the fertilizer is placed in the soil. So if the ammonia is injected 8 inches deep, there will be acid bands 5 to 8 inches below the soil surface. As with long-term surface applications, these bands will expand over time as more and more N fertilizer is placed in the same general area. The graphic below illustrates the effect of a high rate of ammonia placed in the same general area in the row middle on a high CEC soil for more than 20 years.
The actual depth of the acid zone in fields fertilized with ammonia gets tricky as application depth can vary depending on the tool used to apply the ammonia. Traditional shank applicators generally run 6 to 8 inches deep, so a sample for pH measurement could be taken at 3-6 inches or 5-8 inches deep, depending on how deep the shanks were run. The new low-disturbance applicators apply the ammonia 4-5 inches deep. A sweep plow or V-blade applies ammonia only 3-4 inches deep. So sampling depth for pH should really depend on where the acid-forming N fertilizer is put in the soil.

Mengel and West, Purdue Univ.
Liming application methods in continuous no-till
Now, where do you place the lime in continuous no-till? If you surface apply N, then surface apply the lime. That’s a simple but effective rule. But remember that surface-applied lime will likely only neutralize the acidity in the top 2-3 inches of soil. So if a producer hasn’t limed for 20 years of continuous no-till and has applied 100 to 150 pounds of N per year, there will probably be a 4-5 inch thick acid zone, and the bottom half of that zone may not be neutralized from surface-applied lime. So, if a producer is only able to neutralize the top 3 inches of a 5-inch deep surface zone of acid soil, would that suggest he needs to incorporate lime? Not really. Research has shown as long as the surface is in an appropriate range and the remainder of the acid soil is above pH 5, crops will do fine.
Liming benefits crop production in large part by reducing toxic aluminum, supplying calcium and magnesium, and enhancing the activity of some herbicides. Aluminum toxicity doesn’t occur until the soil pH is normally below 4.8. At that pH the Al in soil solution begins to increase dramatically as pH declines further. Aluminum is toxic to plant roots, and at worse the roots would not grow well in the remaining acid zone.
This implies that the acid zones from ammonia are probably not a major problem. We have monitored ammonia bands in the row middles of long-term no-till for many years and while the pH got very low, below 4.5, we never saw any adverse impacts on the crop that would justify liming and using tillage to incorporate the lime. In fact, some nutrients such as zinc, manganese, and iron can become more available at low pH, which can be an advantage at times.
Yield enhancement is not the only concern with low-pH soils, however. Herbicide effectiveness must also be considered. The most commonly used soil-applied herbicide impacted by pH is atrazine. As pH goes down, activity and hence performance goes down. So in acid soils weed control may be impacted. We do see that in corn and sorghum production.
Liming products for no-till
When choosing a liming product, is there any value to using dolomitic lime (which contains a large percentage of magnesium in addition to calcium) over a purely calcium-based lime product? On most of our soils in Kansas we are blessed with high magnesium content. So as long as we maintain a reasonable soil pH, there normally is enough magnesium present to supply the needs of a crop. Calcium content is normally significantly higher than magnesium, so calcium deficiency is very, very rare in Kansas. The soil pH would need to be below 4.5 before calcium deficiency would become an issue. Before calcium deficiency would occur, aluminum toxicity or manganese toxicity would be severely impacting crop growth. So producers really don’t have to worry about a deficiency of calcium or magnesium on most Kansas soils.
What about the use of pelletized lime as a pH management tool on no-till fields? The idea has been around for a while to use pel-lime in low doses to neutralize the acidity created from nitrogen and prevent acid zones from developing. There is no reason it won’t work, if you apply enough product each year. Pel-lime is a very high-quality product, normally having 1800 to 2000 pounds of effective calcium carbonate (ECC) per ton, and can be blended with fertilizers such as MAP or DAP or potash easily.
But it is costly. As an example, at a cost of $160 per ton and 1,800 lbs effective calcium carbonate (ECC) per ton, 100 pounds of ECC pel-lime costs $8.80. If it costs $25 per ton to buy, haul, and apply a 50% ECC limestone, that equates to $2.50 per 100 pounds ECC.
If you were applying 100 pounds of urea-based nitrogen, it would take approximately 180 pounds of ECC to neutralize the acidity produced by the N. This would require 200 pounds of 1,800 pound ECC pel-lime or 360 pounds of 50% ECC ag lime. The cost would be around $16 per acre with pel-lime or $4.50 per acre with ag lime. So technically, the pel-lime option is fine. But it would cost more than 3 times as much, at least in this example. You can use your own figures regarding costs and ECC of different lime products available to you to do a similar calculation. Deciding which product to use is a simple economic choice.
Summary
Applying N fertilizer to soil will cause the soil to become acidic over time. Placement of the applied N and the level of soil mixing done through tillage determine where the acid zones will develop. Make sure your soil testing program is focused on the area in the soil becoming acidic, and apply the lime accordingly.
Dave Mengel
Kansas State University
Professor Soil Fertility Specialist
dmengel@ksu.edu
Time to start topdressing wheat
My favorite part of the blog “Don’t have an N-Rich Strip? It’d be a lot cooler if you did.”

There are few crop inputs that deliver as much return on investment as nitrogen fertilizer. It takes approximately two pounds of nitrogen, costing approximately $1.00, to produce one bushel of grain worth about $5.00. Of course, nitrogen is not the only yield determining factor in a wheat crop. Also, the law of diminishing marginal returns eventually kicks in, but nitrogen fertilizer is still one of the safest bets in the house.
Top dress nitrogen fertilizer is especially important because it is applied and utilized at a time when the plant is transitioning from vegetative to reproductive growth. Several things, including the number of potential grain sites, are determined just prior to jointing and it is imperative that the plant has the fuel it needs to complete these tasks. Jointing also marks the beginning of rapid nitrogen uptake by the plant which is used to build new leaves, stem, and the…
View original post 707 more words
How to make $100,000 in a day
This is a familiar soap box. SOIL SAMPLE, SOIL SAMPLE, SOIL SAMPLE.
No, this blog post is not about a get rich quick scheme, but there is a way for the average wheat farmer in the southern Great Plains to add $50,000 to $100,000 to the bottom line in a single day. Most soil tests I have pulled this summer have shown 50 to 90 lb/ac of NO3-N in the top 18 inches of soil. Ninety pounds of N equates to about $45 of N fertilizer, and this knowledge could save a 2,500 acre wheat farmer in excess of $100,000 in fertilizer cost. Soil testing is laborious, but the potential economic returns for spending a day or two soil sampling are outstanding.
There is still time to soil sample. Soil samples only take a few days to process once they are in the OSU lab. It is not unusual for transit time to the lab to the slowest part of the process…
View original post 219 more words
2013 Wheat and Canola preplant soil test results
Every few years I request the results of all soil samples submitted to OSU Soil, Water, & Forage Analytical Labs (www.soiltesting.okstate.edu) under the crop codes of winter wheat and winter canola. Within this data set I can look at trends occurring across the state over time. In this report I will focus on the 2013 results but make some comparison with the 2011 sample values.
As it pertains to mobile nutrients such as N, S, and B there is little that can be applied from the previous year’s soil samples because their levels in the soil change rapidly. Samples must be collected every year to determine the current status. However the soil test levels of immobile nutrients, P, K, Mg, ect are relatively stable over time and the recommendation is to take a close look at these values every three to five years.
In 2013 the number of sample submitted increase. There were nearly 1000 more wheat soil samples (2733 to 3574) and 200 more canola soil samples (33 to 231). If the distribution of nutrient levels of the two years are compared the only significant change is that the soil test NO3 level was significantly lower in 2013 (Tables 1 and 2). This is attributed to the extremely dry 2012 spring and summer which delayed the breakdown of wheat straw and immobilization of residual N.

Table 1 and 2. Summary from all samples submitted to SWFAL under the wheat and canola crop codes in 2001 and 2013.
Reviewing the 2013 values the most concerning aspect is that 72% of the 3800+ soils samples had a Mehlich 3 P value below optimum soil test phosphorus (STP) of 65 (Figures 1 and 2). That adds up to 109,000 acres needing phosphorus, if you assume each sample represents 40 acres. There is no way to determine how much P2O5 if any was applied to these particular fields. However, an estimated impact of not fertilizing can be calculated. Based on the Oklahoma typical average yield of just below 40 bpa, it would cost the state approximately 575,000 bushels if the land went unfertilized. At $5.00 a bushel that is $2.8 million in revenue. To remedy the low STP it would take approximately 2.76 million lbs P2O5 at a cost of $1.5 million ($0.50 per lb).
In the NPKS response study wheat fields across the state were evaluated for a response to additional (in addition to producer’s standard practice) nitrogen, phosphorus, potassium, and sulfur. Phosphorus was the most limiting nutrient at 7 of the 59 harvest locations. A response to P occurred more often than any of the other nutrients tested. It is important to note at all seven fields had been fertilized with P that season, however each time it was below the OSU recommended rate. The response study was a great reminder that it is important to have a good soil test and to follow the recommendations.

Figures 1 and 2. 1)Range of soil test P levels (Mehlich 3) for all samples submitted to SWFAL in 2013 under the wheat and canola crop codes. 2) Range of Soil Test P level for all samples with STP<65.
Soil pH on the other hand showed a slight improvement from 2011. The percent of samples under 5.5 decreased by 4%, 25 to 21. Of the samples <5.5 the majority fall within the 5.0-5.5 category, which for winter wheat is still within the optimum growth window (Figures 3 and 4). These numbers are a good sign however two points should be made. There is a significant amount of winter wheat acres that is not sampled; much of this is likely to fall below 5.5 soil pH.
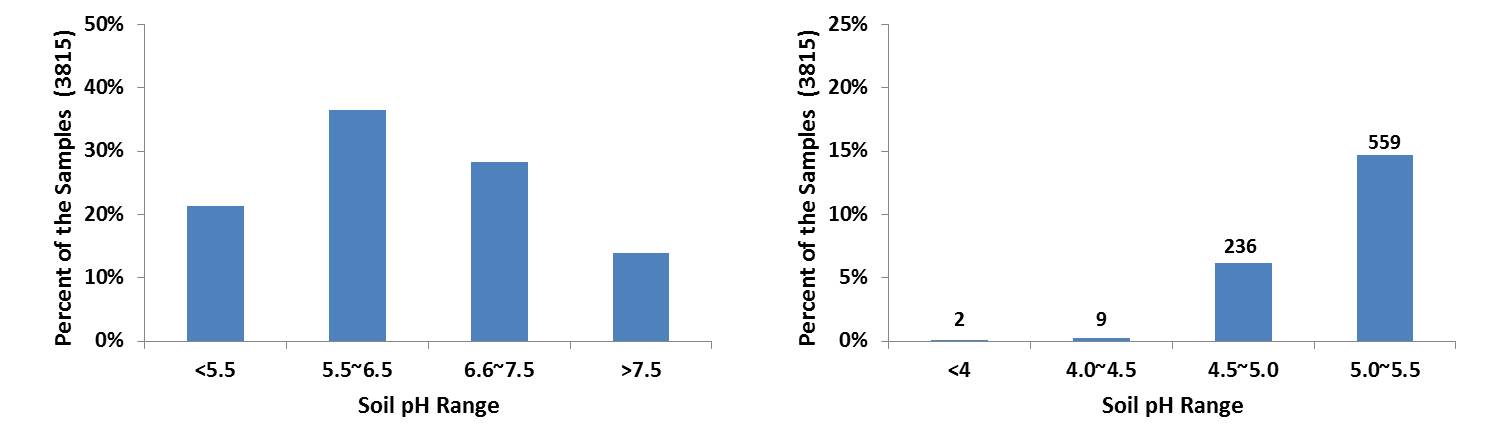
Figures 3 and 4. 1)Range of soil pH levels for all samples submitted to SWFAL in 2013 under the wheat and canola crop codes. 2) Range of soil pH levels for all samples with pH<5.5.
Additionally grid soil sampling and variable rate lime should consider on any field which the composite soil sample pH ranges from the high 4’s to the high 5’s. For example a 75 ac field near Deer Creek had a composite soil sample test pH of 5.3 and buffer index of 6.5. The OSU lime recommendation, for a wheat crop, was 2.2 ton per acre for a total of 166 tons to lime the entire field. However the producer grid soil sampled the field himself at a 2.5 acre resolution (31 samples). Figure 5, shows that the pH of the field ranged from 4.4 to 7.9. Only 33 tons of lime would be required if the field were limed using a variable rate technologies. Cutting the total amount applied by 133 tons would save the producer approximately $4000.
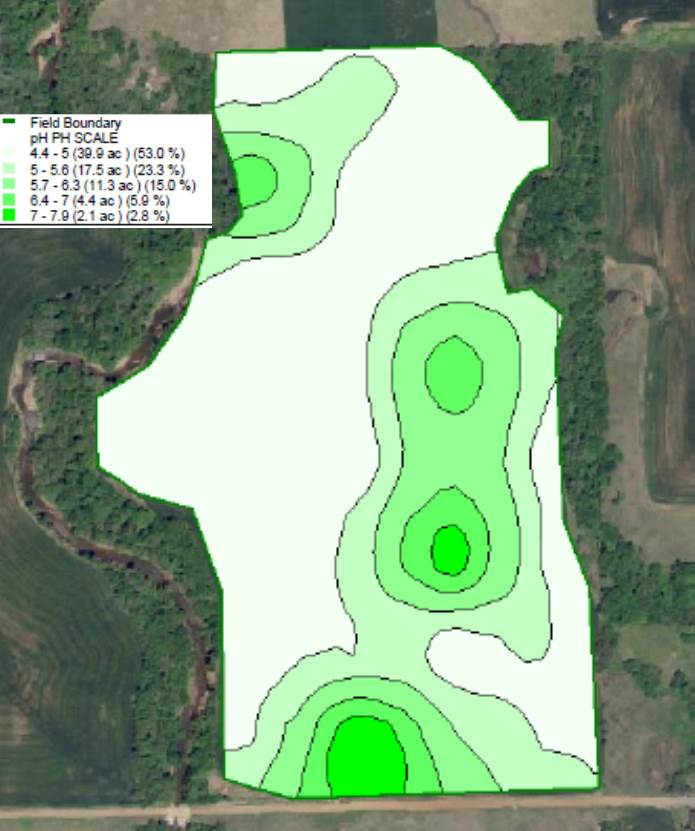
Figure 5. Soil pH results from a 75 acre field that was grid soil sampled at a 2.5 ac resolution.
Oklahoma wheat and canola producers must take advantage of the weather when it goes their way. Yet if the crop does not have the proper soil pH and nutrients under it, it will never reach its potential. Take the time to collect a soil sample and send it in to a lab. The hour it takes to collect the sample a few dollars you spend on analysis will help ensure that crop you are producing has the best chance of hitting maximum yield in the most economically and environmentally sound manner.
Related Factsheets
OSU Soil Test Interpretations
http://npk.okstate.edu/documentation/factsheets/PSS-2225web2013.pdf
Fertilization Based on Sufficiency, Build-up and Maintenance Concepts
http://npk.okstate.edu/documentation/factsheets/PSS-2266web.pdf
2014 Harvest has wrapped up.
The last of the Precision Nutrient Management winter crop harvest was wrapped up in Chickasha June 25. Across the trial locations (Lahoma, Perkins, Chickasha, and Stillwater) the yields came in across the board in the high teens low twenties, bushel per acre. For most of the trials there was very little treatment difference, often the check ( Zero N) was not far from the fertilized plots. At this time the students are processing the grain. Some will be sent to a NIR Spectrophotometer for protein analysis the rest will be ground and analyzed for nitrogen and mineral content. The response to fertilizer was so low this year many of my trial areas have a double crop sorghum growing, in hopes to take advantage of the recent rains and harvest the residual nutrients. While I am processing the data and the students are running the samples I thought I would share a few of the images from the 2014 harvest. I will post results on the npk.okstate.edu as the become available and share the information on this blog. The best way to learn when results are posted are to follow me on Twitter @OSU_NPK or subscribe to our Extension news list serve (send me an email at b.arnall@okstate.edu to be added to the listserv).
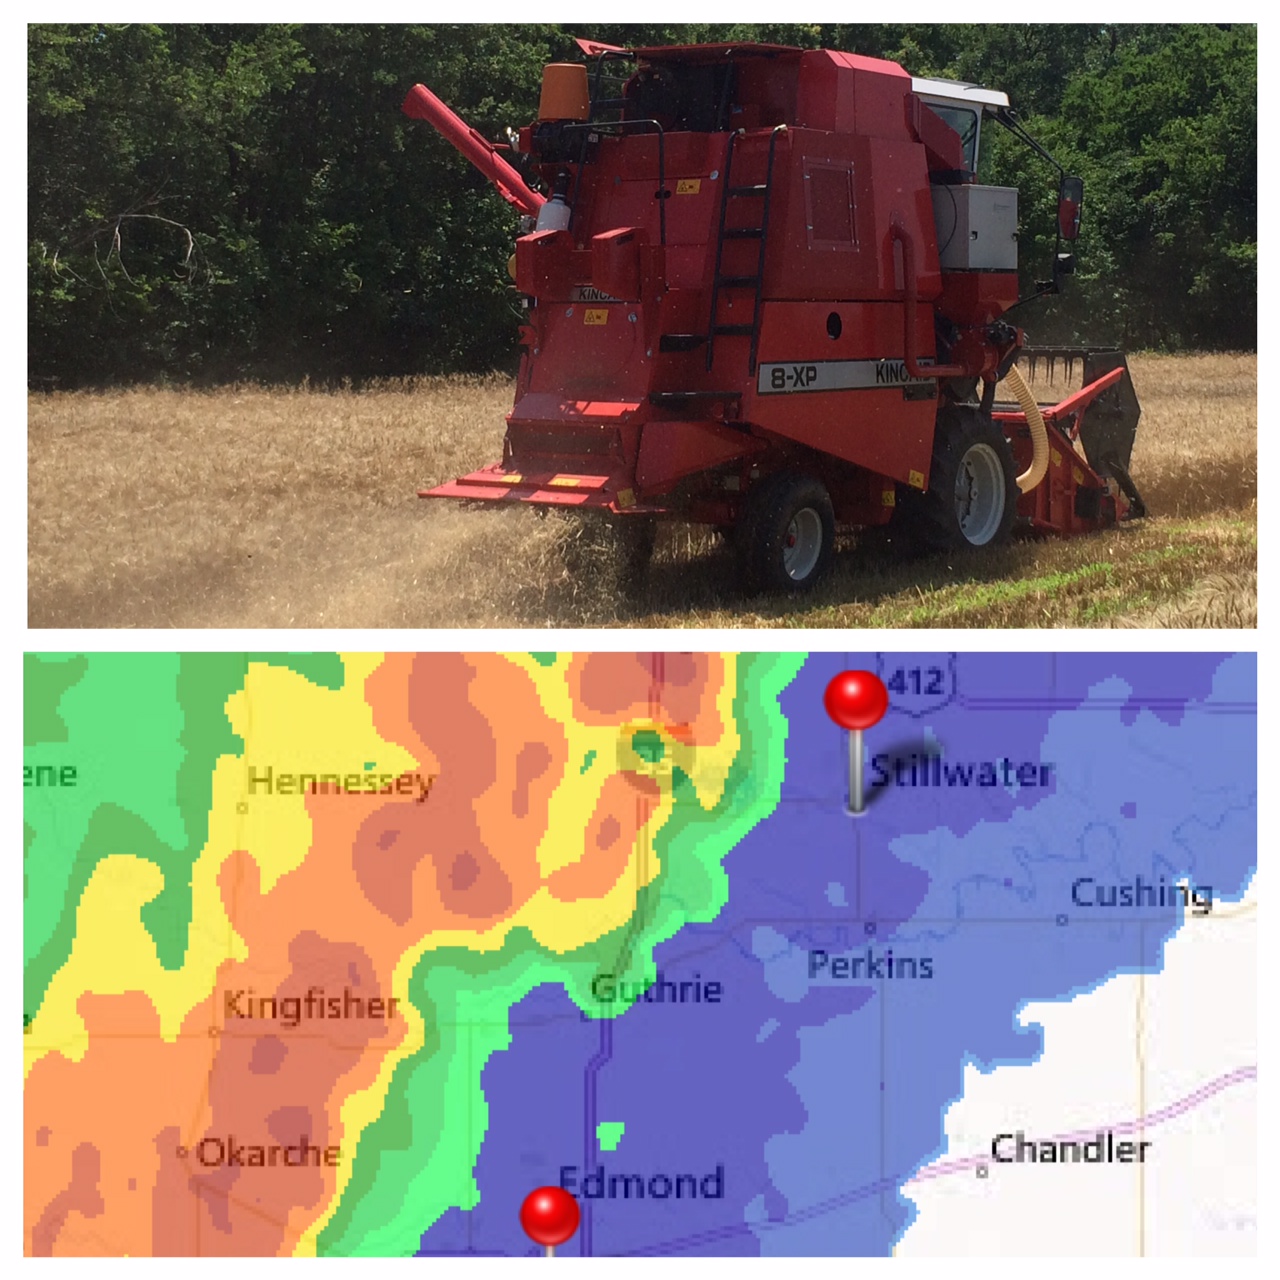
This harvest was spent watching the radar and going where the weather allowed.
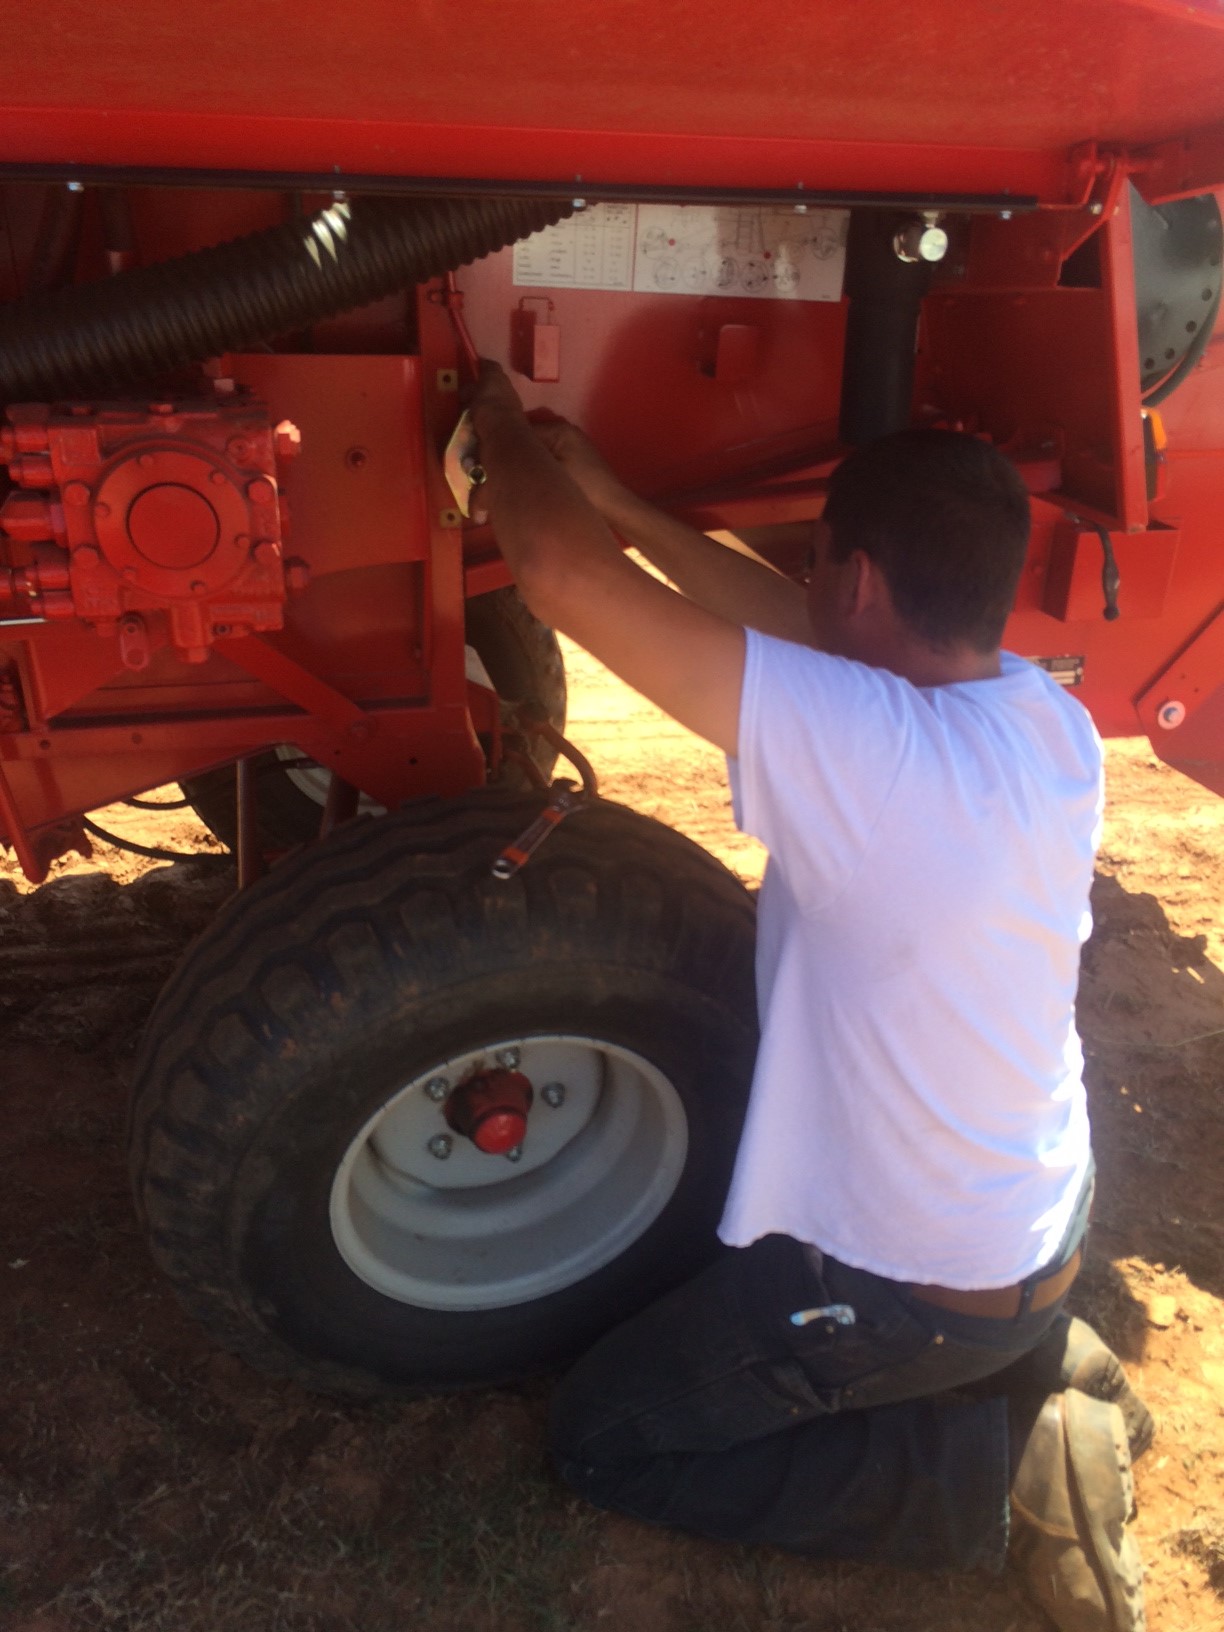
Even a new machine needs a few in field “Modifications”
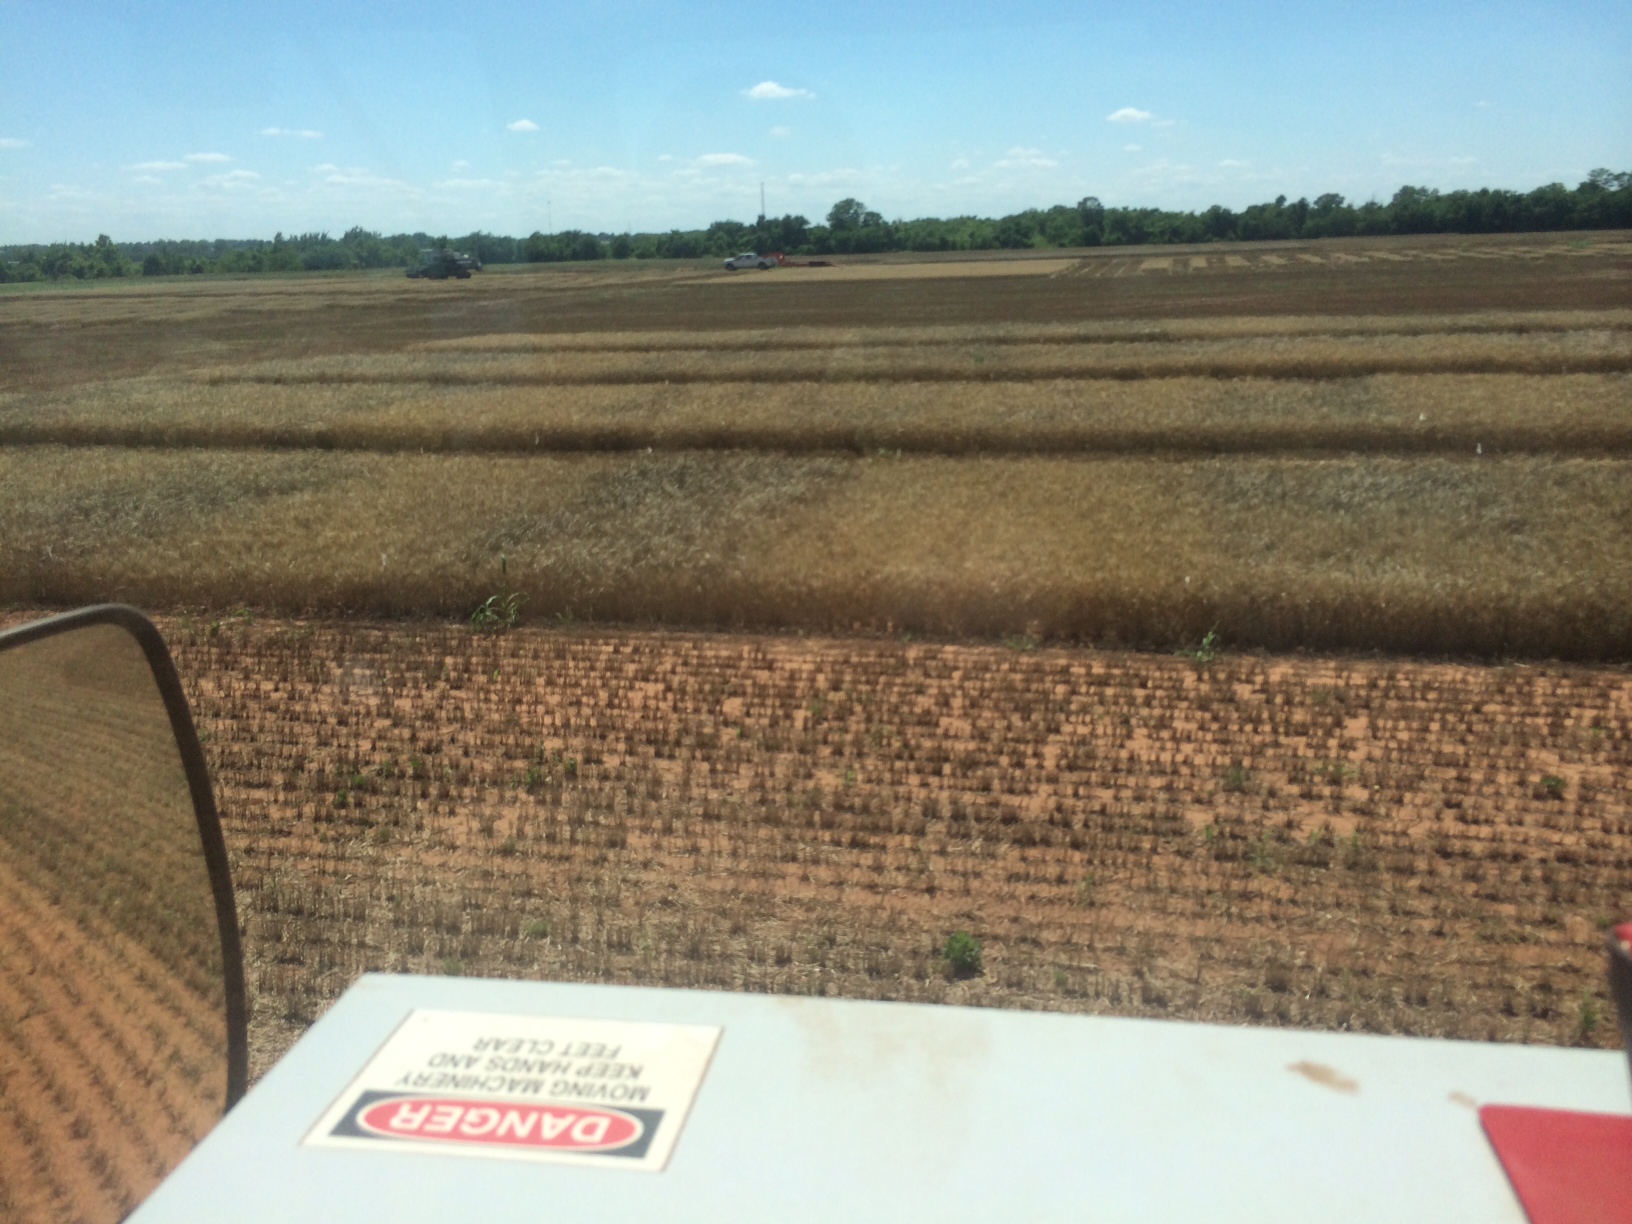
In this you can see the impact of fertility on freeze damage. The dark plots survived the freeze, the light did not and were full of smaller tiller heads. In the end no major yield differences.
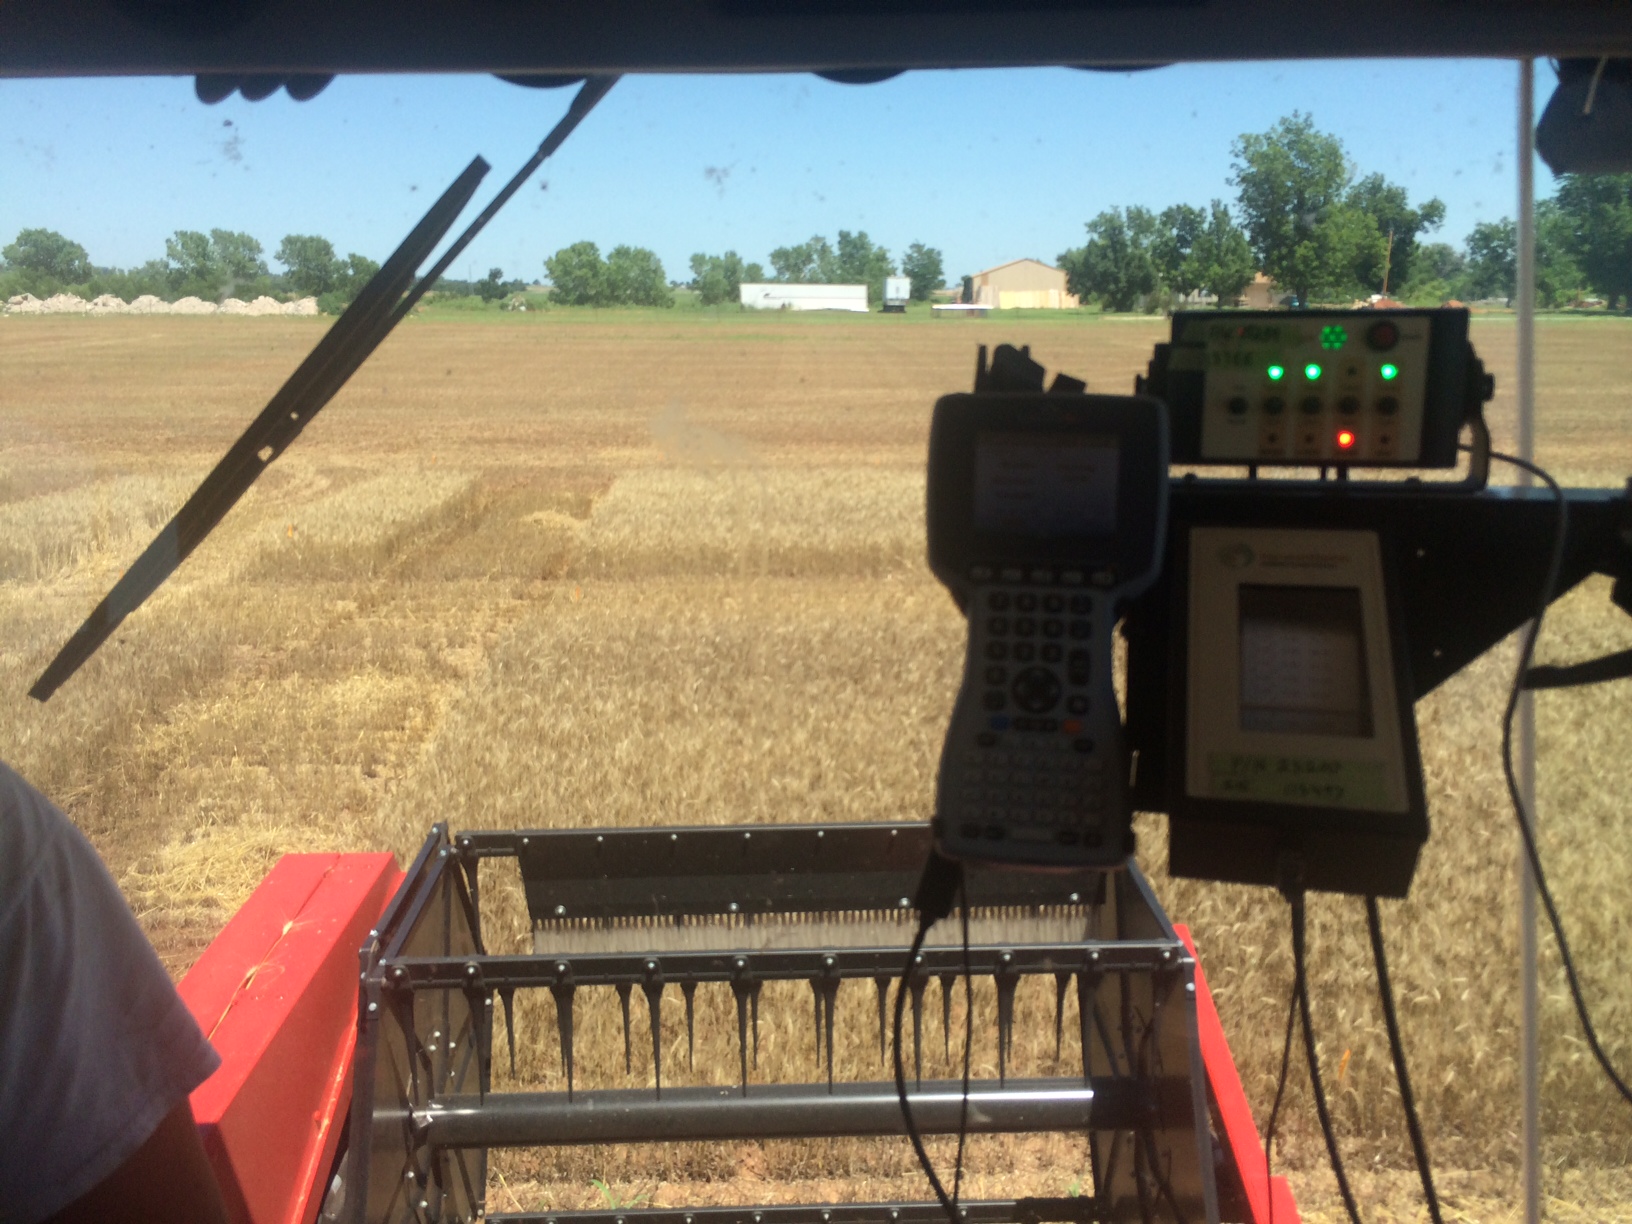
The view from the driver seat of the Massey 8XP, with the Harvest Master on the right.
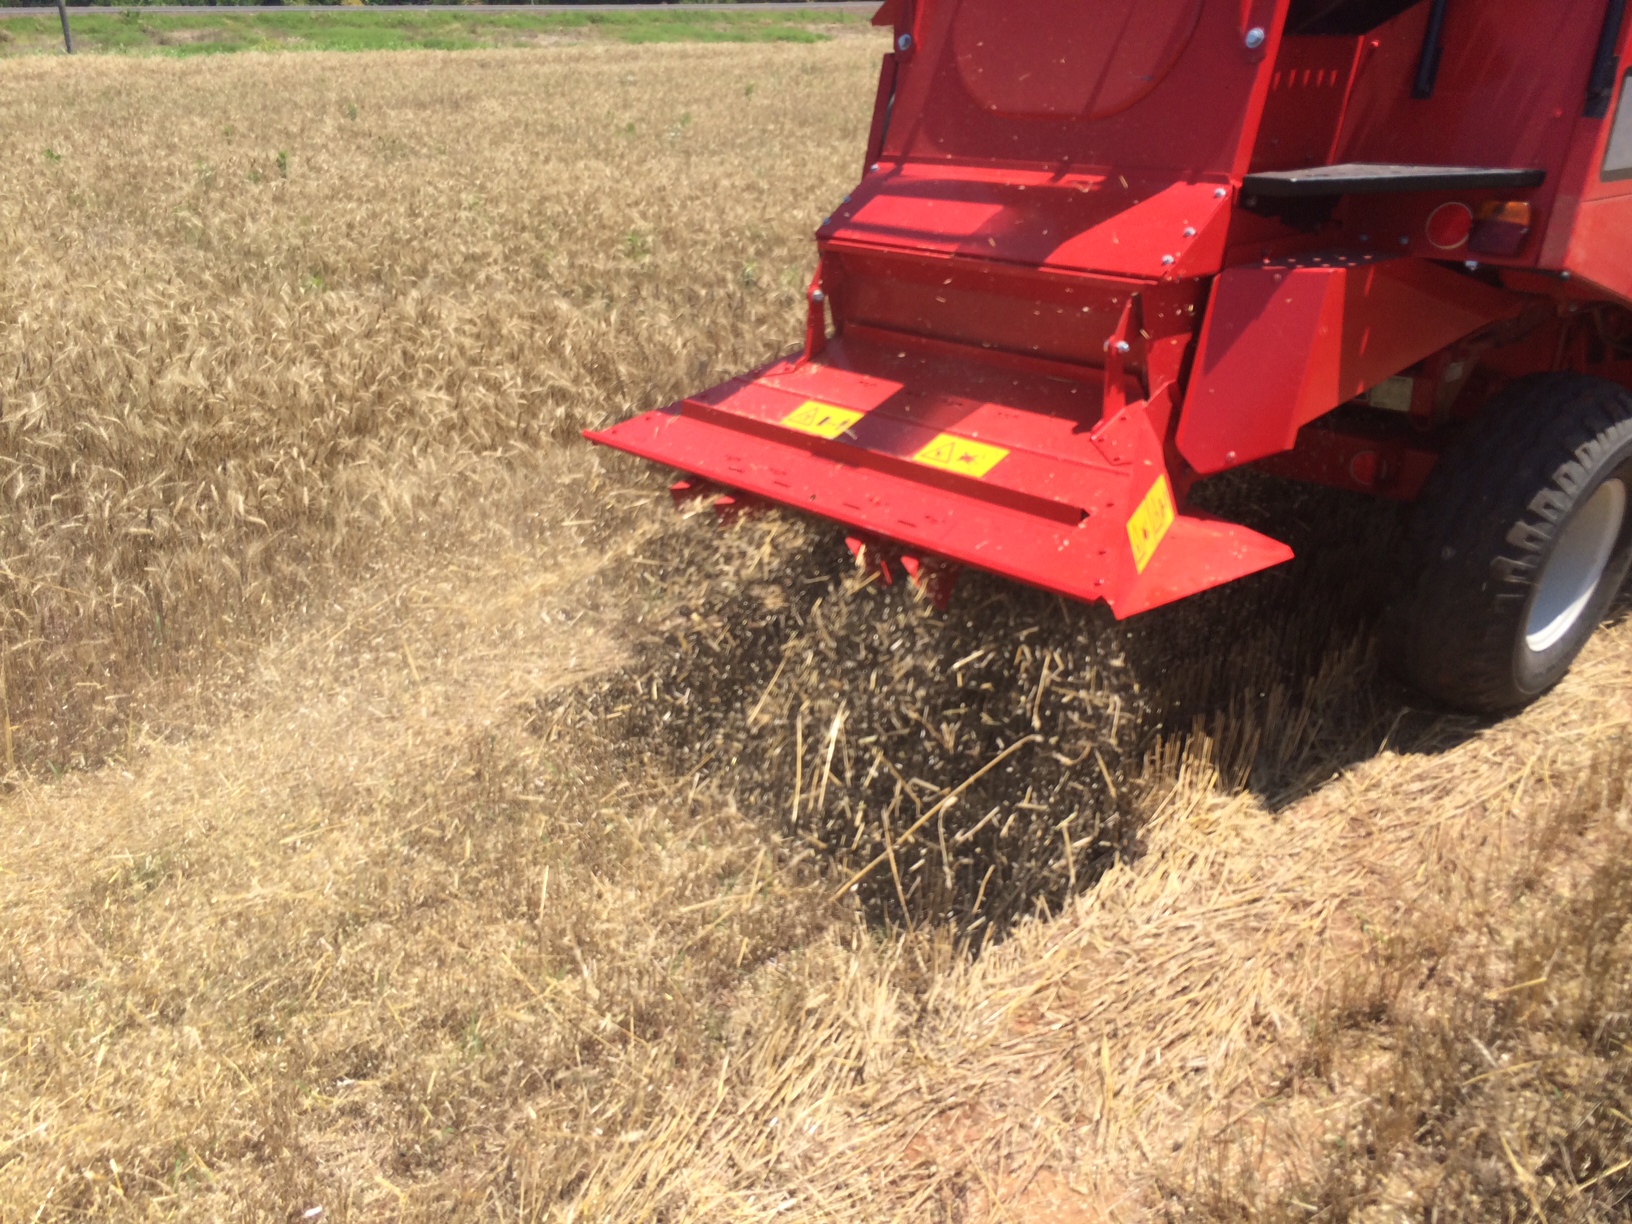
Even with a 5 ft header residue management is important.
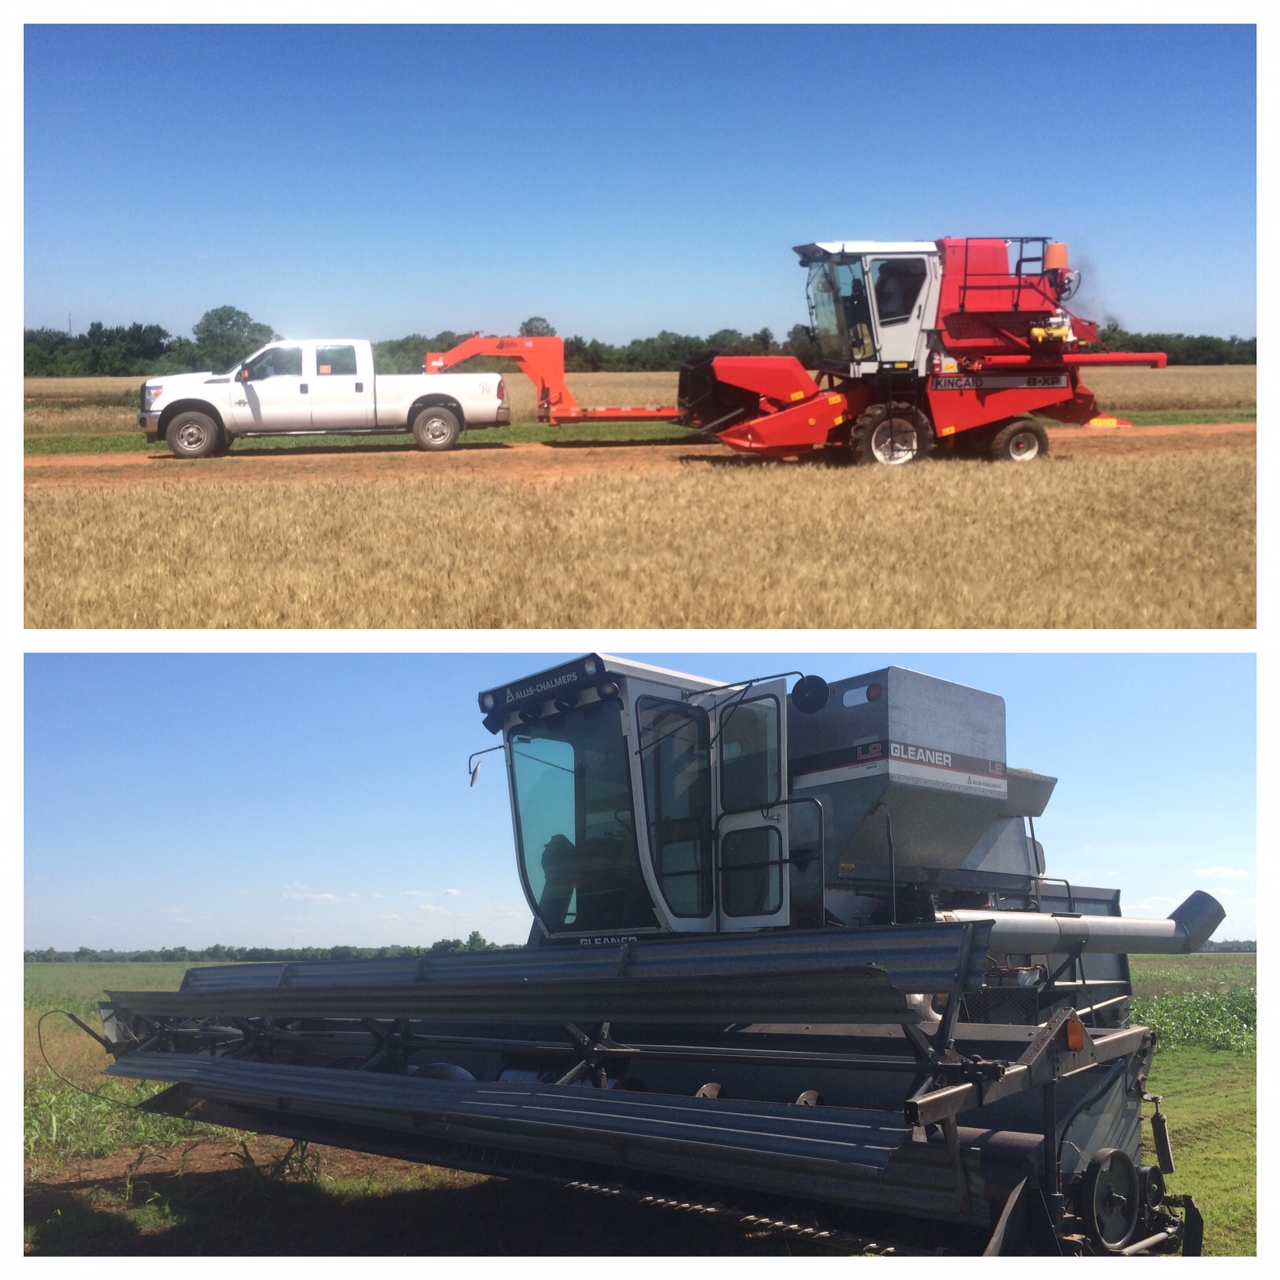
While all plots are cut with the 8XP, for cleanup we borrowed a few Gleaners when available. I liked to say we started with Young and Cute and finished with Mature and Efficient.

To beat the rains all of us at OSU ran late nights and weekends.

When possible we like to let students get as much experience as possible. In this a Brazilian intern Luciano is learning to run the 8XP.
Banding P as a Band-Aid for low-pH soils.
In the mid-1970s Dr. Robert Westerman banded 18-46-0 with wheat at planting in a low-pH soil near Haskel Ok. The impact was immediately evident. Soon after Oklahoma State University recommended the “Banding of Phosphate in Wheat: A Temporary Alternative to Liming” Figure 1. This method was a Band-Aid solution for the significant amount Oklahoma winter wheat production area which was either too far from a reliable lime source or under a short term lease contract.

Figure 1. The cover of an extension brochure distributed in Oklahoma during the 1980s.
Still today grain producers throughout the United States commonly farm a large percentage of land that is not their own. In the leasing process agreements can widely vary both on length of the lease and the amount of inputs that the land owner will pay. The wheat belt of Oklahoma is known for having large areas with low soil pH levels. A survey of soil samples submitted to the Oklahoma State University Soil, Water, and Forage Analytical Laboratory in 2011 under the winter wheat crop code showed 38% of the samples having a soil pH level below 5.5 (Figure 2). In Oklahoma short term leases with limited shared expenses have limited the access to agricultural lime for remediation of acidic soils. In the dry environment it may take up to one year before the lime applied has completely corrected the soil acidity problem. In a situation where the lease agreement is only for one to two years there may be no economic benefit for the producer to apply lime especially in regions where winter wheat average yields range from 20 to 40 bushel per acre. The current recommendation for winter wheat producers working on low-pH short term lease ground is to apply 30 lbs P2O5 ac-1 ( 65 lbs 18-46-0 ac-1) with the seed for grain only wheat and 60 lbs P2O5 ac-1 (130 lbs 18-46-0 ac-1) for dual-purpose wheat production. This recommendation however is for soils with adequate soil test P, but low soil pH. When soil test P is below optimum the 30 or 60 units is applied in addition to the amount needed to reach 100% sufficiency.
Banding P is considered a “Band-Aid” as the problem of soil acidity is not re-mediated it is only masked. If not addressed the pH of the soil will continue to fall over time. Aluminum and manganese toxicity is the greatest issue associated with soil acidity. Available aluminum, a predominant mineral in the regions soils, is pH dependent. A change of 1.0 pH level changes available Al by 1000 fold. For example a soil with a pH of 5.0 will have an approximate Al concentration of 27 ppm, critical level of winter wheat is 27 ppm, while a soil with a pH of 4.0 will have an Al concentration of approximately 27,000 ppm. Aluminum and manganese toxicity does not only impact grain yield but it has an even greater impact on biomass production. Kariuki et al (2007) recorded the impact of soil acidity on eight current winter wheat lines. Correcting soil acidity increased wheat grain yield by 82% and increased forage production by 150%. For Oklahoma the forage produced by the wheat crop is as important as the grain. Oklahoma is unique in that approximately 50% of the four million acres of winter wheat are grazed annually much of this under the dual –purpose “Graze-N-Grain” management. To maintain productivity on the land without the long term investment of Ag lime producers have been applying phosphorus fertilizer to alleviate the impact of aluminum toxicity.

Figure 2. Summary of the soil pH values for the 614 samples submitted to the Oklahoma State University Soil, Water, Forage, Analytical Laboratory under wheat crop code during the time frame of 1-1-2011 11-30-2011.
In 1992 Boman et al reported that impact banding phosphates with seed on winter wheat forage production (Figure 3). Across the four locations the addition of P increase yield from 2 to 4 fold. The work by Kaitibie et al (2002) documented an additional aspect of banding P. In the variable and often arid climate of Oklahoma the activation of lime can take a significant amount of time, in upwards of one year. In comparison banding P has an immediate impact on the alleviation of metal toxicities. Figure 4 shows the incorporation of lime improved forage yield but not to the degree of banding P. For continuous winter wheat producers the time between application of lime and planting can be quite short. Typically the previous crop will be harvest in mid-June and in the best case scenario lime would be applied and incorporated by mid-July. At this point there is only 60 days until the next wheat crop is planted in early to mid-September.
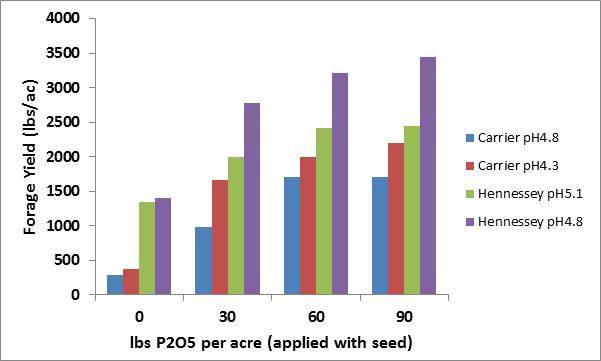
Figure 3. The impact of banding phosphate with seed at planting in acidic soils on winter wheat forage production in Oklahoma. Chart adapted from Boman et al. 1992.

Figure 4. The impact of applying of phosphate fertilizer and lime on the forage production of two winter wheat cultivars in Oklahoma. Chart adapted from Kaitibie et al. 2002.
For many with short term leases banding P is still the only viable solution for wheat production in low-pH soils. However there is ground being farmed by the owner or is under long-term lease that is still receiving this Band-Aid approach. At the 1980-1990 fertilizer and lime prices there is good reason to continue this method. However the cost of P fertilizer has quadrupled since the 1970’s. The last ten year average price of P2O5 was $0.42 per pound while it cost an average of $0.10 in the 70s. So for those who own or are able to work out beneficial lease agreements Table 1 should be of interest. By year three the cost of phosphate exceeds the cost of lime. If you were to use the values from the 1980’s of $0.20 per pound of P2O5 and $25 per ton ECCE lime it was not until year five, the last year before reapplying lime, did the cost of P exceed cost of lime.

Table 1. Cumulative cost per acre of applying phosphorus and lime to remediate aluminum and manganese toxicity based on a five year liming cycle. The 30 lb P2O5 rate is recommended for grain only production while dual-purpose wheat require 60 P2O5. Prices based on current quotes of DAP at $590 a ton ($0.41 lb P2O5) and Ag lime at $30 per ton ECCE.
As the 2014 winter wheat and canola crop is being transported to the bins it is extremely important to take advantage of this time to take soil samples from as many fields as possible. Soil pH issues must be understood and addressed. I often remind producers soil pH plays an exception number of roles. Not only does it impact yield as shown before but it impacts rooting (ability to survive stresses), nutrient availability, and herbicide activity. Our SU herbicides (Finesse, Powerflex, and Maverick) that are used widely across the state are negatively impacted by low soil pH. Figure 5 shows how at a pH of 5.6 Glean is down to a 50% concentration in the soil approximately two weeks after application. So when it comes time to make the call for phosphorus or lime try to weigh all of these aspects, at current prices P is not that much cheaper, improving pH will improve yield and potentially improve weed control.
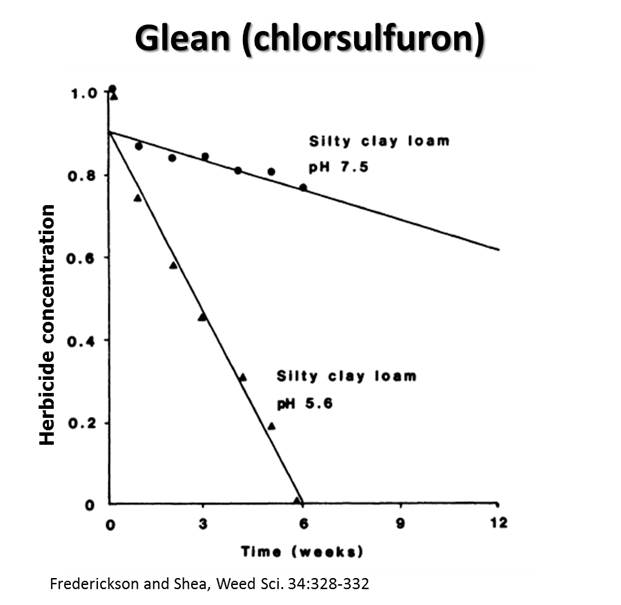
Figure 5. The concentration of Glean (Cholorsulfuron) remaining in too soils (pH 7.5 and pH 5.6) over a twelve week period.
Citations
Boman,R.K., R.L. Westerman, G.V. Johnson, and M.E. Jojola. 1992. Phosphorus fertilization effects on winter wheat production in acid soils. In Soil Fertility Highlights, Agronomy Department Oklahoma Agricultural Experiment Station, Oklahoma State University.Agronomy 92-1 pg171-174
Kaitibie,S., F. M. Epplin, E.G. Krenzer, and H. Zhang. 2002. Economics of lime and phosphorus application for dual-purpose wheat production in low-pH soils. Agron. J. 94:1139:1145.
Kariuki, S.K., H. Zhang, J.L. Schroder, J. Edwards, M. Payton, B.F. Carver, W.R. Raun, and E.G. Krenzer. 2007. Hard red winter wheat cultivar responses to a pH and aluminum concentration gradient. Agron J. 99:88-98.
Sensing the N-Rich Strip and Using the SBNRC
Original Post:
With the significant swing in temperature over the last few weeks many are chomping at the bit to get outside. The wheat is starting to respond to the good weather and N-Rich Strips are showing up around the state. Over the past week I have had several calls concerning the impact of the cold weather on the N-Rich Strips. Many of the fields either are still small due to limited days of warm weather and growth or may have a good deal of damage to the foliage. If the field of concern has only a little or no damage and the strip is visible, the time to go is NOW, but if you cannot see the strip and your field has tissue damage or is small, similar to the first two images, then you will need to wait a week or two for sensor based recommendations. Another situation fits with the third image, the field has freeze damage but the N-Rich Strip is also visible. In this case the predicted yield level would be reduced do to the dead tissue making the N rate recommendation a little off. I still however recommend using the sensor and online SBNRC (http://www.soiltesting.okstate.edu/SBNRC/SBNRC.php) to make or base top-dress N rate. Even if the recommendation is a little off it will still be much more accurate than just guessing. However you must look at the SBNRC and ensure that it makes agronomic sense, if it does not consult your county educator or myself. This is discussed in more detail in my earlier blog about freeze damage. Keep in mind no matter what, if you can see the N-Rich Strip, everything outside of the strip is suffering from nitrogen deficiency. Decisions and fertilizer applications need to be made soon, to maximize yield.
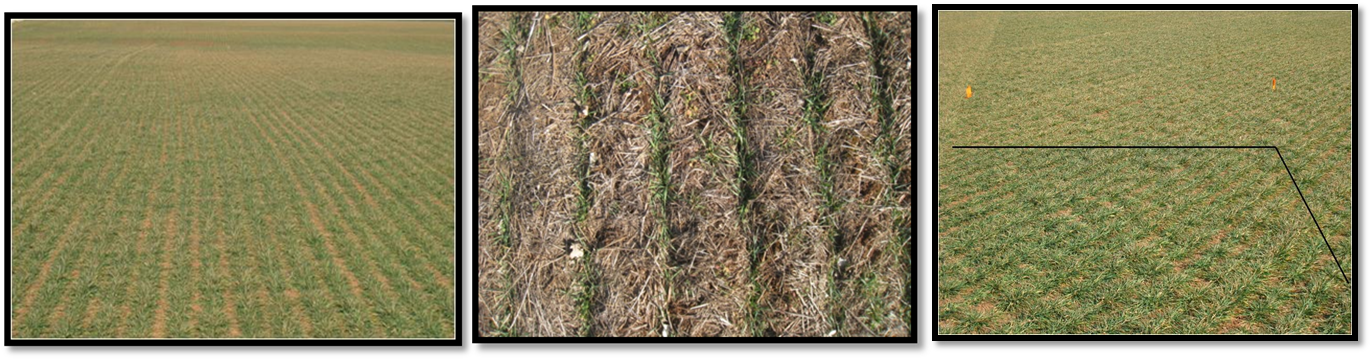
Winter Wheat and Nitrogen Rich Strips.
Regardless of whether or not the strip is visible you should be planning to sense with the GreenSeeker Handheld very soon. Remember the sensor has the ability to detect differences before your eyes can. To sense the N-Rich Strip and Farmer Practice the user should carry the sensor approximately 30 to 40 inches above the crop canopy while holding the sensor level over the crop. While you are walking the two area the trigger should be held the entire time. I recommend walking at minimum 100 paces for each. The average NDVI value seen on the screen will only stay on the screen for a few seconds. Therefore it is critical you have a method of recording the number for later use. The sensor has limited memory so it will time out is the trigger is held for an extended period of time. If you wish to collect more NDVI readings just do it in multiple trigger pulls recording each. Once you have the average NDVI for the N-Rich Strip and Farmer Practice you can go to the SBNRC site mentioned above to retrieve the N rate recommendation. Once in the calculator, for those in Oklahoma, choose the “within Oklahoma” option in the bottom left hand corner of the screen. This will allow the calculator to access the Oklahoma Mesonet to determine growing degree days. After the location is picked from the options you will need to enter Planting Date and Date Prior to Sensing. Additional information requested is the expected grain and fertilizer prices. While these inputs will provide some economic evaluations they will not impact recommended N rate.
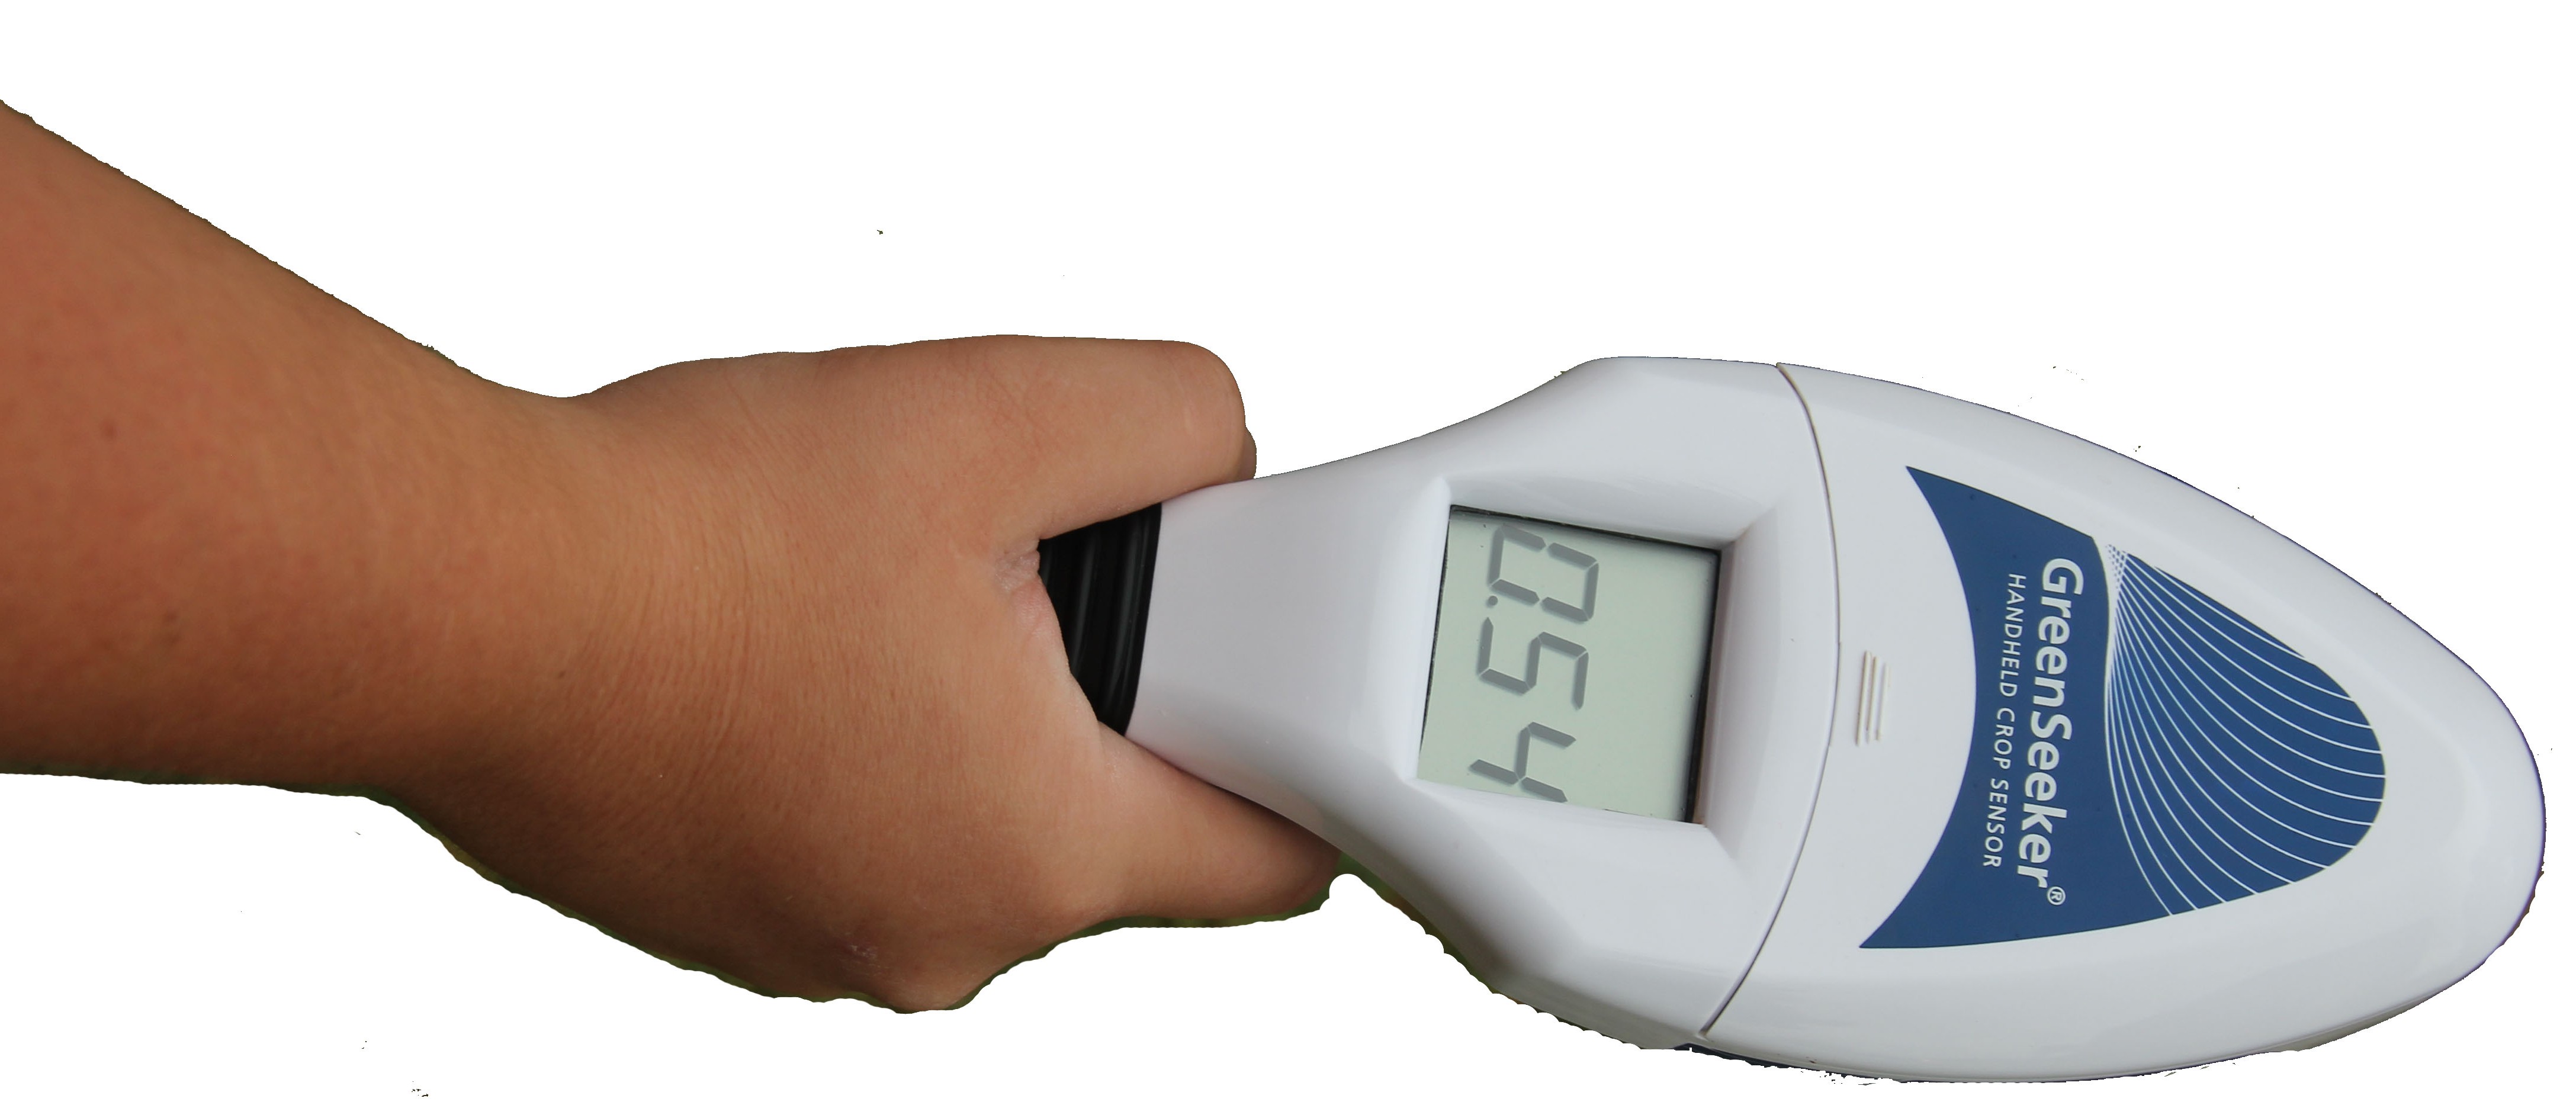
GreenSeeker HandHeld NDVI Sensor
Below is a YouTube video in which I describe how to use the GreenSeeker to collect NDVI readings, describe the data needed to complete the online calculator, and how to interrupt the calculators output.

First hollow stem advisor available on Mesonet
This is a great tool. It looks like we have very little time between green-up and hollowstem.
The advisor uses a mathematical model that predicts the probability of first hollow stem based on soil heat units and wheat first hollow stem category (early, middle, or late). The model was developed by J.D. Carlson at OSU using first hollow stem data from the wheat variety testing program, and model development was made possible through a grant from the Oklahoma Wheat Commission.
You can navigate to…
View original post 322 more words
Time to start topdressing wheat
Great write up by Dr. Edwards.
There are few crop inputs that deliver as much return on investment as nitrogen fertilizer. It takes approximately two pounds of nitrogen, costing approximately $1.00, to produce one bushel of grain worth about $6.00. Of course, nitrogen is not the only yield determining factor in a wheat crop. Also, the law of diminishing marginal returns eventually kicks in, but nitrogen fertilizer is still one of the safest bets in the house.
Top dress nitrogen fertilizer is especially important because it is applied and utilized at a time when the plant is transitioning from vegetative to reproductive growth. Several things, including the number of potential grain sites, are determined just prior to jointing and it is imperative that the plant has the fuel it needs to complete these tasks. Jointing also marks the beginning of rapid nitrogen uptake by the plant which is used to build new leaves, stem, and the…
View original post 659 more words

