Raedan Sharry, Precision Nutrient Management Ph.D. student
Brian Arnall, Precision Nutrient Management Extension Specialist
Cotton production in Oklahoma has expanded the past decade into areas which other production systems such as continuous wheat may have traditionally dominated. Fields that have been managed for continuous wheat production may have become acidic in response to management practices, such as the use of ammoniacal nitrogen fertilizers. In response to the acidification of these soils it may be important to recognize and understand the potential impacts of soil acidification on cotton production.
To better document the impact of soil pH on cotton lint yield and quality a study was conducted over the 2019 and 2020 growing seasons at two locations: Stillwater, OK (EFAW farm) and Perkins, OK. Soil pH in these experiments were adjusted to a depth of approximately 6 inches using aluminum sulfate (acidifying) and hydrated lime (alkalinizing). All three locations were planted to two varieties; NexGen 3930 and Deltapine 1612 at a rate of approximately 35,000 seeds per acre, into plots with soils ranging in pH from 4.0 to 8.0.
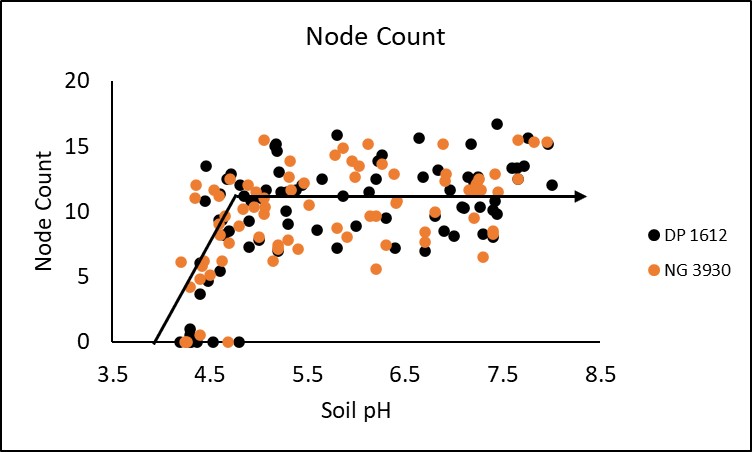
In season measurements taken included stand count, plant height, node count and NDVI (normalized difference vegetative index. All four in season measurements demonstrated a significant critical threshold in which soil pH negatively impacted crop performance. Stand was significantly decreased at a soil pH of 5.3 or lower. This trend is displayed in Figure 1. Plant height and node count depicted in figures 2 and 3 respectively were both significantly decreased when soil pH dropped below 5.3 and 4.9, while NDVI began to deteriorate around a pH of 5.1 (Figure 4). Response to soil pH level was also visually observable as shown by Figure 5 from the Perkins 2019 location.


Yield levels across this experiment ranged from 0 to 1284 lbs. of lint per acre. In this work yield is reported as relative yield. To calculate relative yield the yield of each plot is normalized to the average of the three highest yields for that site. This method of reporting yield response allows this work to be applied across a range of yield environments.

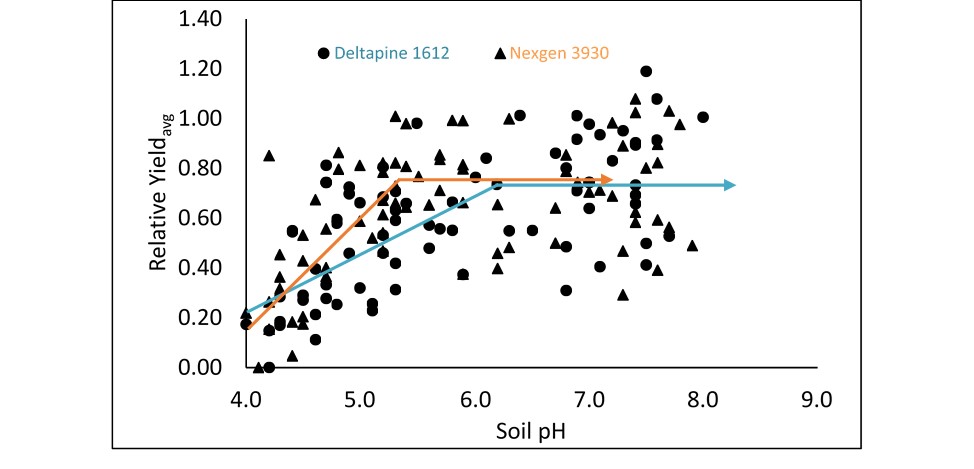
When all sites and cultivars were combined relative yield reached a plateau at approximately 73% of yield with a critical threshold observed at a pH of 5.4. Below this critical threshold yield decreased at a rate of 37% per point of pH decline. This equates to 15% yield loss at a pH of 5.0, 33% yield loss at a pH of 4.5, and 52% yield loss at a pH of 4.5. This relationship is depicted in Figure 6. It is important to note that yield was 0 when pH was 4.3 in two plots. This represents the possibility for total crop failure when planting into very acidic conditions.
Differences in relative yield between cultivars were insignificant. However, further investigation may produce a significant difference. Critical threshold for the DP 1612 and NG 3930 cultivars were 6.1 and 5.2 respectively. This suggests that there may be value in further examining the influence of genetics on cotton response to soil acidity.
SUMMARY
The influence of soil pH level on cotton productivity is confirmed by this study. All three sites evaluated provided a strong correlation between soil pH and lint yield, as well as the in-season growth parameters measured. While this study is likely to be expanded to another location to provide a more robust evaluation of the potential impact of soil acidity on cotton, the current dataset provides ample evidence to conclude that soil acidity is likely to be detrimental to cotton production in the southern plains. Soil pH levels below 5.5 appear to provide the greatest opportunity for yield loss as depicted above. Lint quality measurements taken in the study (micronaire, length, uniformity, and strength) showed no consistent trends in the relationship between quality parameters and soil pH suggesting that soil acidity had a limited influence on lint quality characteristics. Cotton response to soil pH is likely to be influenced by the environment of a specific location and growing season. This underlines the importance of understanding the soil properties that negatively impact productivity, such as the presence of toxic forms of aluminum or manganese. It is also important to highlight the possibility of acidic conditions significantly affecting the ability of the crop to access important nutrients such as phosphorus. Under acidic conditions cotton productivity is likely to be significantly decreased unless soils are neutralized using a soil amendment such as lime.
Project Supported by the
Oklahoma Cotton Council
Cotton Incorporated
Oklahoma Fertilizer Checkoff Program
