Home » Nitrogen (Page 5)
Category Archives: Nitrogen


2015-16 Wheat Crop Nitrogen Review
From trials to phone calls (and text messages, and tweets, and ect. ect) I have gathered a fairly good picture of this years winter wheat nitrogen story. And as normal, nothing was normal. Overall I seen/heard three distinct trends 1) Did not take much to make a lot 2) took a ton to make a lot 3) saw a response (N-rich strip or cow-pow) but fertilizer never kicked in. Covers most of the options, doesn’t it.

The N-rich strips really came out over all very good this year. N-Rich Strip Blog. On average many of those using the N-Rich Strip and SBNRC (SBNRC Blog) producers have been getting in the neighborhood of 1.0-1.3 lbs of N applied per bushel produced. This year the numbers ran from 0.66 to 2.3 lbs of N per bushel. In both extremes I believe it can be explained via the field history and the N-Cycle.

Nitrogen Cycle Pete’s Sheet
In at least two fields, documented with calibrated yield monitors, the N-Rich Strip and SBNRC lead to massive yields on limited N. One quarter of IBA bumped 86 bpa average on 47 lbs of N while a second quarter, also IBA, managed 94 bpa average on about 52 units of N. We are currently running grain samples from these fields to look protein levels.
The other side of the boat were those with N-Rich strip calling for +2.0 lbs N per bushel. I had received notes from producers without N-rich strips saying that they could predict yield based on the amount of N applied and it was a 2 to 1 ratio. Not always but many of these high N demand fields where wheat following a summer or double crop or corn or sorghum. While many of the low N demand fields were wheat after wheat or wheat after canola. In a rotational study that had been first implemented in the 2014-15 crop year I saw big differences due to previous crop. The picture below was taken in early March. The straw residue in wheat after wheat had just sucked up the nitrogen. While it was evident the residue from the canola broke down at a much more rapid pace releasing any and all residual nutrients early.

The yield differences were striking. The canola rotation benefited the un-fertilized plots by 22 bpa and even with 90 lbs of N applied having canola in the rotation increased yields by 12 bpa. We are looking and grain quality and residual soil sample now. I am sure there will be a more indepth blog to follow.

Canola Wheat Rotation study year two yield average. yields average across previous years N-rates.
Another BIG story from the 2015-16 wheat crop was the lack of benefit from any N applied pre-plant. It really took top-dress N this year to make a crop. Due to our wet early fall and prolong cold winter N applied pre was either lost or tied up late. Work by Dr. Ruans Soil Fertility Program really documented the lack luster pre-plant N effect. The figure below shows 4 location of a rate by timing student. The number at the bottom of each graph is a rate by time (30/0 means 30 lbs Pre-0 lbs Top, 60/30 means 60 lbs Pre-30 lbs Top). At every single location 0/60 beat 60/0. Top-dress N was better than Pre-plant N.

Figure 1. Work from Ethan Driver and Dr. Bill Raun. Study looked at rate and timing of N fertilization in wheat. Treatments are ordered by total N applied.
The last observation was lack of response from applied N even though the crop was deficient. Seen this in both the NE and NW corners. I would hazard with most of the circumstance it was due to a tie up of applied N by the previous crops residue. The length at which the winter stretched into spring residue break down was also delayed.
Take Home
Here it is folks APPLY NITROGEN RICH STRIPS. Just do it, 18 years of research preformed in Oklahoma on winter wheat says it works. Hold off on heavy pre-plant N even if anhydrous is cheap. It does matter how cheap it is if it doesn’t make it to the crop. Will we see another year like 2015-16, do not know and not willing to place money on either side. What we do know is in Oklahoma split applying nitrogen allows you to take weather into account and the N-Rich strip pays dividends.
There are several fact sheets available on top-dressing N and the application of N-Rich strips. Contact your local Oklahoma Cooperative Extension Service county educator to get a copy and see if they have a GreenSeeker sensor on hand.
DAP vs MAP, Source may matter!
Historically the two primary sources of phosphorus have had different homes in Oklahoma. In general terms MAP (11-52-0) sales was focused in Panhandle and south west, while DAP (18-46-0) dominated the central plains. Now I see the availability of MAP is increasing in central Oklahoma. For many this is great, with MAP more P can be applied with less material. which can over all reduce the cost per acre. There is a significant amount of good research that documents that source of phosphorus seldom matters. However this said, there is a fairly large subset of the area that needs to watch what they buy and where they apply it.
If you are operating under optimum soil conditions the research shows time and time again source does not matter especially for a starter. In a recent study just completed by OSU multiple sources (dry, liquid, ortho, poly ect ect) of P were evaluated. Regardless of source there was no significant difference in yield. With the exception of the low pH site. The reason DAP was so predominate in central Ok, soil acidity. See an older blog on Banding P in acidic soils.
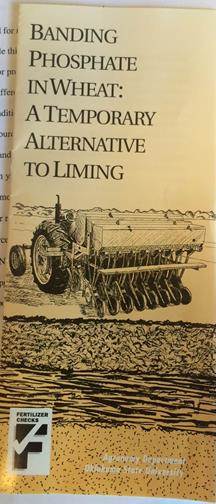
Figure 1. The cover of an extension brochure distributed in Oklahoma during the 1980s.
When DAP is applied, the soil solution pH surrounding the granule will be alkaline with a pH of 7.8-8.2. This is a two fold win on soil acidity aka aluminum (Al) toxicity. The increase in pH around the prill reduces Al content and extends the life of P, and as the pH comes back down the P ties up Al and allows the plant to keep going. However, the initial pH around the MAP granule ranges from an acid pH of 3.5-4.2. There is short term pH change in the opposite direction of DAP, however the the Al right around the prill becomes more available and in theory ties up P even faster.
Below is a table showing the yield, relative to untreated check, of in-furrow DAP and MAP treatments in winter wheat. The N401 location had a ph 6.1 while Perk (green) has a pH of 4.8. At Perkins in the low pH, both forms of P significantly increased yeild, almost 20 bushel on the average. DAP however was 5 bushel per acre better than MAP. At the N40 site the yield difference between the two sources was 1 bushel.
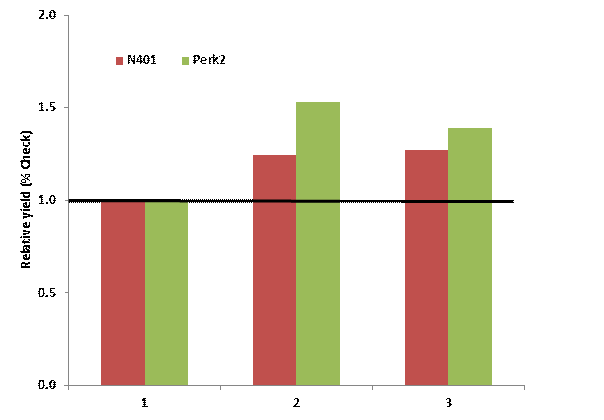
Relative yield winter wheat grain yield MAP and DAP both applied at equal rates of P (32 lbs P2O5 ac) when compared to a untreated check.
In general it can be said that in acid soils DAP will out preform MAP while in calcareous high pH soils MAP can out preform DAP. So regarding the earlier statement about the traditional sales area of MAP or DAP if you look at the soil pH of samples went into the Oklahoma State University Soil, Water, and Forage Analytical lab the distribution makes since.

Average soil pH of samples sent into OSU soil water forage analytical lab by county.
In the end game price point and accessibility drives the system. In soils with adequate soil pH levels, from about 5.7 to around 7.0, get the source which is cheapest per lbs of nutrient delivered and easiest to work with. But if you are banding phosphorus in row with your wheat crop because you have soil acidity, DAP should be your primary source.
Herbicide and UAN tank mixed for top-dress
Spring is the time that many wheat producers apply herbicide and nitrogen (N) fertilizer. For many this can be accomplished in a single pass by tank mixing the herbicide and UAN. In most cases this is an effective practice which eliminates one pass over the field. There are some scenarios in which this practice is ill advised. One such scenario is high temperatures which would lead to excessive leaf burn and crop damage. The other scenario is no-till and that will be the focus of this article. Ruling out warm temperature tank mixing herbicides and nitrogen, assuming the herbicide can be tank mixed, is a good practice. No-till on the other hand can be a different issue.
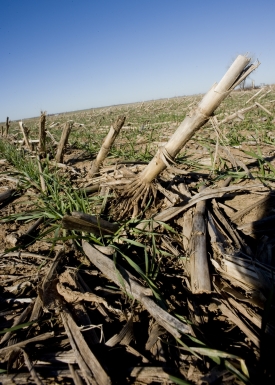
Situations with a lot of residue and smaller wheat is common during top-dress.
The problem in no-till comes from the liquid application method needed to apply herbicides, flat flan. To get a good kill with the herbicide the spray pattern needs to have good coverage, i.e a lot of small droplets to ensure maximum surface area impacted. Unfortunately there are four primary fates of UAN when applied via flat fan nozzles. The UAN could be taken directly up into the wheat plant via absorption through the leaves, the UAN could reach the soil and go into the soil solution or absorbed onto the soil itself, the UAN can be taken up by weeds, or the UAN droplet may hit dead plant tissue and be adsorbed into the residue.
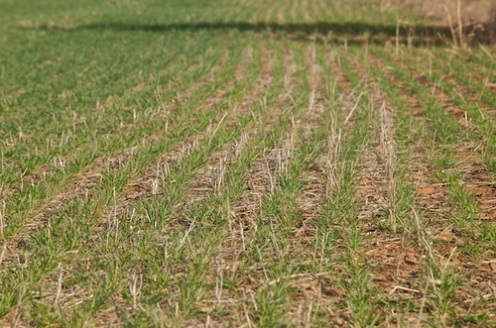
UAN applied with a flat fan will hit a growing plant, the soil, or residue.
The fourth fate of UAN presented is what can make the tank mix less efficient than a two pass system. In a no-till system any UAN that hits residue should be counted as lost, for the short term. The decision to go with a one pass or two pass system can be aided by evaluating the amount of canopy coverage. For example if the no-till field has 50% canopy coverage then one could estimate 50% of the UAN applied via a one pass system would be tied up in the residue. The cost of a second application could then be compared to the lost N. If 15 gallon of 28-0-0 was being applied then approximately 22.5 lbs of N would be tied up by the straw. At a price of $0.40 per lb on N, that is $9.00 worth of N. Conversely if the canopy coverage was 80% only 20% or 9 lbs of N would be tied up in the residue. Saving the $3.60 in nitrogen would not justify a second trip over the field. Luckily OSU recently released the Canopeo app which uses a cell phones camera to take pictures and quickly and accurately determine % canopy coverage. Canopeo is available for iOS and android http://canopeoapp.com/.


In fields with a high amount of residue or limited canopy coverage UAN should be applied with streamer nozzles. This will concentration the fertilizer into streams which will allow the UAN to have enough volume to move off the residue and into the soil.


So as the decision is being made to tank mix herbicide and UAN or make two passes take into consideration: % canopy coverage, rate of UAN (how much could be lost), cost of UAN per pound, and cost of a second trip over the field.
Below is an excerpt from the publication Best Management Practices for Nitrogen Fertilizer in Missouri; Peter C. Scharf and John A. Lory. http://plantsci.missouri.edu/nutrientmanagement/nitrogen/practices.htm
Broadcasting UAN solution (28 percent to 32 percent N) is not recommended when residue levels are high because of the potential for the N in the droplets to become tied up on the residue. Dribbling the solution in a surface band will reduce tie-up on residue, and knife or coulter injection will eliminate it. Limited research suggests that the same conclusions probably apply for grass hay or pasture. Broadcast UAN solution is also susceptible to volatile loss of N to the air in the same way as urea, but only half as much will be lost (half of the N in UAN solution is in the urea form).


Canola fertilizer rates when skip row seeding.
When drilling canola a common strategy to improve seeding rate accuracy is to only use every other row which effectively doubles the rate of seed going through each meter. There are also many producers who utilize air seeders and just prefer the wider spacing. Every season I get several questions about determining total fertilizer rates if the seed is dropped every other row but fertilizer is dropped every row. Regardless of whether or not fertilizer goes down every row it is important that the amount of salts placed with seed does not exceed the limit. The table below provide the limits in terms of lbs of salt per acre. If using 18-46-0 (DAP) or 11-52-0 (MAP) this is equivalent to pounds of N per acre. However if the fertilizer you use contains potassium (K) or sulfur (S), those have to be considered. An easy rule of thumb for determining total salt level of a fertilizer is pounds of N + K + 1/2 S.

Maximum amount of salt that can be applied in furrow with canola seed. Application rate should be at or below this value.
In a scenario in which canola is seeded in skip rows but every row will get fertilizer the total amount of fertilizer can be doubled. For example on a 15″ row spacing the max salt rate is 5 lbs per acre. If you were using DAP as your starter that maximum rate to place in furrow would be 28 lbs of DAP per acre. If using a drill set of 7.5″ spacing and putting fertilizer down every row the max rate would increase up to 56 lbs DAP per acre.

Seed, colored blue, is placed in every other row while an equal amount of fertilizer, dark grey circles, is placed in every row.
Some producers may have the capability of applying different rate in every other row. In this scenario it is important to maintain that safe rate in the seed furrow. In the opposite row, fertilizer rate can go as high as you wish or the equipment can handle.
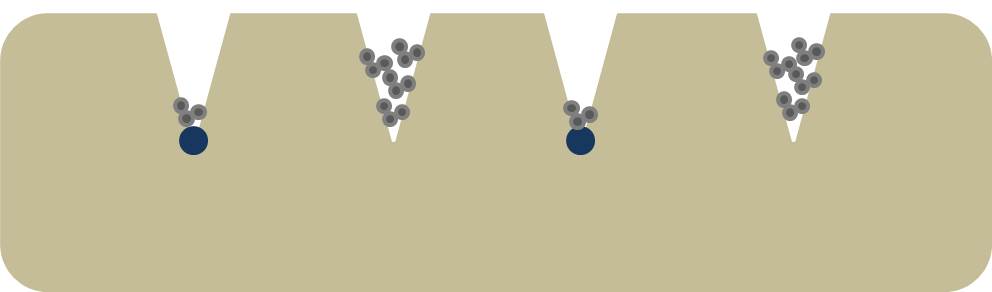
Seed, colored blue, is placed in every other row while fertilizer, dark grey circles, is placed in every row. In this scenario a high rate is placed in the row without seed.
Now the big question is, “Is between row fertilization a good idea?” While we do not have results on this style of application (trials will be going out this year) we can draw upon upon similar work in other crops. For me the best win would be the second scenario in which a higher rate could be place between the rows. In this row I would use a urea and DAP blend. Any time we can put urea below the soil surface its a win and in fields with very soil soil test phosphorus (P) it would create something similar to the deep P bands once popular in corn production. Now if the field had adequate soil test P, I would focus on urea between rows. Keep in mind it is never a good to place urea in furrow with canola seed. For the average producer who is using a box drill the first scenario is the only option. In this case the rate of the between row bands will be reduced however I still believe on fields with very low soil test P this is potentially a great way to get the rest of it on. Remember if on 15″ and using DAP max rate only gets 12.9 lbs of P2O5 down. If fertilizer is dropped down every tube that number increases to about 26 lbs P2O5, which is still not enough for fields with low soil test P, but is better. With hope we will have some good results to share from the 2015-2016 canola crop.
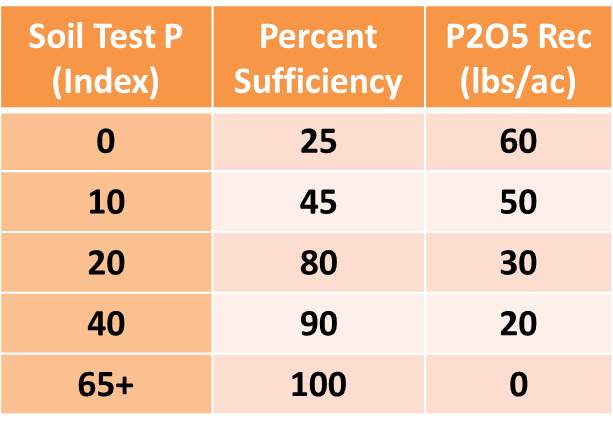
Phosphorus fertilizer recommendations based upon Mehlich 3 P test, reported as STP index (ppm * 2)
Some thoughts on pre-plant nitrogen and a little outside the box thinking
It is that time of year, every Co-op I drove by the other day had a line of trucks pulling anhydrous tanks and the spinner spreaders were being loaded. For those of you who haven’t applied your nitrogen yet lets discuss the options traditional and nontraditional.
Anhydrous Ammonia, 82-0-0: by far the most widely used N source is the southern Great Plains. While it is not the most enjoyable to work with it is the cheapest per pound of N and that leads to its wide spread use without Oklahoma wheat production. Just a few simple rules with NH3, get it in the ground and close the row behind you. In conventional till this is usually easier unless the ground is too wet or too dry. In no-till this may be a little more challenging but usually easily accomplished. With the rise in low disturbance applicators I am seeing more and more acres of no-till receiving NH3. Last year I was in a field of stripper stubble and I had a hard time finding where the rig had run, minus wheel tracks.
Urea, 46-0-0: is second on the hit list in nitrogen sales in our state. It is a safe source that is easily handled and applied. In a conventional till system where the urea can be worked in shortly after application it is a very efficient and effective source. Unfortunately when it is applied to the soil surface and rain is the method of incorporation we can experience between 5-60% N losses. The losses come from how urea is converted to plant available ammonium (NH4). For urea (NH2)2CO2, to be converted to plant available NH4 it needs the enzyme urease. Urease is present everywhere but in the highest concentrations on plant residue. The figure below shows the reaction, urease converts urea into NH3 as soon as the prill dissolves. In the presence of moisture the NH3 (gas) is turned immediately to NH4 (solid) and is absorbed onto the soil particle.
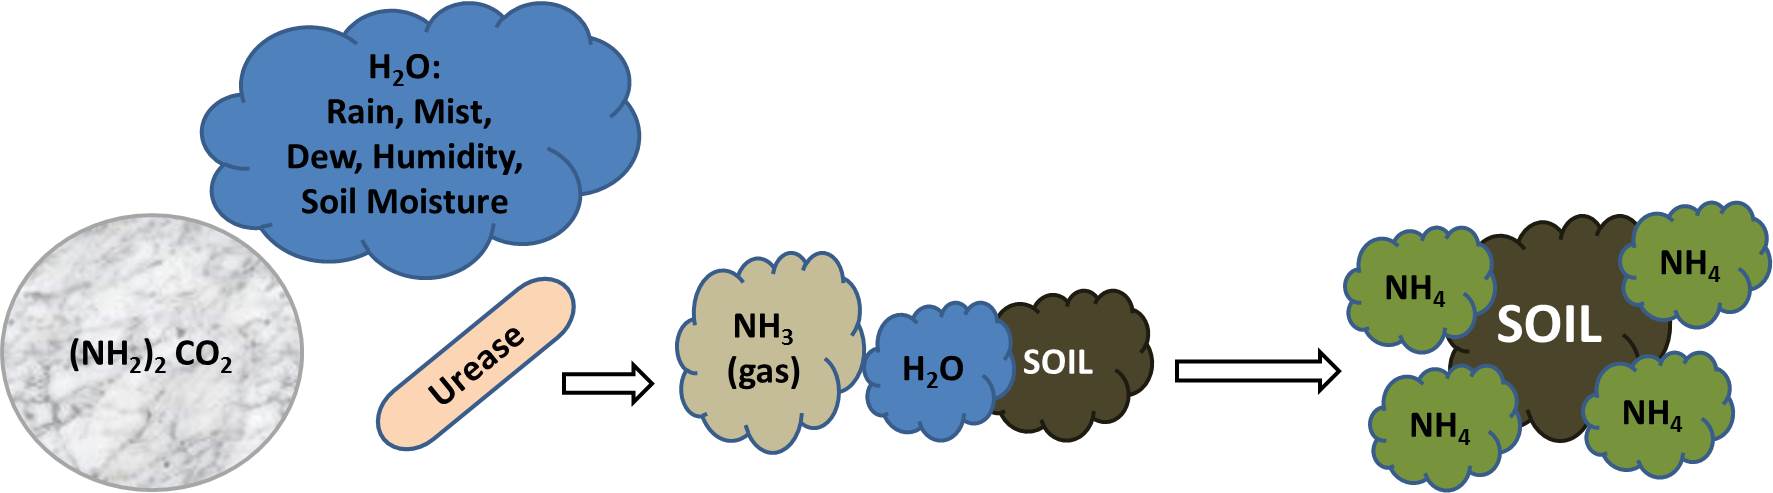
Graphic of Urea’s conversion to plant available ammonium.
The problems come when there is no soil particle for the NH4 to bind with. It usually takes 0.50 inches of rain or irrigation to fully dissolve and incorporate urea into the soil. So if we only get a few tenths or hundredths, even heavy dews, some of the urea will dissolve, be converted to NH3 then NH4 and be left on the plant/residue. When the moisture dries, some or all of the NH4 goes back to NH3 and will gas off into the atmosphere. I have even seen this happen when urea is applied on a wet/damp soil, not incorporated and it doesn’t rain for significant period of time. If the temps are cooler the urease is slower so less of the urea is converted to NH4, but if the temps are warm 60+ degrees these little enzymes can act very quickly.

Urea placed on the surface of a wet soil under two temperature regimes. White text is the number of hours after application.
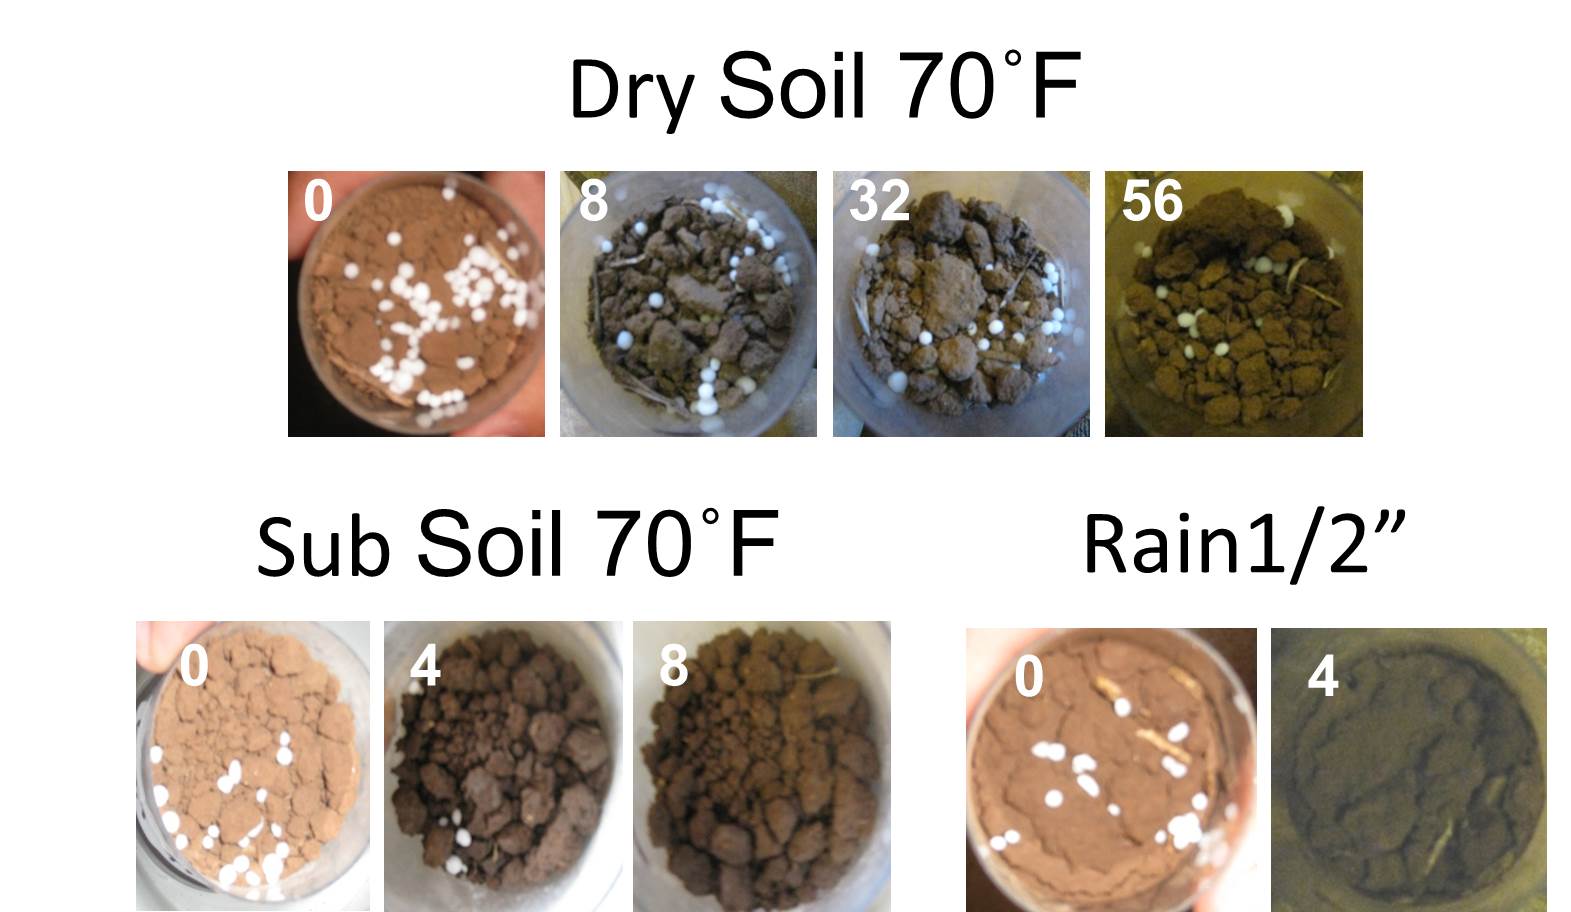
Urea placed on dry soil, Top row: dry soil no water added, Bottom left, moisture added from subsurface, Bottom right : simulated rain fall event of 1/2″. White text is the number of hours after application.
Below is a short video on using urea fertilizer.
While the recent rains are a blessing and will surely help germination, it is not aiding our N use efficiency especially in no-till. That is why in some parts of the state you may see some grain drills running right now. Some of those producers are not planting wheat they are actually applying there pre-plant urea. I have even been told in the SW part of the start some producers are using air-seeders to apply their urea. While this seems like a costly venture I have worked with the Ag Economist to create a calculator to figure up the break even for when it would pay to use an air-seeder over the traditional spinner spreader in no-till. We hope to put the finishing touches on it in the next few days. When it is completed it will be shared on this blog.
Liquid Urea Ammonium Nitrate, 32-0-0 or 28-0-0: while this is one of the more expensive forms of N many producers are utilizing this source because the can pre buy and store on site and as sprayer get larger they can cover a significant amount of ground quickly. For the most part UAN is used in no-till and is a great source. I always recommend that applicators use streamer nozzle or streamer bars to apply UAN. When UAN is applied via a flat fan nozzle it spreads the fertilizer across the residue allowing a significant portion to be tied up. The streamers concentrate the fertilizer into streams/bands reducing contact with residue and increasing the amount of UAN that reaches the soil surface.
Timing and Rates
The cost of anhydrous, about $0.1 to 0.12 less per pound N less than urea is driving its use this year. The lower price is also driving a significant about of producers to go with 100% of their N pre-plant. While this makes for sound economics now having all of your N upfront is like putting all of your eggs in one basket. If we do get that cold and wet winter as some are calling for this presents a great chance for the N to move down the soil profile and down the slope. I have always recommended split application. This allows a producer to judge the crop throughout fall, winter and even yearly spring and adjust his or her N plan accordingly. For those who plan to graze there is still a need to get enough N down to produce fall forage, this may be 50 to 80 lbs of N, but for grain only production planted later in the fall a typical crop may only need 20-30 lbs of N before going into winter. The old rules of thumb, 2 lbs N per bushel and 30 lbs N per 100 lbs of gain still work and are better than a guestimate but we have better ways. Right now is the time to plan to apply N-rich strip, a strip in the field with 40 to 50 lbs more than the rest of the field. These strips can be applied with a variety of applicators, but as long as the N goes down in at least an area 10 ft wide by 300 ft long it is good to go.

Just a few of the applicators used for putting out N-Rich Strips. ATV Sprayer, Receiver Hitch mounted Sprayer, Road sprayer with a rear boom, pull type spinner, large sprayer, push spreader. Not shown is NH3 applicator.
Below is a N-Rich Strip 101 video.
If you have got the N-Rich strips out you can set back and watch to see when and if they develop. If you can see the strip you know you need too fertilize.
While many are not ready to think about top-dressing yet, it is never too early. Don’t be afraid to think outside the box. Oklahoma’s springs tend to present the perfect conditions for N loss when urea is the primary N source. This year in a 4R Top-dress Nitrogen Application Demo, at Lahoma and Chickasha, we are going to apply just about every available commercial source in about every possible manor. Urea will be broadcast, coated with inhibitors, applied with a grain drill, NH3 will be knifed in, and UAN will be applied with flat fan nozzles, streamer nozzles and knifed in. As technologies improve and the cost of N remains relatively high the options for top-dress N application will continue to improve. The economics of wheat production don’t look great right now so don’t be afraid to think outside the box, even if it does raise the eyebrows of your neighbors. Fill free to contact myself or your local extension educator if you have any questions about N application.

John Deere double disk drill used to apply urea in-season.

WAKO NH3 applicator used for in-season application.
Sampling for pH and liming in continuous no-till fields
This article is written by Dr. David Mengel, Kansas State University Soil Fertility Specialist.
One question that commonly comes up with continuous no-till operations is: “How deep should I sample soils for pH?” The next common question is: “How should the lime be applied if the soil is acidic and the field needs lime?”
Sampling depth in continuous no-till
First, sampling depth. Should two sets of samples be taken, at different depths?
Our standard recommendation for pH is to take one set of samples to a 6 inch depth. On continuous no-till fields where most or all of the nitrogen (N) is surface applied, we recommend taking a second sample to a 3-inch depth. We make the same recommendation for long-term pasture or grass hayfields, such as a bromegrass field that has been fertilized with urea annually for several years.
Nitrogen fertilizer is the primary driving force in lowering soil pH levels, so N application rates and methods must be considered when determining how deep to sample for pH. In no-till, the effects of N fertilizer on lowering pH are most pronounced in the area where the fertilizer is actually applied. In a tilled system, the applied N or acid produced through nitrification is mixed in through the action of tillage and distributed throughout the tilled area.
Where N sources such as urea or liquid UAN solutions are broadcast on the surface in no-till system, the pH effects of the acid formed by nitrification of the ammonium will be confined to the surface few inches of soil. Initially this may be just the top 1 to 2 inches but over time, and as N rates increase, the effect of acidity become more pronounced, and the pH drops at deeper depths. How deep and how quickly the acidity develops over time is primarily a function of N rate and soil CEC, or buffering capacity.
Where anhydrous ammonia is applied, or liquid UAN is knifed or coulter banded below the surface, an acid zone will develop deeper in the soil, usually 2-3 inches above the release point where the fertilizer is placed in the soil. So if the ammonia is injected 8 inches deep, there will be acid bands 5 to 8 inches below the soil surface. As with long-term surface applications, these bands will expand over time as more and more N fertilizer is placed in the same general area. The graphic below illustrates the effect of a high rate of ammonia placed in the same general area in the row middle on a high CEC soil for more than 20 years.
The actual depth of the acid zone in fields fertilized with ammonia gets tricky as application depth can vary depending on the tool used to apply the ammonia. Traditional shank applicators generally run 6 to 8 inches deep, so a sample for pH measurement could be taken at 3-6 inches or 5-8 inches deep, depending on how deep the shanks were run. The new low-disturbance applicators apply the ammonia 4-5 inches deep. A sweep plow or V-blade applies ammonia only 3-4 inches deep. So sampling depth for pH should really depend on where the acid-forming N fertilizer is put in the soil.

Mengel and West, Purdue Univ.
Liming application methods in continuous no-till
Now, where do you place the lime in continuous no-till? If you surface apply N, then surface apply the lime. That’s a simple but effective rule. But remember that surface-applied lime will likely only neutralize the acidity in the top 2-3 inches of soil. So if a producer hasn’t limed for 20 years of continuous no-till and has applied 100 to 150 pounds of N per year, there will probably be a 4-5 inch thick acid zone, and the bottom half of that zone may not be neutralized from surface-applied lime. So, if a producer is only able to neutralize the top 3 inches of a 5-inch deep surface zone of acid soil, would that suggest he needs to incorporate lime? Not really. Research has shown as long as the surface is in an appropriate range and the remainder of the acid soil is above pH 5, crops will do fine.
Liming benefits crop production in large part by reducing toxic aluminum, supplying calcium and magnesium, and enhancing the activity of some herbicides. Aluminum toxicity doesn’t occur until the soil pH is normally below 4.8. At that pH the Al in soil solution begins to increase dramatically as pH declines further. Aluminum is toxic to plant roots, and at worse the roots would not grow well in the remaining acid zone.
This implies that the acid zones from ammonia are probably not a major problem. We have monitored ammonia bands in the row middles of long-term no-till for many years and while the pH got very low, below 4.5, we never saw any adverse impacts on the crop that would justify liming and using tillage to incorporate the lime. In fact, some nutrients such as zinc, manganese, and iron can become more available at low pH, which can be an advantage at times.
Yield enhancement is not the only concern with low-pH soils, however. Herbicide effectiveness must also be considered. The most commonly used soil-applied herbicide impacted by pH is atrazine. As pH goes down, activity and hence performance goes down. So in acid soils weed control may be impacted. We do see that in corn and sorghum production.
Liming products for no-till
When choosing a liming product, is there any value to using dolomitic lime (which contains a large percentage of magnesium in addition to calcium) over a purely calcium-based lime product? On most of our soils in Kansas we are blessed with high magnesium content. So as long as we maintain a reasonable soil pH, there normally is enough magnesium present to supply the needs of a crop. Calcium content is normally significantly higher than magnesium, so calcium deficiency is very, very rare in Kansas. The soil pH would need to be below 4.5 before calcium deficiency would become an issue. Before calcium deficiency would occur, aluminum toxicity or manganese toxicity would be severely impacting crop growth. So producers really don’t have to worry about a deficiency of calcium or magnesium on most Kansas soils.
What about the use of pelletized lime as a pH management tool on no-till fields? The idea has been around for a while to use pel-lime in low doses to neutralize the acidity created from nitrogen and prevent acid zones from developing. There is no reason it won’t work, if you apply enough product each year. Pel-lime is a very high-quality product, normally having 1800 to 2000 pounds of effective calcium carbonate (ECC) per ton, and can be blended with fertilizers such as MAP or DAP or potash easily.
But it is costly. As an example, at a cost of $160 per ton and 1,800 lbs effective calcium carbonate (ECC) per ton, 100 pounds of ECC pel-lime costs $8.80. If it costs $25 per ton to buy, haul, and apply a 50% ECC limestone, that equates to $2.50 per 100 pounds ECC.
If you were applying 100 pounds of urea-based nitrogen, it would take approximately 180 pounds of ECC to neutralize the acidity produced by the N. This would require 200 pounds of 1,800 pound ECC pel-lime or 360 pounds of 50% ECC ag lime. The cost would be around $16 per acre with pel-lime or $4.50 per acre with ag lime. So technically, the pel-lime option is fine. But it would cost more than 3 times as much, at least in this example. You can use your own figures regarding costs and ECC of different lime products available to you to do a similar calculation. Deciding which product to use is a simple economic choice.
Summary
Applying N fertilizer to soil will cause the soil to become acidic over time. Placement of the applied N and the level of soil mixing done through tillage determine where the acid zones will develop. Make sure your soil testing program is focused on the area in the soil becoming acidic, and apply the lime accordingly.
Dave Mengel
Kansas State University
Professor Soil Fertility Specialist
dmengel@ksu.edu
Time to start topdressing wheat
My favorite part of the blog “Don’t have an N-Rich Strip? It’d be a lot cooler if you did.”

There are few crop inputs that deliver as much return on investment as nitrogen fertilizer. It takes approximately two pounds of nitrogen, costing approximately $1.00, to produce one bushel of grain worth about $5.00. Of course, nitrogen is not the only yield determining factor in a wheat crop. Also, the law of diminishing marginal returns eventually kicks in, but nitrogen fertilizer is still one of the safest bets in the house.
Top dress nitrogen fertilizer is especially important because it is applied and utilized at a time when the plant is transitioning from vegetative to reproductive growth. Several things, including the number of potential grain sites, are determined just prior to jointing and it is imperative that the plant has the fuel it needs to complete these tasks. Jointing also marks the beginning of rapid nitrogen uptake by the plant which is used to build new leaves, stem, and the…
View original post 707 more words
How to make $100,000 in a day
This is a familiar soap box. SOIL SAMPLE, SOIL SAMPLE, SOIL SAMPLE.
No, this blog post is not about a get rich quick scheme, but there is a way for the average wheat farmer in the southern Great Plains to add $50,000 to $100,000 to the bottom line in a single day. Most soil tests I have pulled this summer have shown 50 to 90 lb/ac of NO3-N in the top 18 inches of soil. Ninety pounds of N equates to about $45 of N fertilizer, and this knowledge could save a 2,500 acre wheat farmer in excess of $100,000 in fertilizer cost. Soil testing is laborious, but the potential economic returns for spending a day or two soil sampling are outstanding.
There is still time to soil sample. Soil samples only take a few days to process once they are in the OSU lab. It is not unusual for transit time to the lab to the slowest part of the process…
View original post 219 more words
Nutrient Products: Stabilizers, Enhancers, Safeners, Biologicals and so on.
In this blog I am not going to tell you what to use or what not to use. In fact I will not mention a single product name. What I will do is hopefully provide some food for thought, new knowledge and direction.
First I want to approach a topic I have been called out on several times. I believe there is a stigma that University researchers and extension specialists do not want products to work. It may seem that way at times but it is far from the truth. The reality is that all of us are scientists and know someone may be inventing the product that changes nutrient management as we speak. The issue is that most of us have been jaded. While I may be younger I have over 11 years experience, testing “products” in the field, and that includes dozens of products. I have sprayed, spread, tossed, drilled, mixed and applied everything under the sun, with hopes that I will see that one thing I am always looking for, MORE GRAIN…
The truth is Everything works Sometimes yet Nothing works ALL the time. I and others in my profession do not expect anything to work 100% of the time, I am personally looking for something that will provide a checkmark in the win column 50% of the time. A win is the result of one of two things, more money in the producers pocket or less nutrients in the water or air. Products can increase vigor, nutrient uptake, chlorophyll concentration, greenness but not yield. What Co-op or elevator pays for any of those attributes? Grain makes green.


So many safeners, stabilizers, enhancers, biologicals, and on and on are available, so what should a producer do? Here are few things to think about. Ask yourself “ what part of my nutrient management plan can I get the most bang from improving”?
If the answer is Nitrogen (N) there are three basic categories: Urease inhibition, Nitrification inhibitor, and slow release. All are methods of preventing loss; the last two are preventing loss from water movement.
Urease inhibitors prevent the conversion of Urea to NH3 (ammonia). This conversion is typically a good thing, unless it happens out in the open. Ideally any urea containing product is incorporated with tillage or rain. However, in No-till when urea is broadcast and no significant rainfall events (>0.5”) occur, N loss is likely. The urea prill starts dissolving in the presence of moisture, this can be a light rain or dew, and urease starts converting urea into NH3. As the system dries and the day warms, if there was not enough moisture to move the NH3 into the soil the wind will drive NH3 into the atmosphere. Nitrogen loss via this pathway can range from 5% to 40% of the total N applied.
Graphic of Urea’s conversion to plant available ammonium.
Urea placed on a wet soil under two different temperatures. Number in white is hours after application.
Urea placed on a dry soil, on top no water added, bottom left is moisture from the subsurface, and bottom right is simulated rain fall of 1/2″. Number in white is hours after application.
Nitrification inhibitors prevent the conversion of NH4 into NO3. Both are plant available N sources but NH4 is a positively charged compound that will form a bound with the negatively charged soil particles. Nitrate (NO3) is negatively charged and will flow with the water, in corn country that tends to be right down the tile drainage. Nitrate will also be converted to gasses under wet water logged soil conditions. Nitrate is lost in the presence of water, this means I do not typically recommend nitrification inhibitors for western OK, KS, TX dryland wheat producers.
Slow release N (SRN) comes in a range of forms: coated, long chain polymer, organic and many versions in each category. Again, water is the reason for the use of SRN sources. Slow release N whether coated or other have specific release patterns which are controlled by moisture, temperature and sometimes microbes. The release patterns of SRNS are not the same and may not work across crops and landscapes. For instance in Oklahoma the uptake pattern of nutrients for dryland corn in the North East is not that same as irrigated corn in the West. The little nuances in the growth pattern of a crop can make or break your SRN.
While N products have been on the market for decade’s phosphorus enhancers and stabilizers are relatively new, resulting in many of my peers holding back on providing recommendations until field trials could be conducted. At this point many of us do have a better understanding of what’s available and are able to provide our regional recommendations. Phosphorus products are not sold to prevent loss like their N counterparts; they are sold to make the applied P more available. On a scale of 1 to 10, P reactivity with other elements in the soil is a 9.9. If there is available Ca, Mg, Fe, or Al, phosphorus is reacting with it. In the southern Great Plains it is not uncommon for a soil to have 3,000-5,000 lbs of available Ca, a soil with a pH of 4, yes we have many of those, will have approximately 64,000 lbs of Al in the soil solution. That’s a lot of competition for your fertilizer P and for any substance that is trying to protect it.
I have been testing “biologicals” of all shapes and forms since 2003. While I have not hit any homeruns I have learned quite a bit. Many of these products originate from up north where the weather is kind and organic matter (OM) is high. Where I work the average OM is 0.75% and soil temp is brutal and unforgiving. Our soil does not have many reserves to release nor is it hospitable to foreign bodies.

Soil temperature for Stillwater OK under sod and bare soil conditions. Graph from http://www.Mesonet.org.
I hope you are still hanging on as this next topic is a bit of a soap box for me. Rate, Rate, Rate this aspect is missed both by producers and academia and it drives me crazy. If your crop is sufficient in any growth factor adding more will not increase yield. It goes back to Von Liebig’s LAW of the Minimum. I see too many research studies in which products are tested at optimum fertilization levels. This is just not a fair comparison. On the other hand, time and again I see producers sold on a product because they applied 30% less N or P and cut the same yield. If you let me hand pick 100 farms in Oklahoma I could reduce the N rate by 30% of the average and not lose a bushel on 75 of the farms. Why? Because the rate being used was above optimum in the first place, there is no magic just good agronomy. The list of products that increase the availability of nutrients is a mile long. Increasing nutrient availability is all well and good if you have a deficiency of one of those nutrients. If you don’t, well you have increased the availability of something you did not need in the first place.
University researchers and extension professionals seem to live and die by the statistics, and are told so regularly. We do rely upon the significant differences, LSD’s, and etc to help us understand the likely hood of a treatment causing an effect. However if I see a trend develop, or not develop, over time and landscape regardless of stats I will have no problem making recommendations. The stats help me when I do not have enough information (replications).
Too wrap up, have a goal. Do not just buy a product because of advertised promises or because a friend sells it. There is a right time and place for most of the things out there, but you need to know what that is and if it suits your needs. I also recommend turning to your local Extension office. We do our best to provide unbiased information in hopes of making your operation as sustainable as possible. If you are looking at making sizable investments do some reading, more than just Google. Testimonies are great but should but should not be enough to cut a check. Google Scholar www.google.com/scholar is a good resource for scientific pubs. I have done my best to put together a list of peer reviewed publications and their outcomes. To make the review work I had to be very general about outcome of the research. Either the product increased yield or decreased environmental losses or it had no impact. This was not easy as many of the papers summarize multiple studies. I did my best to make an unbiased recommendation but some could be argued. http://npk.okstate.edu/Trials/products/Product_Peer_Review.8-21-2014.pdf

First hollow stem advisor available on Mesonet
This is a great tool. It looks like we have very little time between green-up and hollowstem.
The advisor uses a mathematical model that predicts the probability of first hollow stem based on soil heat units and wheat first hollow stem category (early, middle, or late). The model was developed by J.D. Carlson at OSU using first hollow stem data from the wheat variety testing program, and model development was made possible through a grant from the Oklahoma Wheat Commission.
You can navigate to…
View original post 322 more words

