Home » Posts tagged 'phosphorus' (Page 2)
Tag Archives: phosphorus

Nutrient Products: Stabilizers, Enhancers, Safeners, Biologicals and so on.
In this blog I am not going to tell you what to use or what not to use. In fact I will not mention a single product name. What I will do is hopefully provide some food for thought, new knowledge and direction.
First I want to approach a topic I have been called out on several times. I believe there is a stigma that University researchers and extension specialists do not want products to work. It may seem that way at times but it is far from the truth. The reality is that all of us are scientists and know someone may be inventing the product that changes nutrient management as we speak. The issue is that most of us have been jaded. While I may be younger I have over 11 years experience, testing “products” in the field, and that includes dozens of products. I have sprayed, spread, tossed, drilled, mixed and applied everything under the sun, with hopes that I will see that one thing I am always looking for, MORE GRAIN…
The truth is Everything works Sometimes yet Nothing works ALL the time. I and others in my profession do not expect anything to work 100% of the time, I am personally looking for something that will provide a checkmark in the win column 50% of the time. A win is the result of one of two things, more money in the producers pocket or less nutrients in the water or air. Products can increase vigor, nutrient uptake, chlorophyll concentration, greenness but not yield. What Co-op or elevator pays for any of those attributes? Grain makes green.


So many safeners, stabilizers, enhancers, biologicals, and on and on are available, so what should a producer do? Here are few things to think about. Ask yourself “ what part of my nutrient management plan can I get the most bang from improving”?
If the answer is Nitrogen (N) there are three basic categories: Urease inhibition, Nitrification inhibitor, and slow release. All are methods of preventing loss; the last two are preventing loss from water movement.
Urease inhibitors prevent the conversion of Urea to NH3 (ammonia). This conversion is typically a good thing, unless it happens out in the open. Ideally any urea containing product is incorporated with tillage or rain. However, in No-till when urea is broadcast and no significant rainfall events (>0.5”) occur, N loss is likely. The urea prill starts dissolving in the presence of moisture, this can be a light rain or dew, and urease starts converting urea into NH3. As the system dries and the day warms, if there was not enough moisture to move the NH3 into the soil the wind will drive NH3 into the atmosphere. Nitrogen loss via this pathway can range from 5% to 40% of the total N applied.
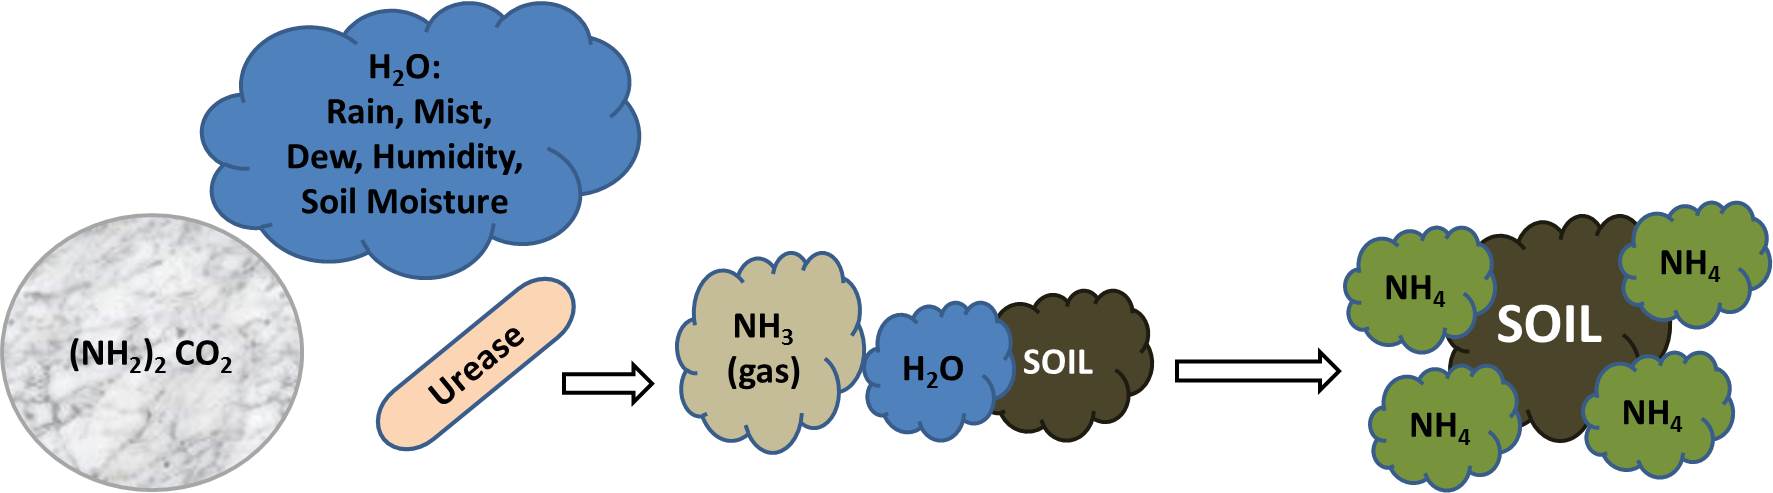
Graphic of Urea’s conversion to plant available ammonium.

Urea placed on a wet soil under two different temperatures. Number in white is hours after application.
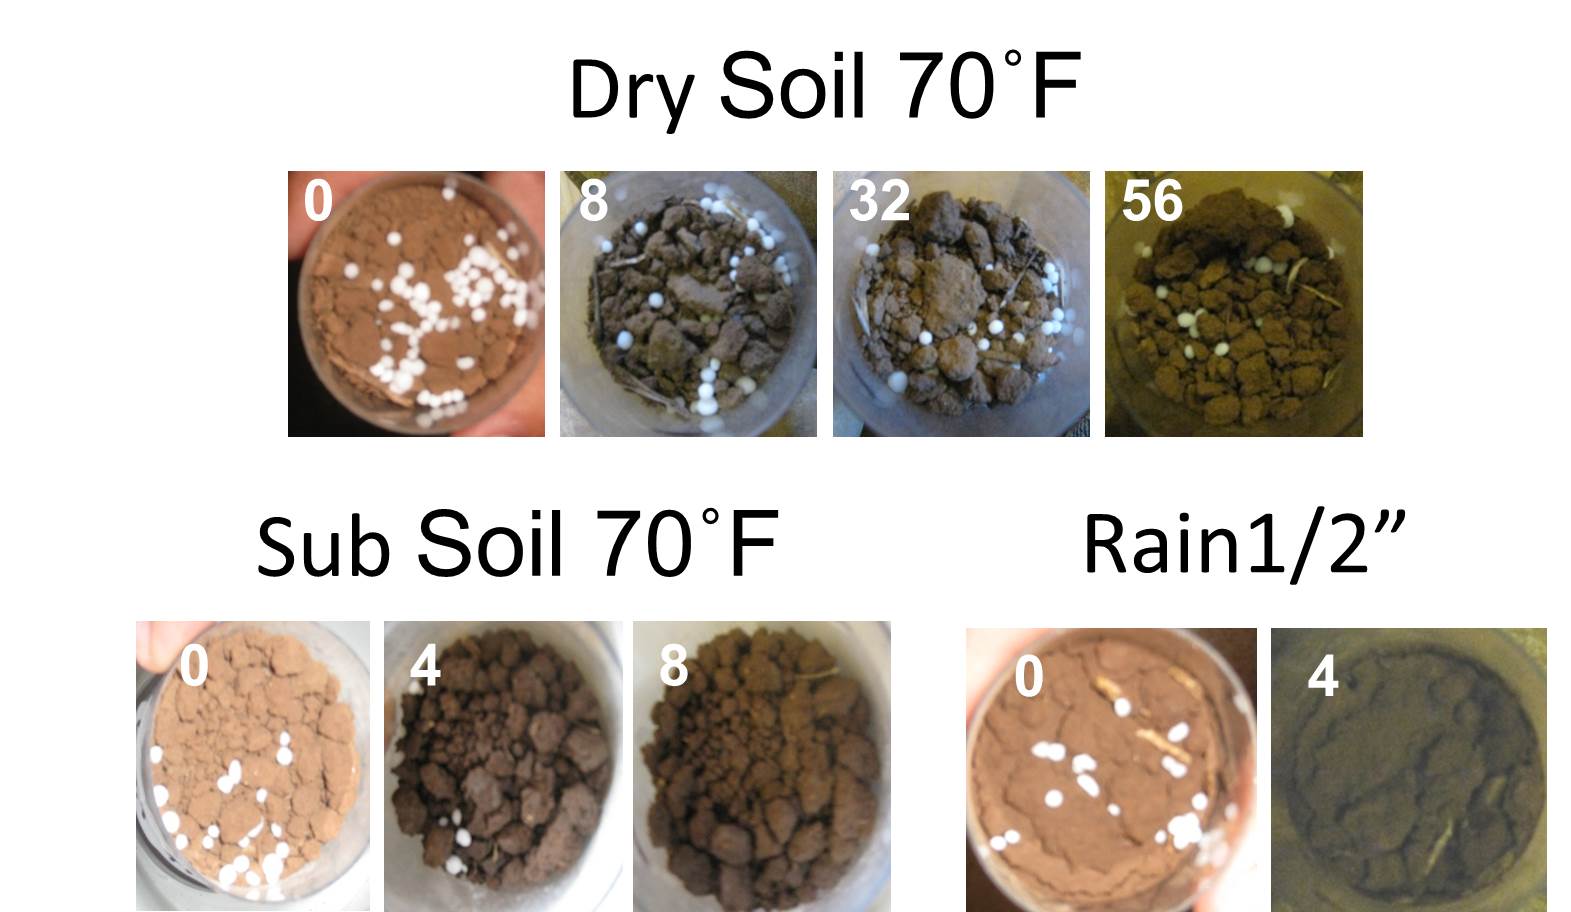
Urea placed on a dry soil, on top no water added, bottom left is moisture from the subsurface, and bottom right is simulated rain fall of 1/2″. Number in white is hours after application.
Nitrification inhibitors prevent the conversion of NH4 into NO3. Both are plant available N sources but NH4 is a positively charged compound that will form a bound with the negatively charged soil particles. Nitrate (NO3) is negatively charged and will flow with the water, in corn country that tends to be right down the tile drainage. Nitrate will also be converted to gasses under wet water logged soil conditions. Nitrate is lost in the presence of water, this means I do not typically recommend nitrification inhibitors for western OK, KS, TX dryland wheat producers.
Slow release N (SRN) comes in a range of forms: coated, long chain polymer, organic and many versions in each category. Again, water is the reason for the use of SRN sources. Slow release N whether coated or other have specific release patterns which are controlled by moisture, temperature and sometimes microbes. The release patterns of SRNS are not the same and may not work across crops and landscapes. For instance in Oklahoma the uptake pattern of nutrients for dryland corn in the North East is not that same as irrigated corn in the West. The little nuances in the growth pattern of a crop can make or break your SRN.
While N products have been on the market for decade’s phosphorus enhancers and stabilizers are relatively new, resulting in many of my peers holding back on providing recommendations until field trials could be conducted. At this point many of us do have a better understanding of what’s available and are able to provide our regional recommendations. Phosphorus products are not sold to prevent loss like their N counterparts; they are sold to make the applied P more available. On a scale of 1 to 10, P reactivity with other elements in the soil is a 9.9. If there is available Ca, Mg, Fe, or Al, phosphorus is reacting with it. In the southern Great Plains it is not uncommon for a soil to have 3,000-5,000 lbs of available Ca, a soil with a pH of 4, yes we have many of those, will have approximately 64,000 lbs of Al in the soil solution. That’s a lot of competition for your fertilizer P and for any substance that is trying to protect it.
I have been testing “biologicals” of all shapes and forms since 2003. While I have not hit any homeruns I have learned quite a bit. Many of these products originate from up north where the weather is kind and organic matter (OM) is high. Where I work the average OM is 0.75% and soil temp is brutal and unforgiving. Our soil does not have many reserves to release nor is it hospitable to foreign bodies.

Soil temperature for Stillwater OK under sod and bare soil conditions. Graph from http://www.Mesonet.org.
I hope you are still hanging on as this next topic is a bit of a soap box for me. Rate, Rate, Rate this aspect is missed both by producers and academia and it drives me crazy. If your crop is sufficient in any growth factor adding more will not increase yield. It goes back to Von Liebig’s LAW of the Minimum. I see too many research studies in which products are tested at optimum fertilization levels. This is just not a fair comparison. On the other hand, time and again I see producers sold on a product because they applied 30% less N or P and cut the same yield. If you let me hand pick 100 farms in Oklahoma I could reduce the N rate by 30% of the average and not lose a bushel on 75 of the farms. Why? Because the rate being used was above optimum in the first place, there is no magic just good agronomy. The list of products that increase the availability of nutrients is a mile long. Increasing nutrient availability is all well and good if you have a deficiency of one of those nutrients. If you don’t, well you have increased the availability of something you did not need in the first place.
University researchers and extension professionals seem to live and die by the statistics, and are told so regularly. We do rely upon the significant differences, LSD’s, and etc to help us understand the likely hood of a treatment causing an effect. However if I see a trend develop, or not develop, over time and landscape regardless of stats I will have no problem making recommendations. The stats help me when I do not have enough information (replications).
Too wrap up, have a goal. Do not just buy a product because of advertised promises or because a friend sells it. There is a right time and place for most of the things out there, but you need to know what that is and if it suits your needs. I also recommend turning to your local Extension office. We do our best to provide unbiased information in hopes of making your operation as sustainable as possible. If you are looking at making sizable investments do some reading, more than just Google. Testimonies are great but should but should not be enough to cut a check. Google Scholar www.google.com/scholar is a good resource for scientific pubs. I have done my best to put together a list of peer reviewed publications and their outcomes. To make the review work I had to be very general about outcome of the research. Either the product increased yield or decreased environmental losses or it had no impact. This was not easy as many of the papers summarize multiple studies. I did my best to make an unbiased recommendation but some could be argued. http://npk.okstate.edu/Trials/products/Product_Peer_Review.8-21-2014.pdf
2013 Wheat and Canola preplant soil test results
Every few years I request the results of all soil samples submitted to OSU Soil, Water, & Forage Analytical Labs (www.soiltesting.okstate.edu) under the crop codes of winter wheat and winter canola. Within this data set I can look at trends occurring across the state over time. In this report I will focus on the 2013 results but make some comparison with the 2011 sample values.
As it pertains to mobile nutrients such as N, S, and B there is little that can be applied from the previous year’s soil samples because their levels in the soil change rapidly. Samples must be collected every year to determine the current status. However the soil test levels of immobile nutrients, P, K, Mg, ect are relatively stable over time and the recommendation is to take a close look at these values every three to five years.
In 2013 the number of sample submitted increase. There were nearly 1000 more wheat soil samples (2733 to 3574) and 200 more canola soil samples (33 to 231). If the distribution of nutrient levels of the two years are compared the only significant change is that the soil test NO3 level was significantly lower in 2013 (Tables 1 and 2). This is attributed to the extremely dry 2012 spring and summer which delayed the breakdown of wheat straw and immobilization of residual N.

Table 1 and 2. Summary from all samples submitted to SWFAL under the wheat and canola crop codes in 2001 and 2013.
Reviewing the 2013 values the most concerning aspect is that 72% of the 3800+ soils samples had a Mehlich 3 P value below optimum soil test phosphorus (STP) of 65 (Figures 1 and 2). That adds up to 109,000 acres needing phosphorus, if you assume each sample represents 40 acres. There is no way to determine how much P2O5 if any was applied to these particular fields. However, an estimated impact of not fertilizing can be calculated. Based on the Oklahoma typical average yield of just below 40 bpa, it would cost the state approximately 575,000 bushels if the land went unfertilized. At $5.00 a bushel that is $2.8 million in revenue. To remedy the low STP it would take approximately 2.76 million lbs P2O5 at a cost of $1.5 million ($0.50 per lb).
In the NPKS response study wheat fields across the state were evaluated for a response to additional (in addition to producer’s standard practice) nitrogen, phosphorus, potassium, and sulfur. Phosphorus was the most limiting nutrient at 7 of the 59 harvest locations. A response to P occurred more often than any of the other nutrients tested. It is important to note at all seven fields had been fertilized with P that season, however each time it was below the OSU recommended rate. The response study was a great reminder that it is important to have a good soil test and to follow the recommendations.

Figures 1 and 2. 1)Range of soil test P levels (Mehlich 3) for all samples submitted to SWFAL in 2013 under the wheat and canola crop codes. 2) Range of Soil Test P level for all samples with STP<65.
Soil pH on the other hand showed a slight improvement from 2011. The percent of samples under 5.5 decreased by 4%, 25 to 21. Of the samples <5.5 the majority fall within the 5.0-5.5 category, which for winter wheat is still within the optimum growth window (Figures 3 and 4). These numbers are a good sign however two points should be made. There is a significant amount of winter wheat acres that is not sampled; much of this is likely to fall below 5.5 soil pH.
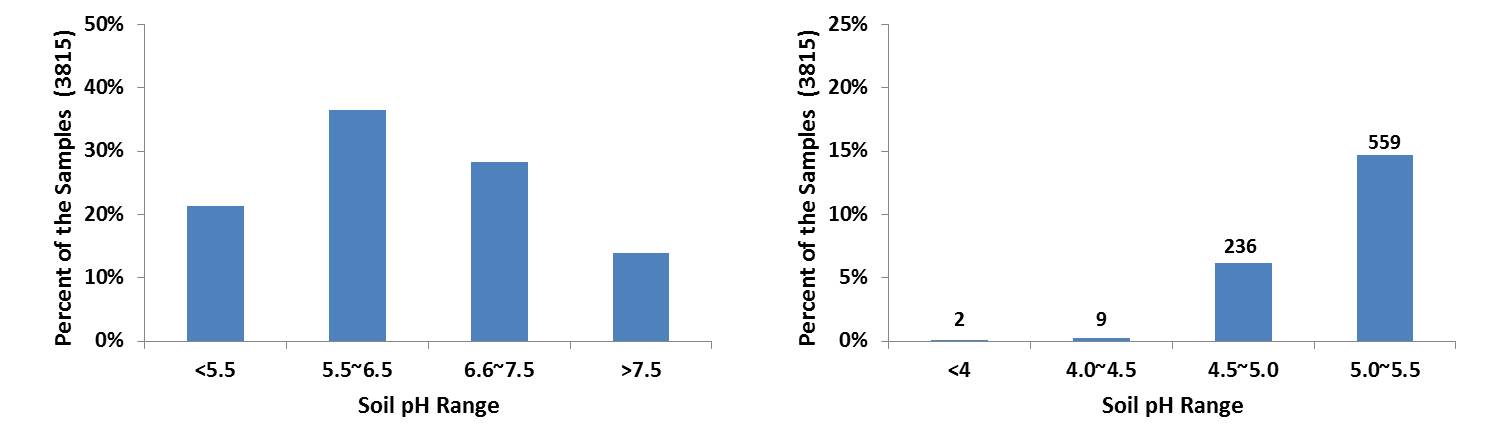
Figures 3 and 4. 1)Range of soil pH levels for all samples submitted to SWFAL in 2013 under the wheat and canola crop codes. 2) Range of soil pH levels for all samples with pH<5.5.
Additionally grid soil sampling and variable rate lime should consider on any field which the composite soil sample pH ranges from the high 4’s to the high 5’s. For example a 75 ac field near Deer Creek had a composite soil sample test pH of 5.3 and buffer index of 6.5. The OSU lime recommendation, for a wheat crop, was 2.2 ton per acre for a total of 166 tons to lime the entire field. However the producer grid soil sampled the field himself at a 2.5 acre resolution (31 samples). Figure 5, shows that the pH of the field ranged from 4.4 to 7.9. Only 33 tons of lime would be required if the field were limed using a variable rate technologies. Cutting the total amount applied by 133 tons would save the producer approximately $4000.
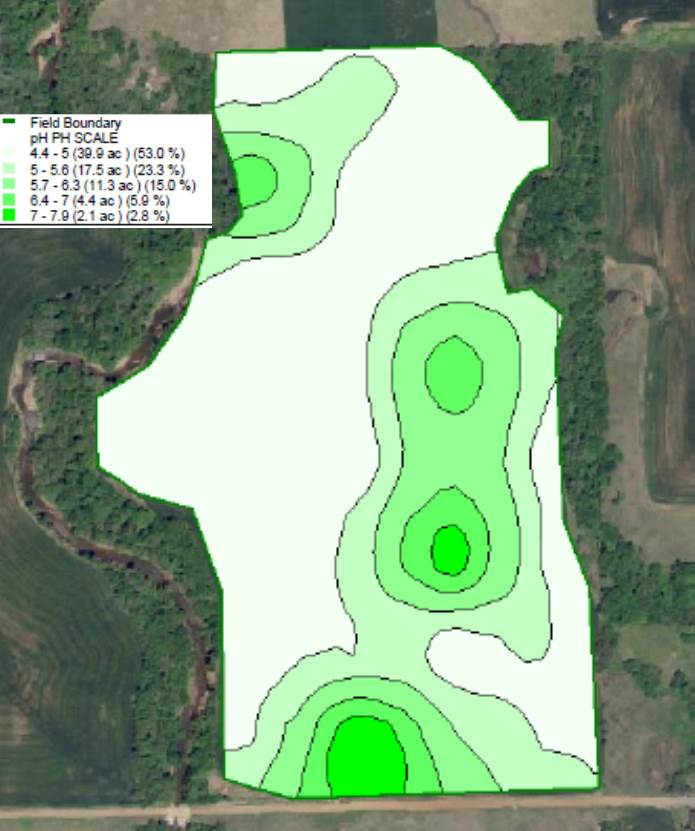
Figure 5. Soil pH results from a 75 acre field that was grid soil sampled at a 2.5 ac resolution.
Oklahoma wheat and canola producers must take advantage of the weather when it goes their way. Yet if the crop does not have the proper soil pH and nutrients under it, it will never reach its potential. Take the time to collect a soil sample and send it in to a lab. The hour it takes to collect the sample a few dollars you spend on analysis will help ensure that crop you are producing has the best chance of hitting maximum yield in the most economically and environmentally sound manner.
Related Factsheets
OSU Soil Test Interpretations
http://npk.okstate.edu/documentation/factsheets/PSS-2225web2013.pdf
Fertilization Based on Sufficiency, Build-up and Maintenance Concepts
http://npk.okstate.edu/documentation/factsheets/PSS-2266web.pdf
Banding P as a Band-Aid for low-pH soils.
In the mid-1970s Dr. Robert Westerman banded 18-46-0 with wheat at planting in a low-pH soil near Haskel Ok. The impact was immediately evident. Soon after Oklahoma State University recommended the “Banding of Phosphate in Wheat: A Temporary Alternative to Liming” Figure 1. This method was a Band-Aid solution for the significant amount Oklahoma winter wheat production area which was either too far from a reliable lime source or under a short term lease contract.

Figure 1. The cover of an extension brochure distributed in Oklahoma during the 1980s.
Still today grain producers throughout the United States commonly farm a large percentage of land that is not their own. In the leasing process agreements can widely vary both on length of the lease and the amount of inputs that the land owner will pay. The wheat belt of Oklahoma is known for having large areas with low soil pH levels. A survey of soil samples submitted to the Oklahoma State University Soil, Water, and Forage Analytical Laboratory in 2011 under the winter wheat crop code showed 38% of the samples having a soil pH level below 5.5 (Figure 2). In Oklahoma short term leases with limited shared expenses have limited the access to agricultural lime for remediation of acidic soils. In the dry environment it may take up to one year before the lime applied has completely corrected the soil acidity problem. In a situation where the lease agreement is only for one to two years there may be no economic benefit for the producer to apply lime especially in regions where winter wheat average yields range from 20 to 40 bushel per acre. The current recommendation for winter wheat producers working on low-pH short term lease ground is to apply 30 lbs P2O5 ac-1 ( 65 lbs 18-46-0 ac-1) with the seed for grain only wheat and 60 lbs P2O5 ac-1 (130 lbs 18-46-0 ac-1) for dual-purpose wheat production. This recommendation however is for soils with adequate soil test P, but low soil pH. When soil test P is below optimum the 30 or 60 units is applied in addition to the amount needed to reach 100% sufficiency.
Banding P is considered a “Band-Aid” as the problem of soil acidity is not re-mediated it is only masked. If not addressed the pH of the soil will continue to fall over time. Aluminum and manganese toxicity is the greatest issue associated with soil acidity. Available aluminum, a predominant mineral in the regions soils, is pH dependent. A change of 1.0 pH level changes available Al by 1000 fold. For example a soil with a pH of 5.0 will have an approximate Al concentration of 27 ppm, critical level of winter wheat is 27 ppm, while a soil with a pH of 4.0 will have an Al concentration of approximately 27,000 ppm. Aluminum and manganese toxicity does not only impact grain yield but it has an even greater impact on biomass production. Kariuki et al (2007) recorded the impact of soil acidity on eight current winter wheat lines. Correcting soil acidity increased wheat grain yield by 82% and increased forage production by 150%. For Oklahoma the forage produced by the wheat crop is as important as the grain. Oklahoma is unique in that approximately 50% of the four million acres of winter wheat are grazed annually much of this under the dual –purpose “Graze-N-Grain” management. To maintain productivity on the land without the long term investment of Ag lime producers have been applying phosphorus fertilizer to alleviate the impact of aluminum toxicity.

Figure 2. Summary of the soil pH values for the 614 samples submitted to the Oklahoma State University Soil, Water, Forage, Analytical Laboratory under wheat crop code during the time frame of 1-1-2011 11-30-2011.
In 1992 Boman et al reported that impact banding phosphates with seed on winter wheat forage production (Figure 3). Across the four locations the addition of P increase yield from 2 to 4 fold. The work by Kaitibie et al (2002) documented an additional aspect of banding P. In the variable and often arid climate of Oklahoma the activation of lime can take a significant amount of time, in upwards of one year. In comparison banding P has an immediate impact on the alleviation of metal toxicities. Figure 4 shows the incorporation of lime improved forage yield but not to the degree of banding P. For continuous winter wheat producers the time between application of lime and planting can be quite short. Typically the previous crop will be harvest in mid-June and in the best case scenario lime would be applied and incorporated by mid-July. At this point there is only 60 days until the next wheat crop is planted in early to mid-September.
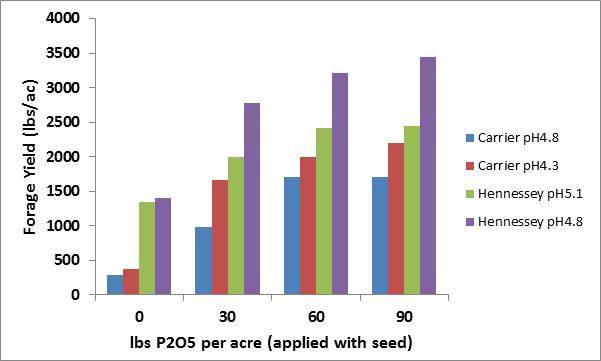
Figure 3. The impact of banding phosphate with seed at planting in acidic soils on winter wheat forage production in Oklahoma. Chart adapted from Boman et al. 1992.

Figure 4. The impact of applying of phosphate fertilizer and lime on the forage production of two winter wheat cultivars in Oklahoma. Chart adapted from Kaitibie et al. 2002.
For many with short term leases banding P is still the only viable solution for wheat production in low-pH soils. However there is ground being farmed by the owner or is under long-term lease that is still receiving this Band-Aid approach. At the 1980-1990 fertilizer and lime prices there is good reason to continue this method. However the cost of P fertilizer has quadrupled since the 1970’s. The last ten year average price of P2O5 was $0.42 per pound while it cost an average of $0.10 in the 70s. So for those who own or are able to work out beneficial lease agreements Table 1 should be of interest. By year three the cost of phosphate exceeds the cost of lime. If you were to use the values from the 1980’s of $0.20 per pound of P2O5 and $25 per ton ECCE lime it was not until year five, the last year before reapplying lime, did the cost of P exceed cost of lime.

Table 1. Cumulative cost per acre of applying phosphorus and lime to remediate aluminum and manganese toxicity based on a five year liming cycle. The 30 lb P2O5 rate is recommended for grain only production while dual-purpose wheat require 60 P2O5. Prices based on current quotes of DAP at $590 a ton ($0.41 lb P2O5) and Ag lime at $30 per ton ECCE.
As the 2014 winter wheat and canola crop is being transported to the bins it is extremely important to take advantage of this time to take soil samples from as many fields as possible. Soil pH issues must be understood and addressed. I often remind producers soil pH plays an exception number of roles. Not only does it impact yield as shown before but it impacts rooting (ability to survive stresses), nutrient availability, and herbicide activity. Our SU herbicides (Finesse, Powerflex, and Maverick) that are used widely across the state are negatively impacted by low soil pH. Figure 5 shows how at a pH of 5.6 Glean is down to a 50% concentration in the soil approximately two weeks after application. So when it comes time to make the call for phosphorus or lime try to weigh all of these aspects, at current prices P is not that much cheaper, improving pH will improve yield and potentially improve weed control.
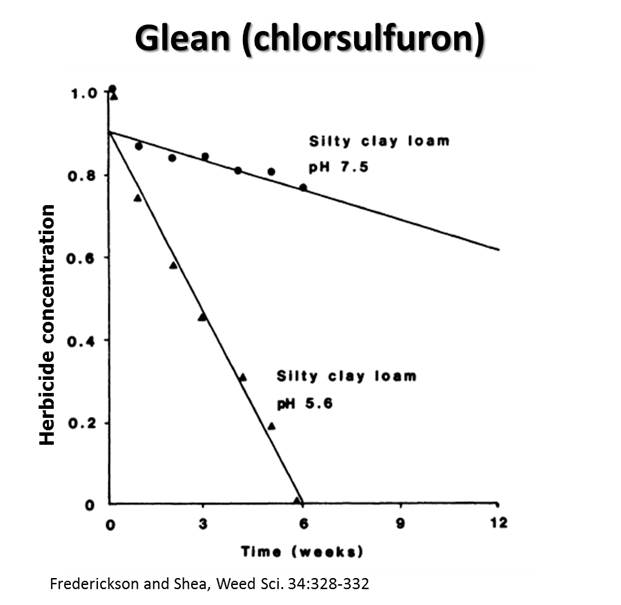
Figure 5. The concentration of Glean (Cholorsulfuron) remaining in too soils (pH 7.5 and pH 5.6) over a twelve week period.
Citations
Boman,R.K., R.L. Westerman, G.V. Johnson, and M.E. Jojola. 1992. Phosphorus fertilization effects on winter wheat production in acid soils. In Soil Fertility Highlights, Agronomy Department Oklahoma Agricultural Experiment Station, Oklahoma State University.Agronomy 92-1 pg171-174
Kaitibie,S., F. M. Epplin, E.G. Krenzer, and H. Zhang. 2002. Economics of lime and phosphorus application for dual-purpose wheat production in low-pH soils. Agron. J. 94:1139:1145.
Kariuki, S.K., H. Zhang, J.L. Schroder, J. Edwards, M. Payton, B.F. Carver, W.R. Raun, and E.G. Krenzer. 2007. Hard red winter wheat cultivar responses to a pH and aluminum concentration gradient. Agron J. 99:88-98.
Response to NPKS strips across Oklahoma
From the fall of 2011 to about a week ago one of my grad students, Lance Shepherd, has spent A LOT of time burning up the highways and back roads of Oklahoma. Lance’s project was titled “NPKS Strips in Oklahoma winter wheat”, basically an extension of the N-Rich Strip concept. We wanted to see if we could or would find a response to added nitrogen (N), phosphorus (P), potassium (K), or sulfur (S) fertilizer on top of the farmer’s fertilizer applications. Over the two crop years lance applied NPKS strip on more than 80 fields from the Kansas border to the Red River. Of those 80+ Lance was able to collect, by hand, grain samples from 59 sites. Over the next few weeks I will be sharing some of the juicy tidbits we are gleaming from this fantastic data set.

NPKS applicator. Gandy boxes hold each fertilizer and a pto driven fan blew the fertilizer down the boom.
For the project at every site Lance collected soil samples to 18”, documented soil type and collected producer fertilizer, variety, and field history information. Over the 59 locations there were essentially 236 trials. The yield of each strip (N,P,K, and S) was compared back to a sample collected from the field, referred to as Farmer Practice. Of the 236 comparisons there were a total of 17 positive responses. Of these 17 responses seven were to N, seven to P, three to K, with no responses to S.

N-Rich strip very evident in field west of Alva. N-Rich 70 bu/ac Farmer Practice 38 bu/ac.
We are learning a great deal from these 17 locations. The biggest take home was that in most instances soil test results identified the yield limiting factors. For example of the seven responsive P locations six had either a low soil pH or low soil P index, some both. At only one site was there a response not predicted by soil test. Of all 59 harvested fields more than just six had low P or pH levels however most producers had applied enough fertilizer to reach maximum yield. For nitrogen two items proved to be the most likely reason for loss of yield, under estimated yield goal or environment conducive to N loss. As for the K responses we look at both K and chloride (Cl) as KCl, 0-0-62 potash, was applied in the K strip. Just looking at the soils data K was not low at any of the three sites. However, two sites are in sandy loam soils, which is conducive to Cl deficiencies. The lack of response to S was not surprising as soil tests indicated S was sufficient at all 80 locations were strips were applied. So again what did we learn from these plots, soil testing is key in maximizing yield and profitability and in most of the N responsive sites the N-Rich strip indicated a need for added fertilizer in February.
