Home » Posts tagged 'lime'
Tag Archives: lime

Laboratory evaluation of Liquid Calcium
Liquid calcium products have been around for a long time. The vast majority of these products are either a calcium chloride or chelated calcium base which is now commonly found with the addition of a humic acid, microbial, or micronutrient. Many of these make promises such as “raises your soil pH with natural, regenerative, liquid calcium fertilizers that correct soil pH quickly, efficiently, and affordably!”. From a soil chemistry aspect the promise of adding 3 to 5 gallons of a Ca solution, which is approximately 10% Ca, will raise the soil pH is impossible on a mass balance approach. In this I mean that to increase the pH of an acid soil {soil pH is the ratio of hydrogen (H) and hydroxide (OH) in the soil, and having an acid soil means the concentration of H is greater than that of OH} requires a significant portion of the H+ that is in solution and on soil particle to be converted to OH, or removed from the system entirely.
The blog below walks through the full chemical process of liming a soil but in essence to reduce the H+ concentration we add a cation (positively charged ion) such as Ca or magnesium (Mg) which will kick the H+ of the soil particle and a oxygen (O) donator such as CO2 with ag lime or (OH)2 which is in hydrated lime. Each of these O’s will react with two H’s to make water. And with that the pH increases.
However regardless of the chemistry, there is always a lot of discussion around the use of liquid calcium Therefore we decided to dig into the question with both field and laboratory testing. This blog will walk through the lab portion.
This was a laboratory incubation study. The objective was to evaluation the impact of the liquid Ca product (LiqCa**) on the soil pH, buffer capacity, Ca content and CEC of two acidic soils. LiqCa was applied at three rates to 500 g of soil. The three rates were equivalent to 2, 4, and 6 gallon per acre applied on a 6” acre furrow slice of soil. One none treated check and two comparative products were also applied. HydrateLime (CaO) as applied at rate of Ca equivalent to the amount of Ca applied via LiqCa, which was approximately 1.19 pounds of Ca per acre. Also AgLime (CaCO3) was applied at rates equivalent to 1, 2, and 4 ton effective calcium carbonate equivalency (ECCE). The Ag lime used in the study had a measured ECCE of 92%. The two soils selected for both acidic but had differing soil textures and buffering capacities. The first LCB, had an initial soil pH (1:1 H2O) of 5.3 and a texture of silty clay loam and Perkins had a initial pH of 5.8 and is a sandy loam texture. Both soils had been previously collected, dried, ground, and homogenized. In total 10 treatments were tested across two soils with four replications per treatment and soil.
Project protocol, which has been used to determined site specific liming and acidification rates, was to apply the treatments to 500 grams of soil. Then for a period of eight weeks this soil wetted and mixed to a point of 50% field capacity once a week then allowed to airdry and be mixed again. At the initiation and every two weeks after soil pH was recorded from each treatment. The expectation is that soil pH levels will change as the liming products are impacting the system and at some point, the pH reaches equilibrium and no longer changes. In this soil that point was week six however the trail was continued to week eight for confirmation. See Figures 1 and 2.
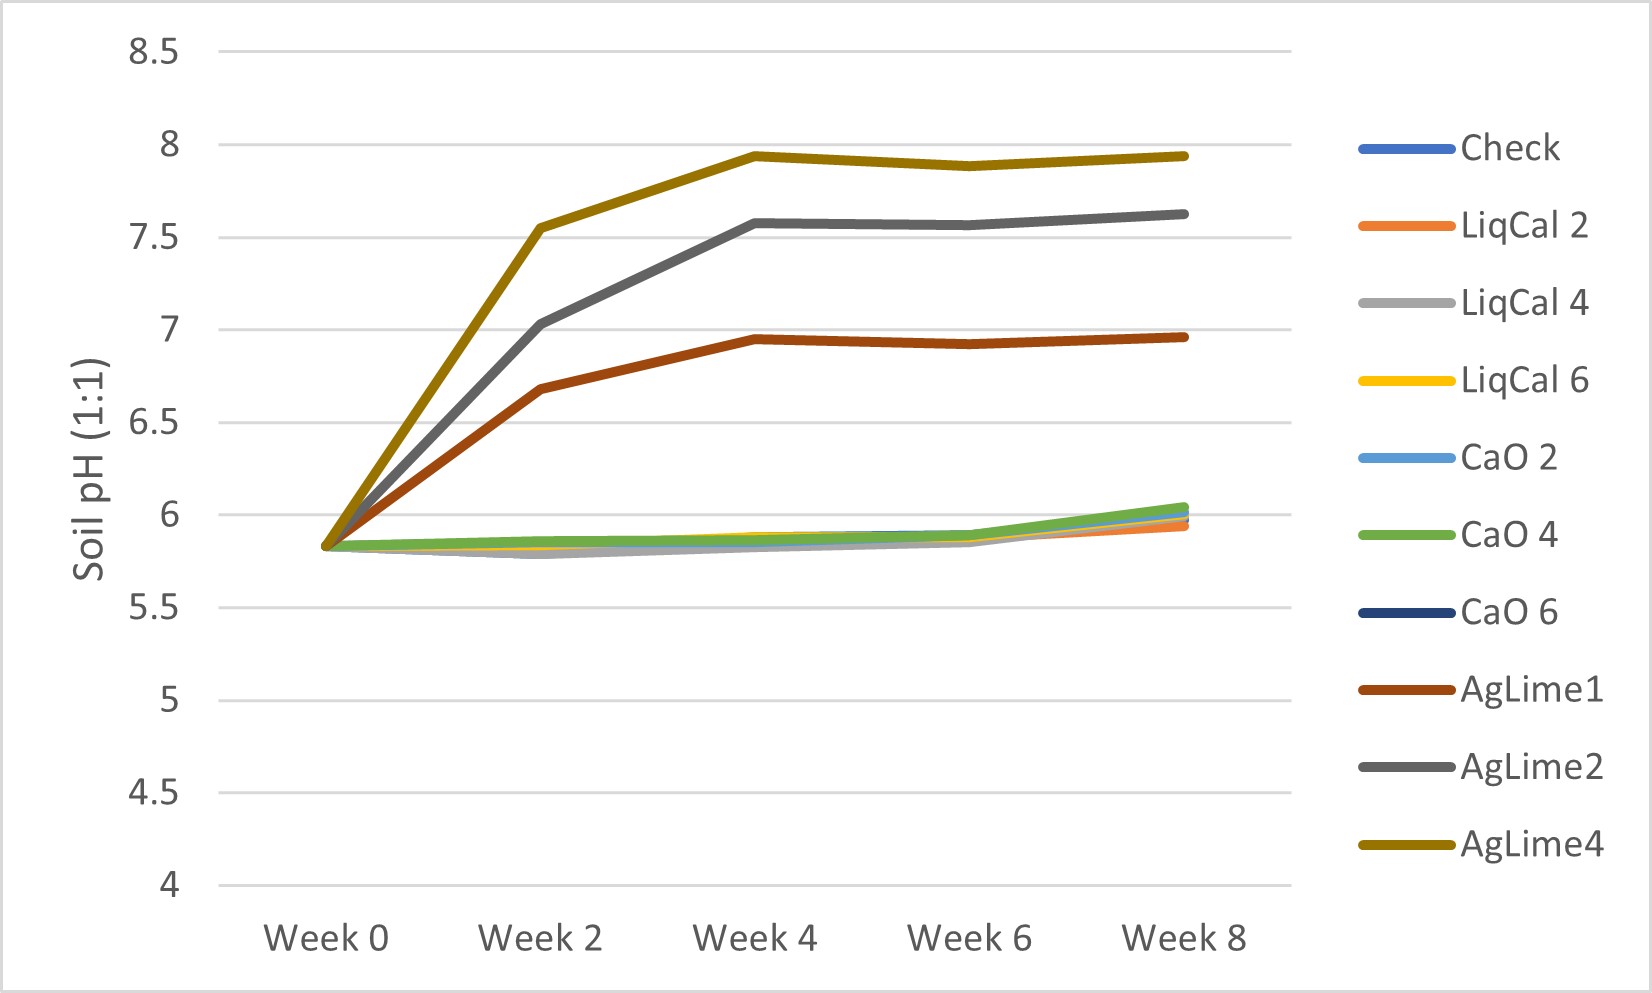
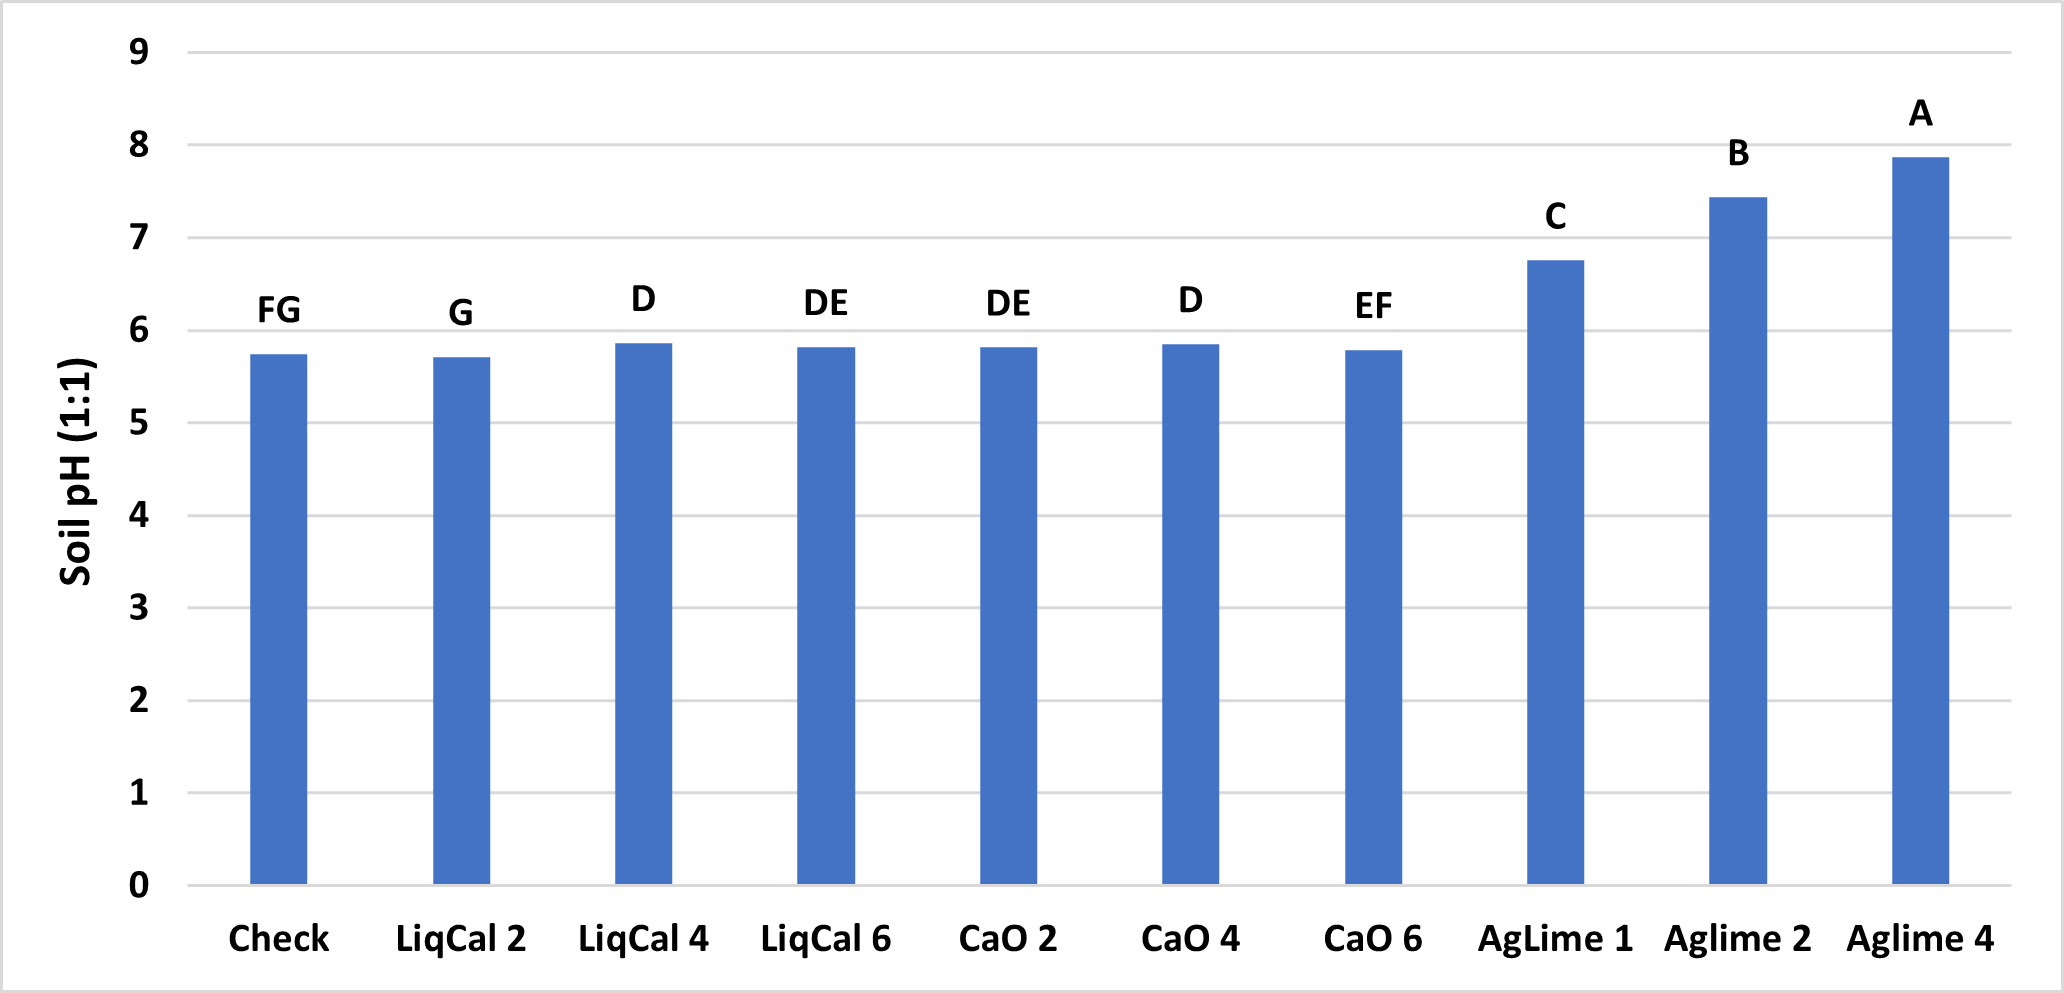
ANOVA Main effect analysis showed that Soil was not a significant effect so therefore both soils were combined for further analysis. Figure 3 shows the final soil pH of the treatments with letters above bars representing significance between treatments. In this study all treatments were significantly greater than the check with exception of LiqCal 2 and CaO 6. Neither LiqCal or CaO treatments reached the pH level of Aglime, regardless of rate.


Summary
The incubation study showed that application of LiqCal at a rate of 4 and 6 gallons per acre did significantly increase the soil pH by 0.1 pH units and 6 gallons per acre increased the Buffer index above the check by 0.03 units. Showing the application of LiqCal did impact the soil. However the application of 1 ton of Ag lime resulted in significantly great increase in soil pH, 1.0 units by 8 weeks and a buffer index change of 0.2 units. The Aglime 1 was statistically greatly than all LiqCal treatments. Ag lime 2 and 4 were both statistically greater than Ag lime 1 with increasing N rate with increasing lime rate. Given the active ingredient listed in LiqCal is CaCl, this result is not unexpected. Ag lime changes pH by the function of CO3 reacting H+ in large quantities. In a unsupported effort a titration was performed on LiqCal, which show the solution was buffered against pH change. However it was estimated that a application of approximately 500 gallons per acre would be needed to sufficiently change the soil pH within a 0-6” zone of soil.
Results of the field study.
https://osunpk.com/2025/06/02/field-evaluation-of-lime-and-calcium-sources-impact-on-acidity/
Take Home
The application of a liquid calcium will add both calcium and chloride which are plant essential nutrients and can be deficient. In a soil or environment suffering from Cl deficiency specifically I would expect an agronomic response. However this study suggest there is no benefit to soil acidity or CEC with the application rates utilized (2, 4, and 6 gallon per acre).
** LiqCal The product evaluated was derived from calcium chloride. It should be noted that since the completion of the study this specific product used has changed its formulation to a calcium chelate. This change however would not be expected to change the results as the experiment did include a equivalent calcium rate of calcium oxide.
Other articles of Interest
https://extension.psu.edu/beware-of-liquid-calcium-products
https://foragefax.tamu.edu/liquid-calcium-a-substitute-for-what/
Any questions or comments feel free to contact me. b.arnall@okstate.edu
Field evaluation of lime and calcium sources impact on Acidity.
At the same time we initiated a lab study looking at the application of LiqCal https://osunpk.com/?p=2096 , we also initiated a field trial to look at the multi-year application of LiqCal, Pelletized Lime and Ag-Lime.
A field study was implemented on a bermudagrass hay meadow near Stillwater in the summer of 2019. The study looked to evaluate the impact of multiple liming / calcium sources impact on forage yield and soil properties. This report will focus on the impact of treatments on soil properties while a later report will discuss the forage results.
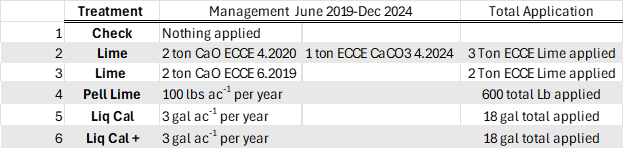
Table 1. has the management of the six treatments we evaluated, all plots had 30 gallons of 28-0-0 streamed on each spring in May. Treatment 1 was the un-treated check. Treatment 2, was meant to be a 2 ton ECCE (Effective Calcium Carbonate Equivalency) Ag Lime application when we first implemented the plots in 2019, but we could not source any in time so we applied 2.0 ton ECCE hydrated lime (CaO) the next spring. The spring 2023 soil samples showed the pH to have fallen below 5.8 so and Ag lime was sourced from a local quarry and 1.0 ton ECCE was applied May 2024. Treatment 3, was meant to complement Treatment 2 as an additional lime source of hydrated lime, it was applied June 2019. My project has used hydrated lime as a source for many years as it is fast acting and works great for research. Treatment 4 had 100 lbs. of pelletized lime applied each spring. The 100 lbs. rate was based upon recommendation from a local group that sells Pell lime. Treatments 5 and 6 were two liquid calcium products *Liq Cal * and **Lig Cal+ from the same company. The difference based upon information shared by the company was the addition of humic acid in the Liq Cal+ product. Both LiqCal and LiqCal+ where applied at a rate of 3 gallons per acre per year, with 17 gallons per acre of water as a carrier. Table 1, also shows total application over the six years of the study.
After six years of applications and harvest it was decided to terminate the study. The forage results were intriguing however little differences where seen in total harvest over the six years, highlighting a scenario I have encountered in the past on older stands of bermuda. That data will be shared in a separate blog.
The soils data however showed exceptionally consistent results.
In February of 2025 soil samples were collected from each plot at depths of 0-3 inch’s and 0-6 inches (Table 2.). It was our interest to see if the soil was being impacted below the zone we would expect lime and calcium to move without tillage, which if 0-3″. Figure 1. below shows the soil pH of the treatments at each depth. In the surface (blue) the Ag Lime and Hydrated lime treatments both significantly increased from 4.78 to 6.13 and 5.7 respectively. While the Pel lime, LiqCal and LiqCal+ had statistically similar pH’s as the check at 4.8, 4.65, and 4.65. It is important to note that the Ag Lime applied in May of 2024 resulted in a significant increase in pH from the 2019 application of Treatment 3. The Spring of 2024 soil samples showed that the two treatments ( 2 and 3 ) were equivalent. So within one year of application the Ag lime significantly raised soil pH.
As expected the impact on the 3-6″ soil pH was less than the surface. However, the Ag Lime and Hydrated lime treatments significantly increased the pH by approximately 0.50 pH units. This is important data as the majority of the literature suggestion limited impact of lime on the soil below the 3″ depth.

The buffer pH of a soil is used to determine the amount of lime needed to change the soils pH. In Figure 2. while numeric differences can be seen, no treatment statistically impacted the buffer pH at any soil depth.

The soil calcium level was also measured. As with 0-3″ pH and Buffer pH the Ag Lime and Hydrated lime had the greatest change from the check. These treatments were not statistically greater than the Pell Lime but where higher than the LiqCal and LiqCal+.
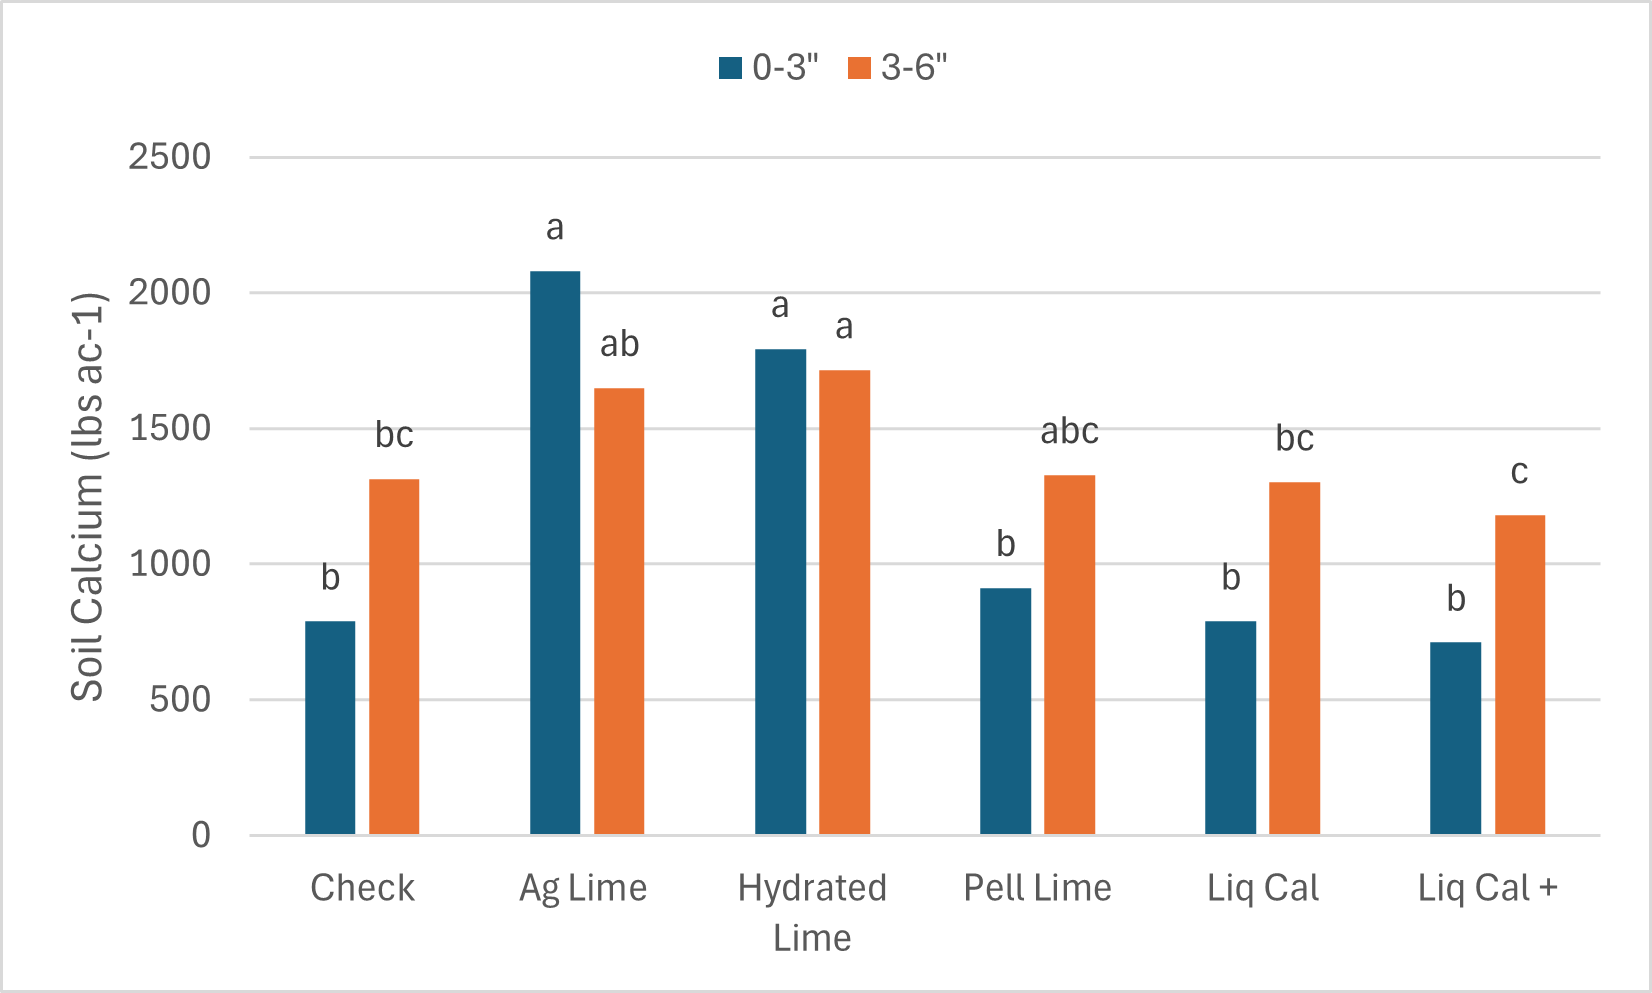

Each value is the average of four replicates.
Take Homes
In terms of changing the soils pH or calcium concentration, as explained in the blog https://osunpk.com/2023/01/24/mechanics-of-soil-fertility-the-hows-and-whys-of-the-things/, it takes a significant addition of cations and oxygens to have an impact. This data shows that after six years of continued application of pelletized lime and two liquid calcium products the soil pH did not change. While the application of 2 ton ECCE hydrate lime did.
Also within one year of application Ag lime the soil pH significantly increased.
* LiqCal The product evaluated was derived from calcium chloride. It should be noted that since the completion of the study this specific product used has changed its formulation to a calcium chelate. This change however would not be expected to change the results as the experiment did include a equivalent calcium rate of calcium oxide.
** LiqCal+ The product evaluated was derived from calcium chloride. It should be noted that since the completion of the study this specific product used has changed its formulation. The base was changed from calcium chloride to a calcium chelate. Neither existing label showed Humic Acid as a additive, however the new label has a a list of nutrients at or below 0.02% (Mg, Zn, S, Mn, Cu, B, Fe) and Na at .032% and is advertised as having microbial enhancements.
Any questions or comments feel free to contact me. b.arnall@okstate.edu
2013 Wheat and Canola preplant soil test results
Every few years I request the results of all soil samples submitted to OSU Soil, Water, & Forage Analytical Labs (www.soiltesting.okstate.edu) under the crop codes of winter wheat and winter canola. Within this data set I can look at trends occurring across the state over time. In this report I will focus on the 2013 results but make some comparison with the 2011 sample values.
As it pertains to mobile nutrients such as N, S, and B there is little that can be applied from the previous year’s soil samples because their levels in the soil change rapidly. Samples must be collected every year to determine the current status. However the soil test levels of immobile nutrients, P, K, Mg, ect are relatively stable over time and the recommendation is to take a close look at these values every three to five years.
In 2013 the number of sample submitted increase. There were nearly 1000 more wheat soil samples (2733 to 3574) and 200 more canola soil samples (33 to 231). If the distribution of nutrient levels of the two years are compared the only significant change is that the soil test NO3 level was significantly lower in 2013 (Tables 1 and 2). This is attributed to the extremely dry 2012 spring and summer which delayed the breakdown of wheat straw and immobilization of residual N.

Table 1 and 2. Summary from all samples submitted to SWFAL under the wheat and canola crop codes in 2001 and 2013.
Reviewing the 2013 values the most concerning aspect is that 72% of the 3800+ soils samples had a Mehlich 3 P value below optimum soil test phosphorus (STP) of 65 (Figures 1 and 2). That adds up to 109,000 acres needing phosphorus, if you assume each sample represents 40 acres. There is no way to determine how much P2O5 if any was applied to these particular fields. However, an estimated impact of not fertilizing can be calculated. Based on the Oklahoma typical average yield of just below 40 bpa, it would cost the state approximately 575,000 bushels if the land went unfertilized. At $5.00 a bushel that is $2.8 million in revenue. To remedy the low STP it would take approximately 2.76 million lbs P2O5 at a cost of $1.5 million ($0.50 per lb).
In the NPKS response study wheat fields across the state were evaluated for a response to additional (in addition to producer’s standard practice) nitrogen, phosphorus, potassium, and sulfur. Phosphorus was the most limiting nutrient at 7 of the 59 harvest locations. A response to P occurred more often than any of the other nutrients tested. It is important to note at all seven fields had been fertilized with P that season, however each time it was below the OSU recommended rate. The response study was a great reminder that it is important to have a good soil test and to follow the recommendations.

Figures 1 and 2. 1)Range of soil test P levels (Mehlich 3) for all samples submitted to SWFAL in 2013 under the wheat and canola crop codes. 2) Range of Soil Test P level for all samples with STP<65.
Soil pH on the other hand showed a slight improvement from 2011. The percent of samples under 5.5 decreased by 4%, 25 to 21. Of the samples <5.5 the majority fall within the 5.0-5.5 category, which for winter wheat is still within the optimum growth window (Figures 3 and 4). These numbers are a good sign however two points should be made. There is a significant amount of winter wheat acres that is not sampled; much of this is likely to fall below 5.5 soil pH.
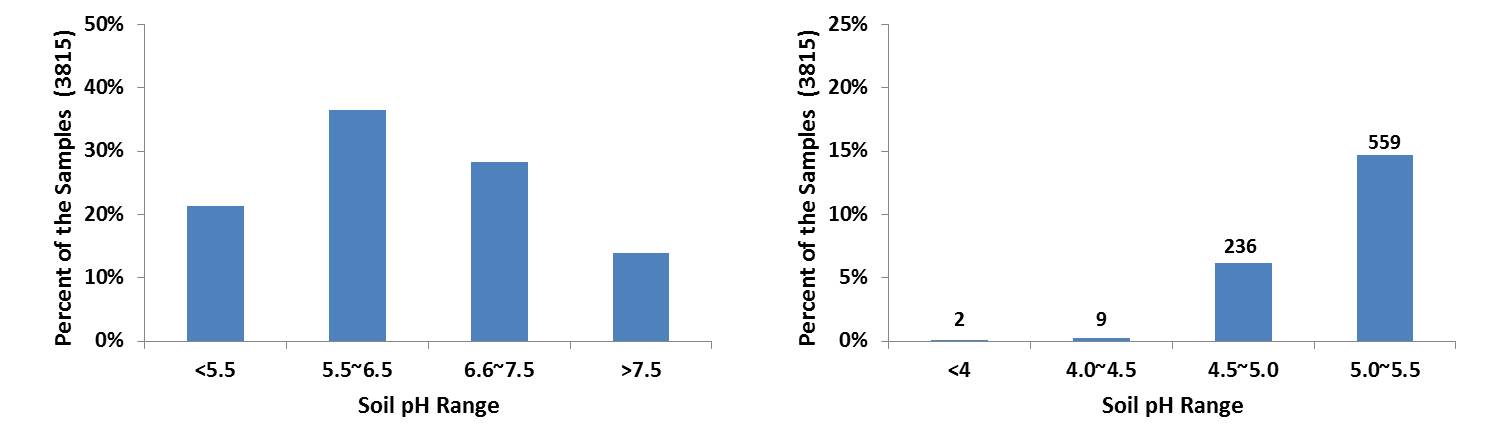
Figures 3 and 4. 1)Range of soil pH levels for all samples submitted to SWFAL in 2013 under the wheat and canola crop codes. 2) Range of soil pH levels for all samples with pH<5.5.
Additionally grid soil sampling and variable rate lime should consider on any field which the composite soil sample pH ranges from the high 4’s to the high 5’s. For example a 75 ac field near Deer Creek had a composite soil sample test pH of 5.3 and buffer index of 6.5. The OSU lime recommendation, for a wheat crop, was 2.2 ton per acre for a total of 166 tons to lime the entire field. However the producer grid soil sampled the field himself at a 2.5 acre resolution (31 samples). Figure 5, shows that the pH of the field ranged from 4.4 to 7.9. Only 33 tons of lime would be required if the field were limed using a variable rate technologies. Cutting the total amount applied by 133 tons would save the producer approximately $4000.
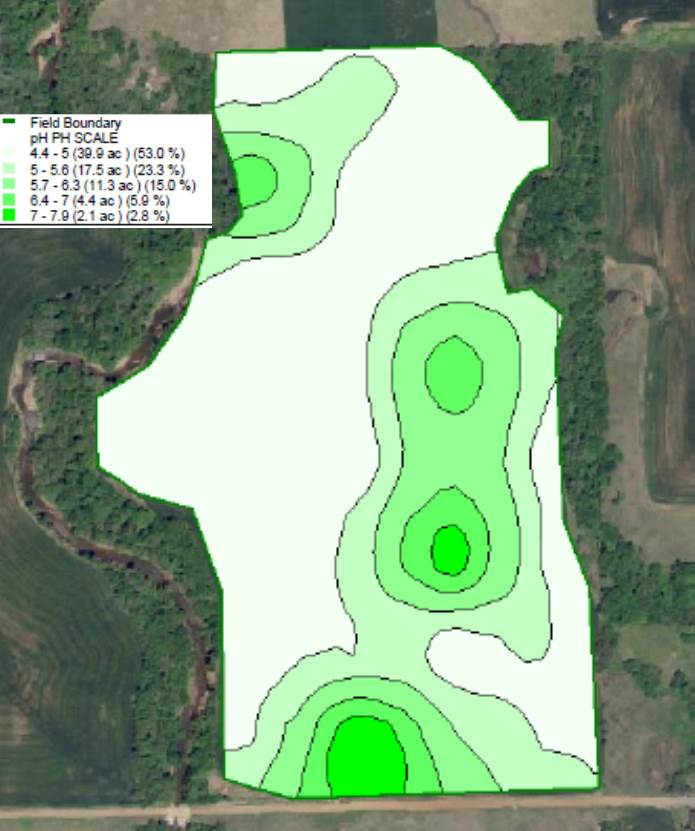
Figure 5. Soil pH results from a 75 acre field that was grid soil sampled at a 2.5 ac resolution.
Oklahoma wheat and canola producers must take advantage of the weather when it goes their way. Yet if the crop does not have the proper soil pH and nutrients under it, it will never reach its potential. Take the time to collect a soil sample and send it in to a lab. The hour it takes to collect the sample a few dollars you spend on analysis will help ensure that crop you are producing has the best chance of hitting maximum yield in the most economically and environmentally sound manner.
Related Factsheets
OSU Soil Test Interpretations
http://npk.okstate.edu/documentation/factsheets/PSS-2225web2013.pdf
Fertilization Based on Sufficiency, Build-up and Maintenance Concepts
http://npk.okstate.edu/documentation/factsheets/PSS-2266web.pdf
