Home » Posts tagged 'Corn'
Tag Archives: Corn

Corn Leafhopper Detected in Southwest Oklahoma – What Growers Need to Know to Reduce Risk of Corn Stunt Disease
Maíra R. Duffeck: OSU Field Crops Extension Pathologist, Department of Entomology and Plant Pathology
Ashleigh Faris, OSU Field Crops Extension Entomologist, Department of Entomology and Plant Pathology
On June 5, 2026, the first corn leafhoppers of the year were detected in a corn field near Fort Cobb in Caddo County, Oklahoma. The insects were collected from grain corn by Dr. Maira Duffeck’s Row Crop Pathology team, and its identification was subsequently confirmed by Dr. Ashleigh Faris, OSU State Extension Entomologist for Cropping Systems.
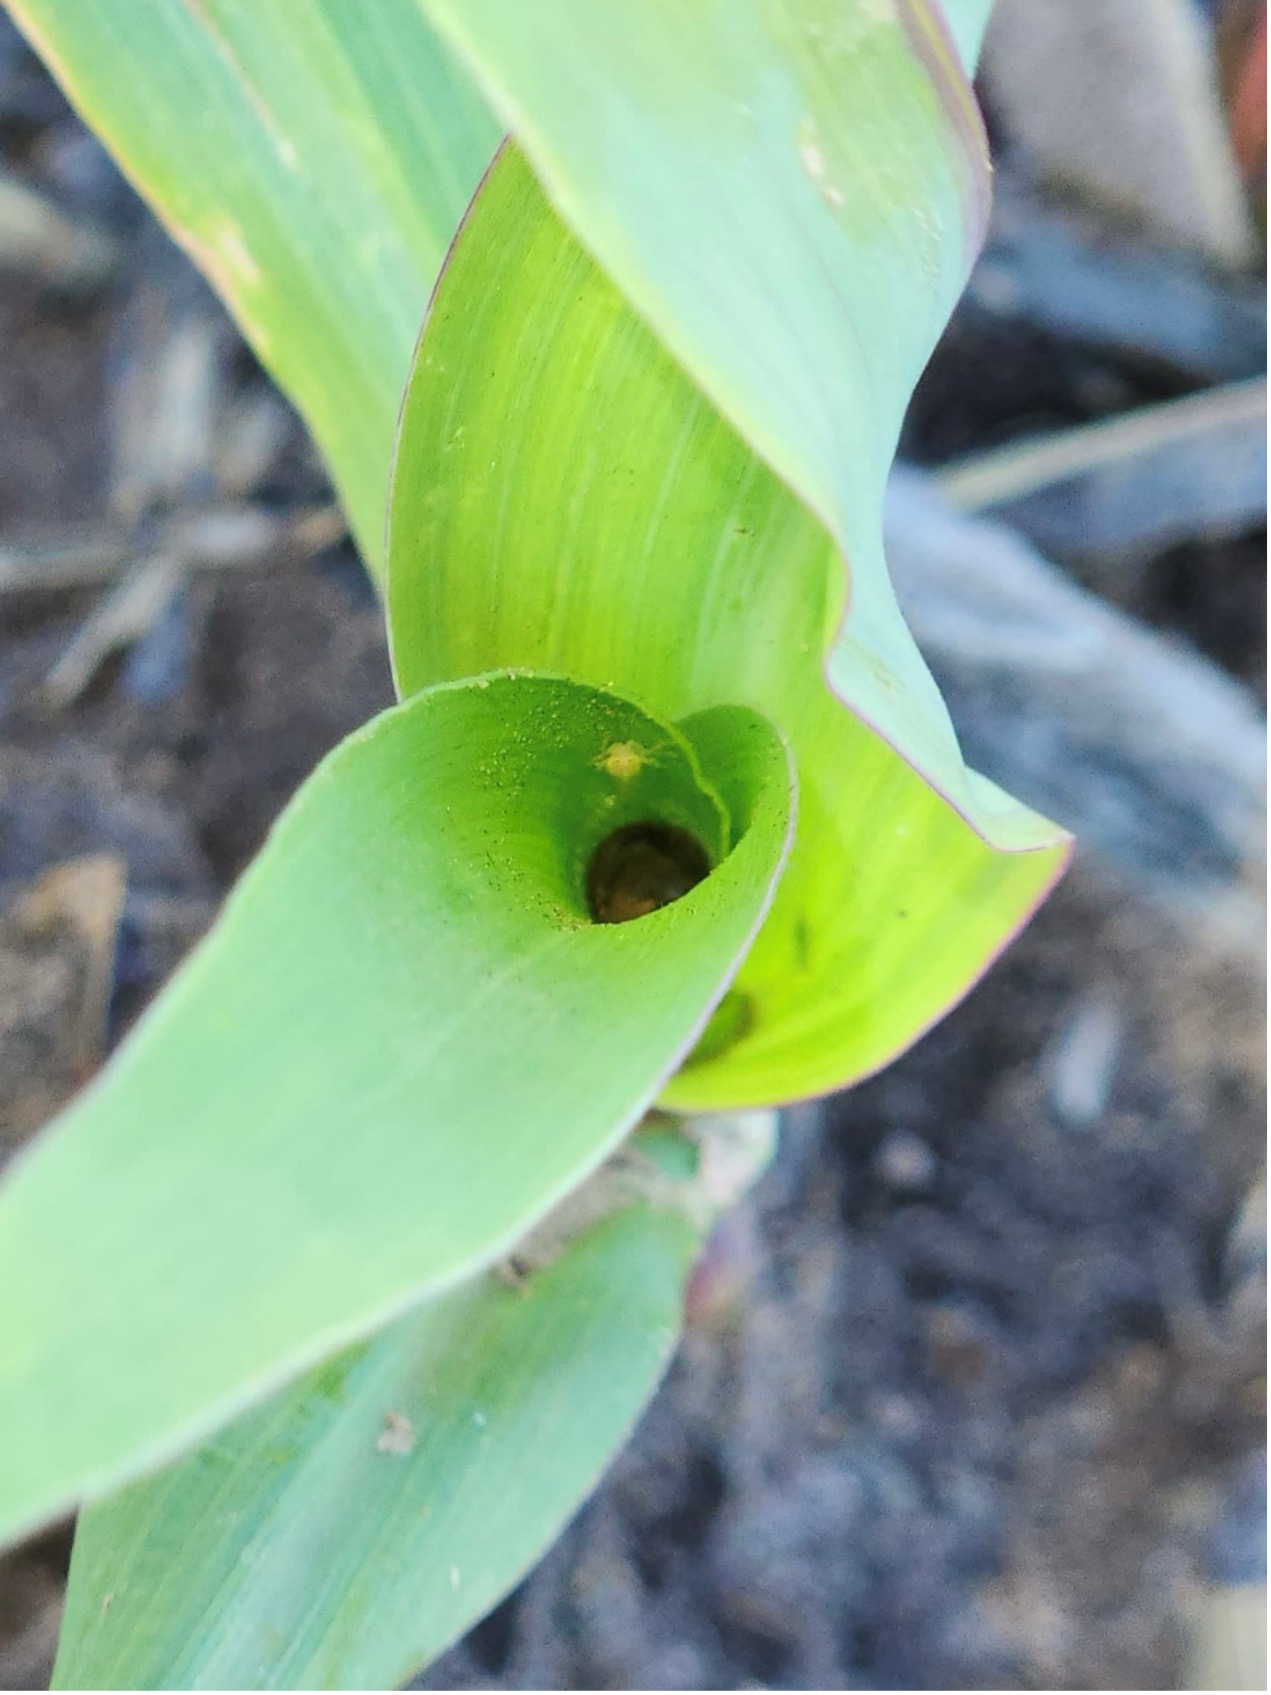
The two corn leafhoppers specimens were collected from within the whorls of V6-stage corn plants during routine field scouting. Specimens were collected using a cordless vacuum for identification and documentation. In addition, one corn leafhopper was captured on a yellow sticky trap installed at the edge of the field. The trap has been monitored and replaced weekly since planting as part of ongoing surveillance efforts.
This 2026 detection occurred 18 days earlier than the first corn leafhopper detection reported in Oklahoma during 2025. Due to delayed planting associated with drought conditions, much of the corn across the state is currently at vegetative growth stages compared to this same time last year. This situation raises concerns about the potential transmission of corn stunt pathogens by corn leafhoppers.
Research outside of the U.S. has shown that corn plants are most susceptible to infection by corn stunt pathogens during the vegetative growth stages, from emergence (VE) through tasseling (VT). However, infection can also occur during the early reproductive stages. Early infection can result in significant yield losses because affected plants have a longer period to develop symptoms and experience reductions in growth and grain production.
It is not yet known if the corn leafhoppers detected in Oklahoma are carrying corn stunt pathogens, therefore growers should assume that any corn leafhopper has the potential to be infectious. Consequently, management efforts should focus on early detection and suppression of corn leafhopper populations, particularly in fields with corn at vulnerable vegetative growth stages. Regular scouting and timely management decisions will be critical for reducing the risk of corn stunt development during the 2026 growing season.
The Insect Identification
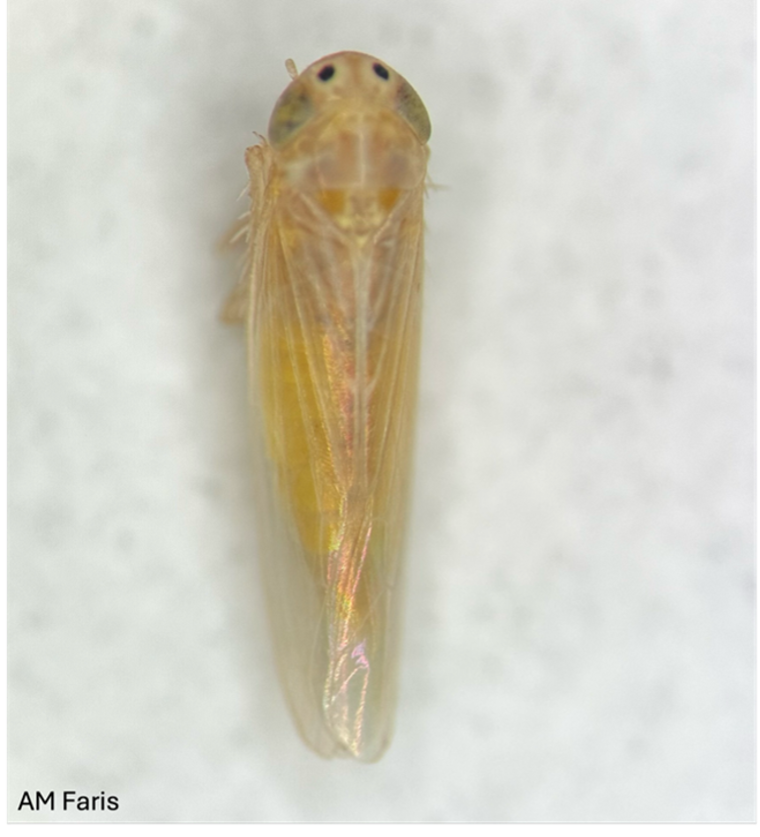
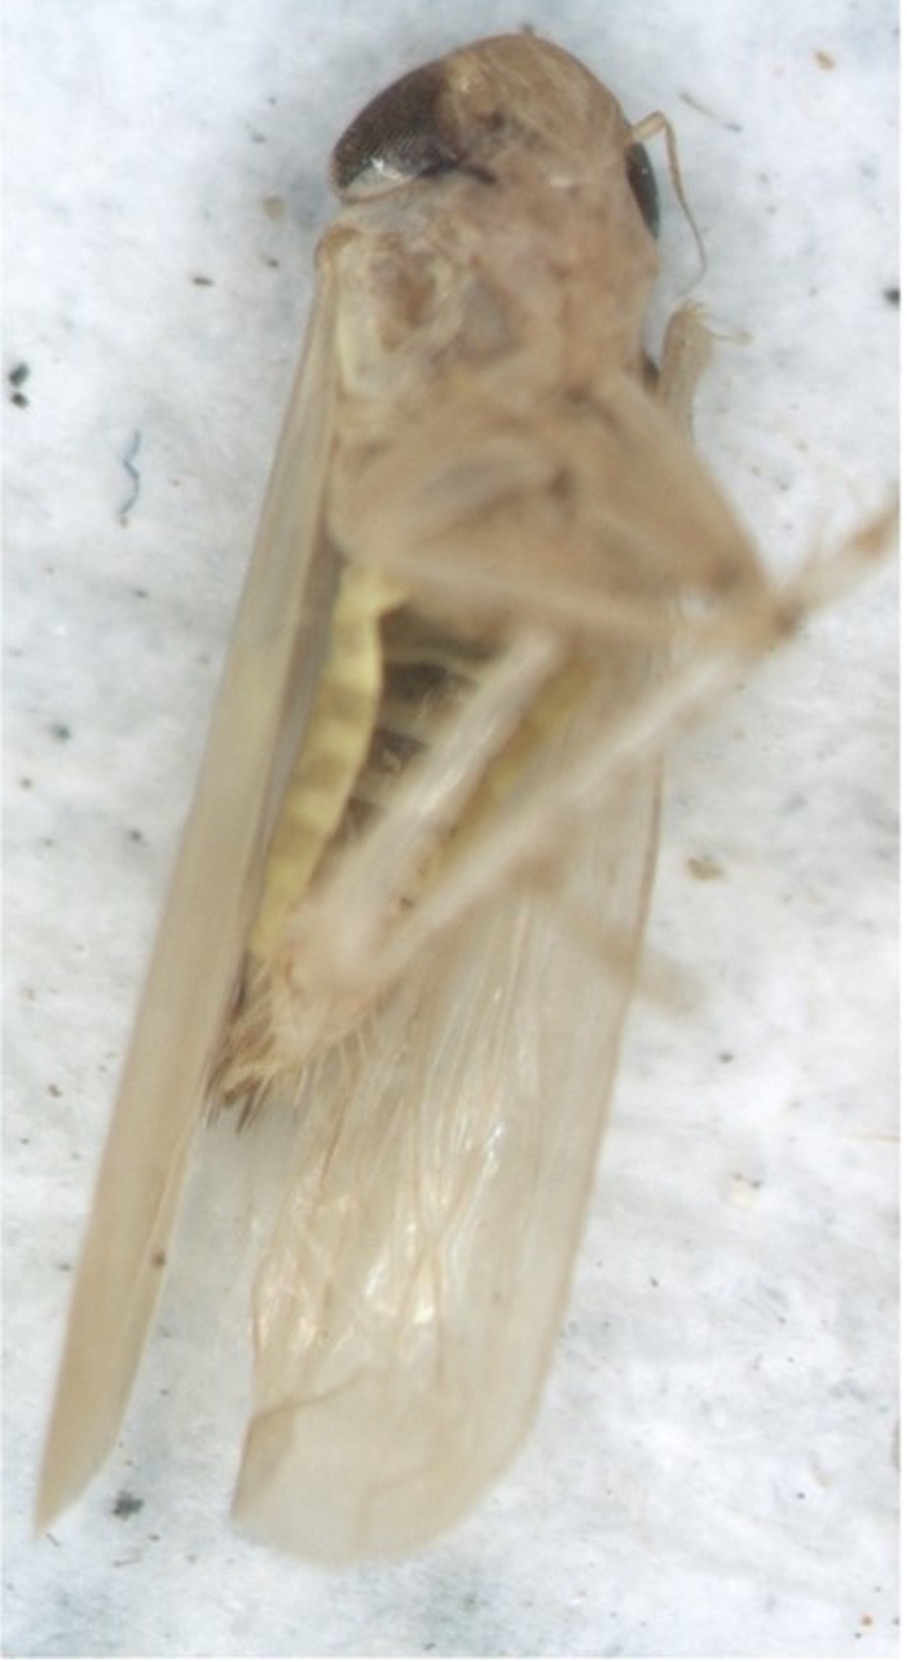
The corn leafhopper is a small insect, approximately 1/8 inch long (about the size of a grain of rice), with a yellow to tan body color. Adults are characterized by two small black spots surrounded by lighter-colored halos located between the eyes (Figure 1), as well as a clean face meaning there are no additional markings on the head or body. It is important to note that many leafhopper species also possess two spots between their eyes, however, these other leafhoppers will also have other dark marks on their head and/or face.
To distinguish corn leafhoppers from other leafhopper species, look for the combination of the two black spots with halos and the absence of additional markings. Corn leafhoppers do not have spots, stripes, or other markings on their wings, back, abdomen, face, or the top of the head (Figure 2). For mor information on how to distinguish the corn leafhopper from other commonly occurring leafhoppers see OSU e-Pest Alert EPP-25-24.
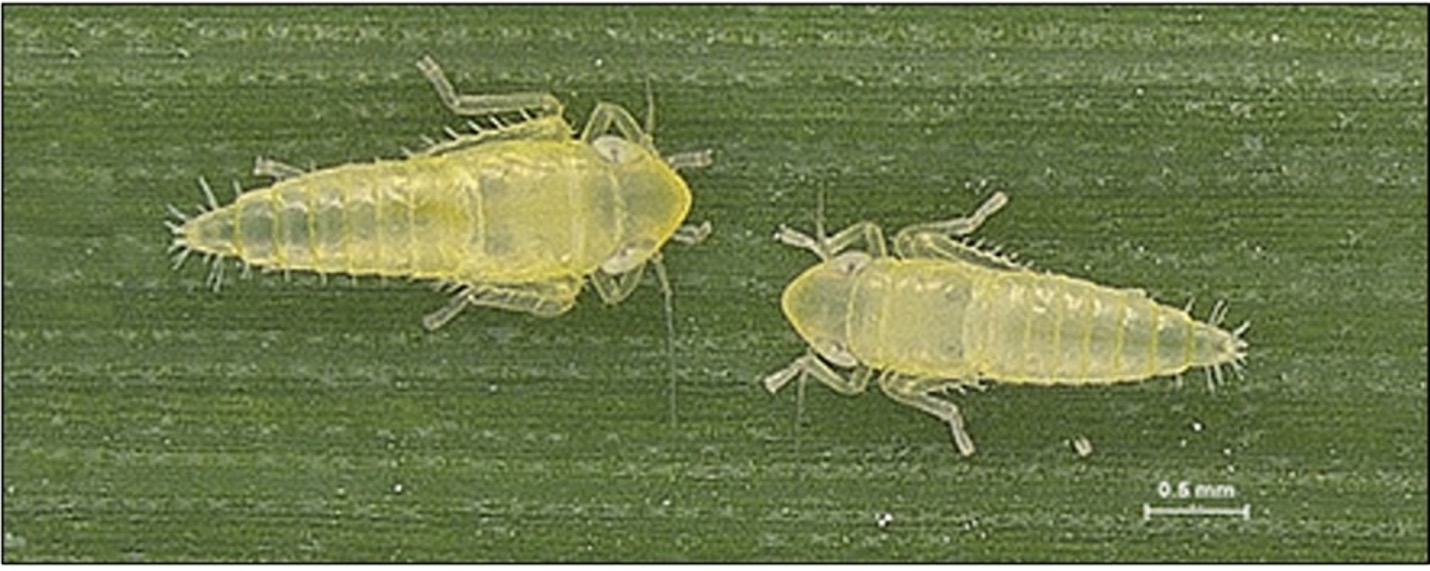
The immature or nymphal stage is wingless and resembles a smaller version of the adult. Nymphs may also lack the characteristic black spots and halos found on adults (Figure 3), making identification more challenging.
For additional information on corn leafhopper identification, biology, life cycle, and its role in transmitting corn stunt pathogens, see OSU E-Pest Alert EPP-23-17 and OSU e-Pest Alert EPP-25-29.
Scouting Tips and Guidance
Corn leafhoppers can be difficult to detect due to their small size, preference for hiding deep within the whorls of developing corn plants, and their rapid darting movement when disturbed. Because of these behaviors, effective scouting requires a combination of methods, including vacuum sampling, sweep net sampling, and direct visual inspection. Check the borders and edges of corn fields first as this is where most early migrators will be found.
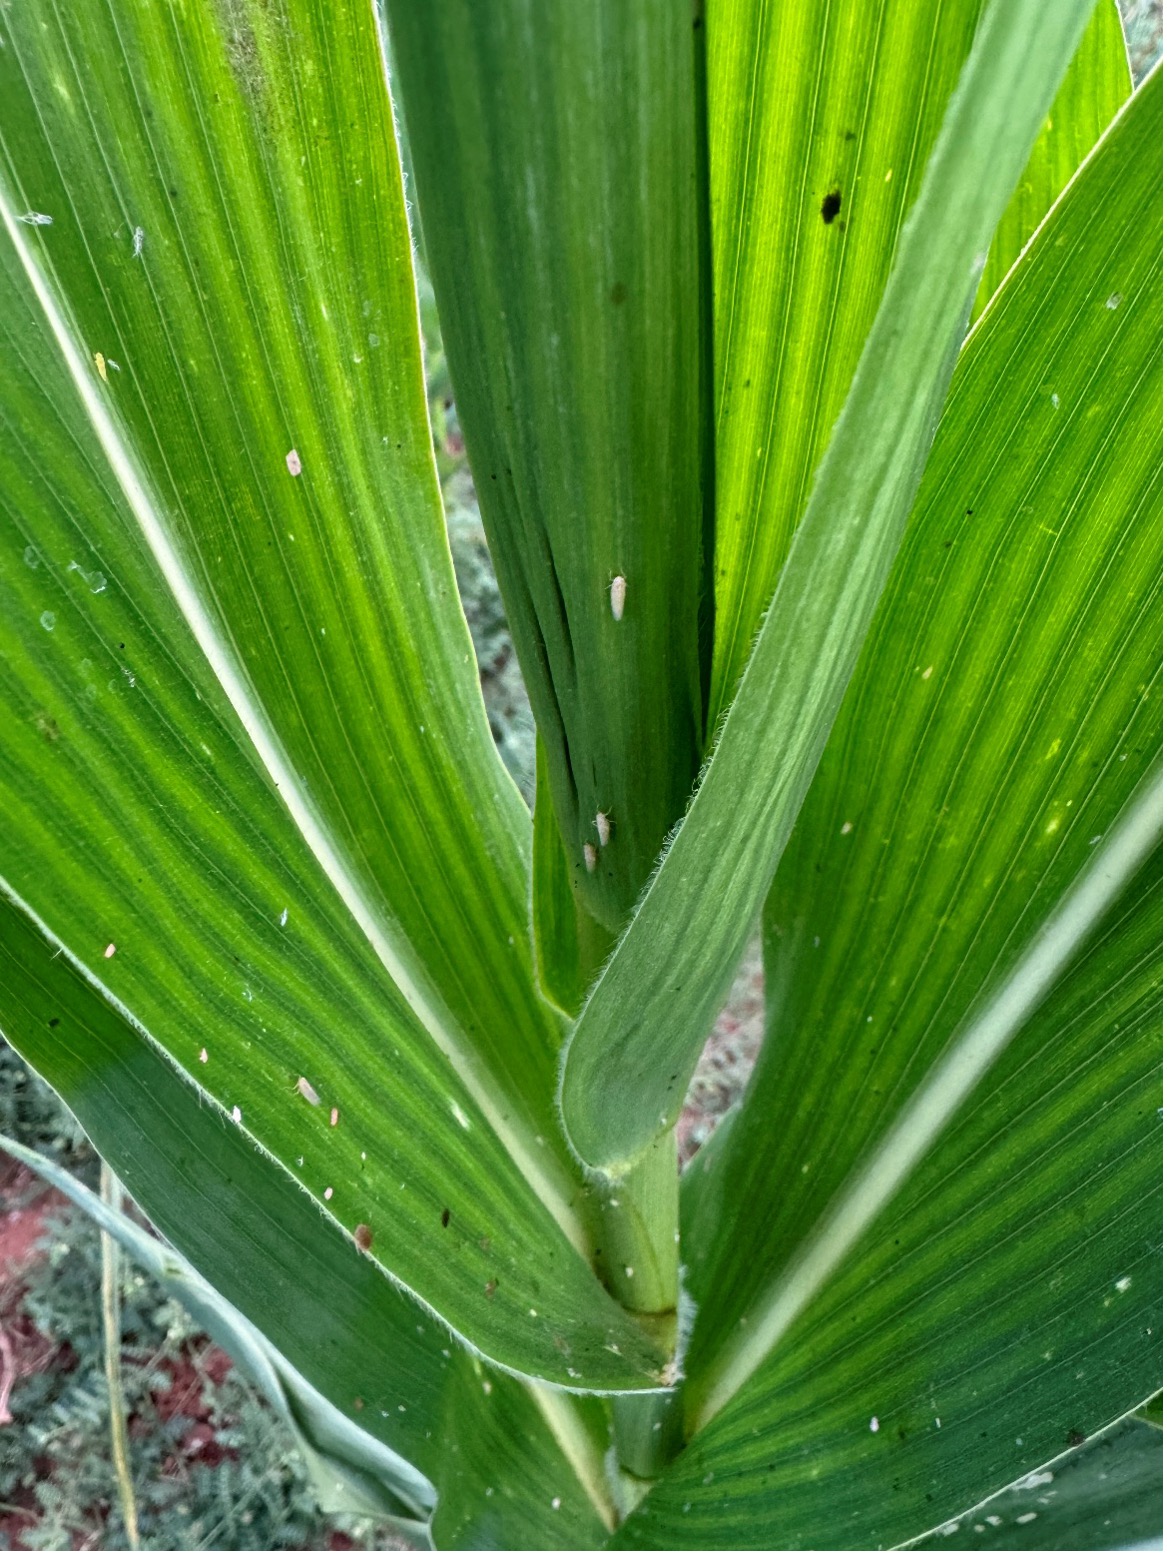
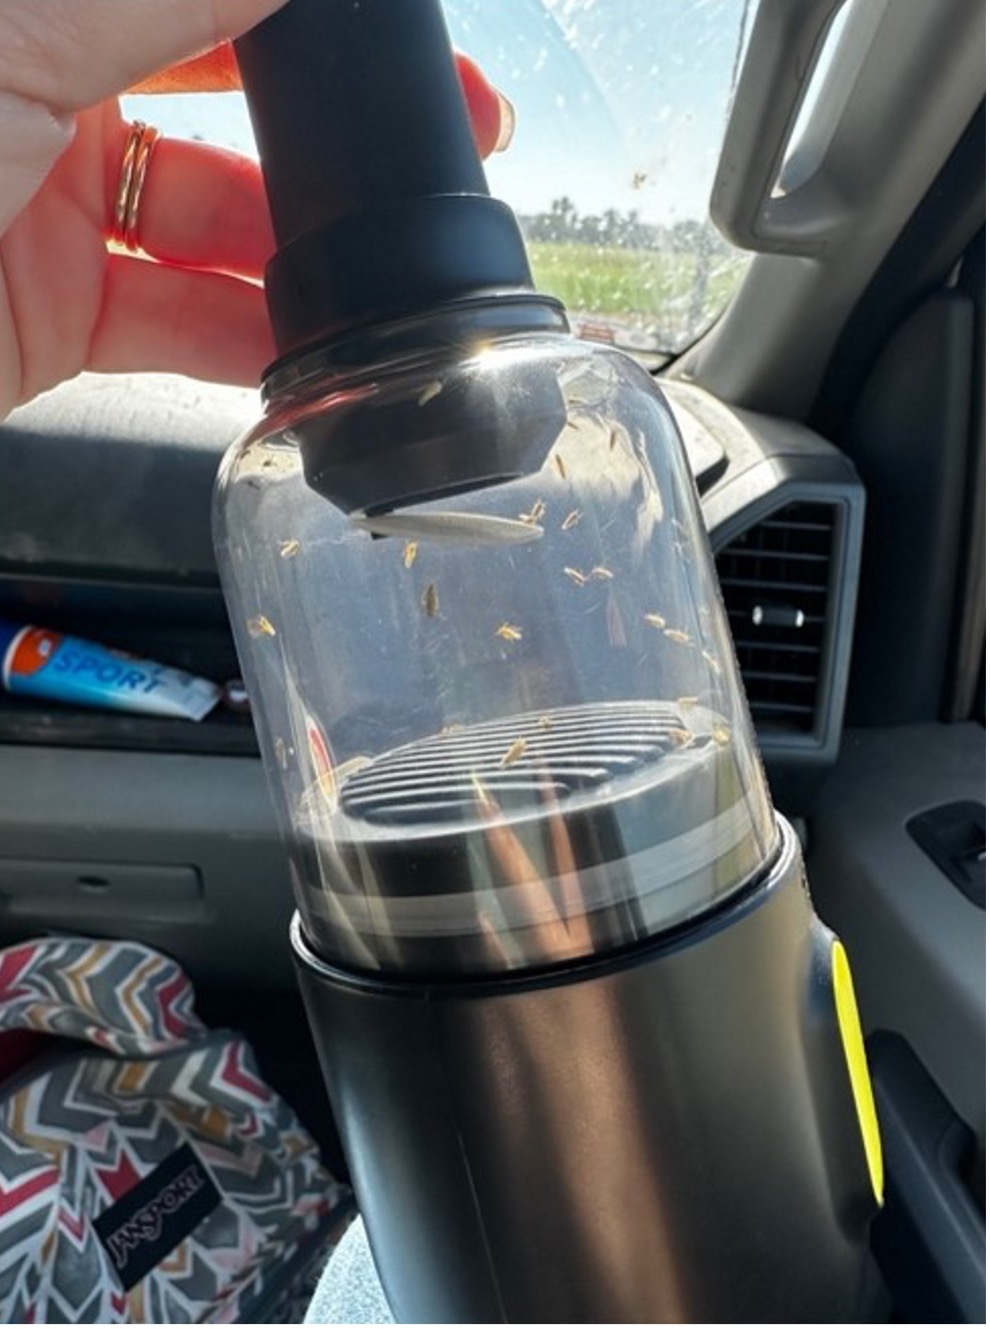
During vegetative growth stages, plants should be carefully examined by inspecting the whorls, where corn leafhoppers often remain concealed (Figure 4 and 5). Individuals may be dislodged from the whorl using a cordless vacuum (Figure 6) or cordless leaf blower equipped with thigh high stockings to capture collected leafhoppers. Vacuum several whorls, randomly at the field borders, moving into the interior of the field.
Sweep net sampling is another useful scouting tool. When walking through corn rows, the net should be swept side-to-side in a figure-eight motion over the canopy and across plants on both sides of the row. After several sweeps, the net should be carefully closed, and contents slowly examined for the presence of corn leafhoppers. As the crop transitions into reproductive stages, sweep netting should be adjusted to target the lower portion up to through the upper and mid-canopy by sweeping up and down along the sides of the corn plants.
Visual inspection remains an important component of scouting throughout both vegetative and reproductive stages. In vegetative corn, focus on whorl inspection. As the canopy closes and plants reach reproductive stages, examine the underside of leaves where leafhoppers may congregate. Check the underside of lower leaves for nymphs. When entering a field, pause periodically to allow leafhoppers to settle, then slowly observe surrounding plants before moving forward.
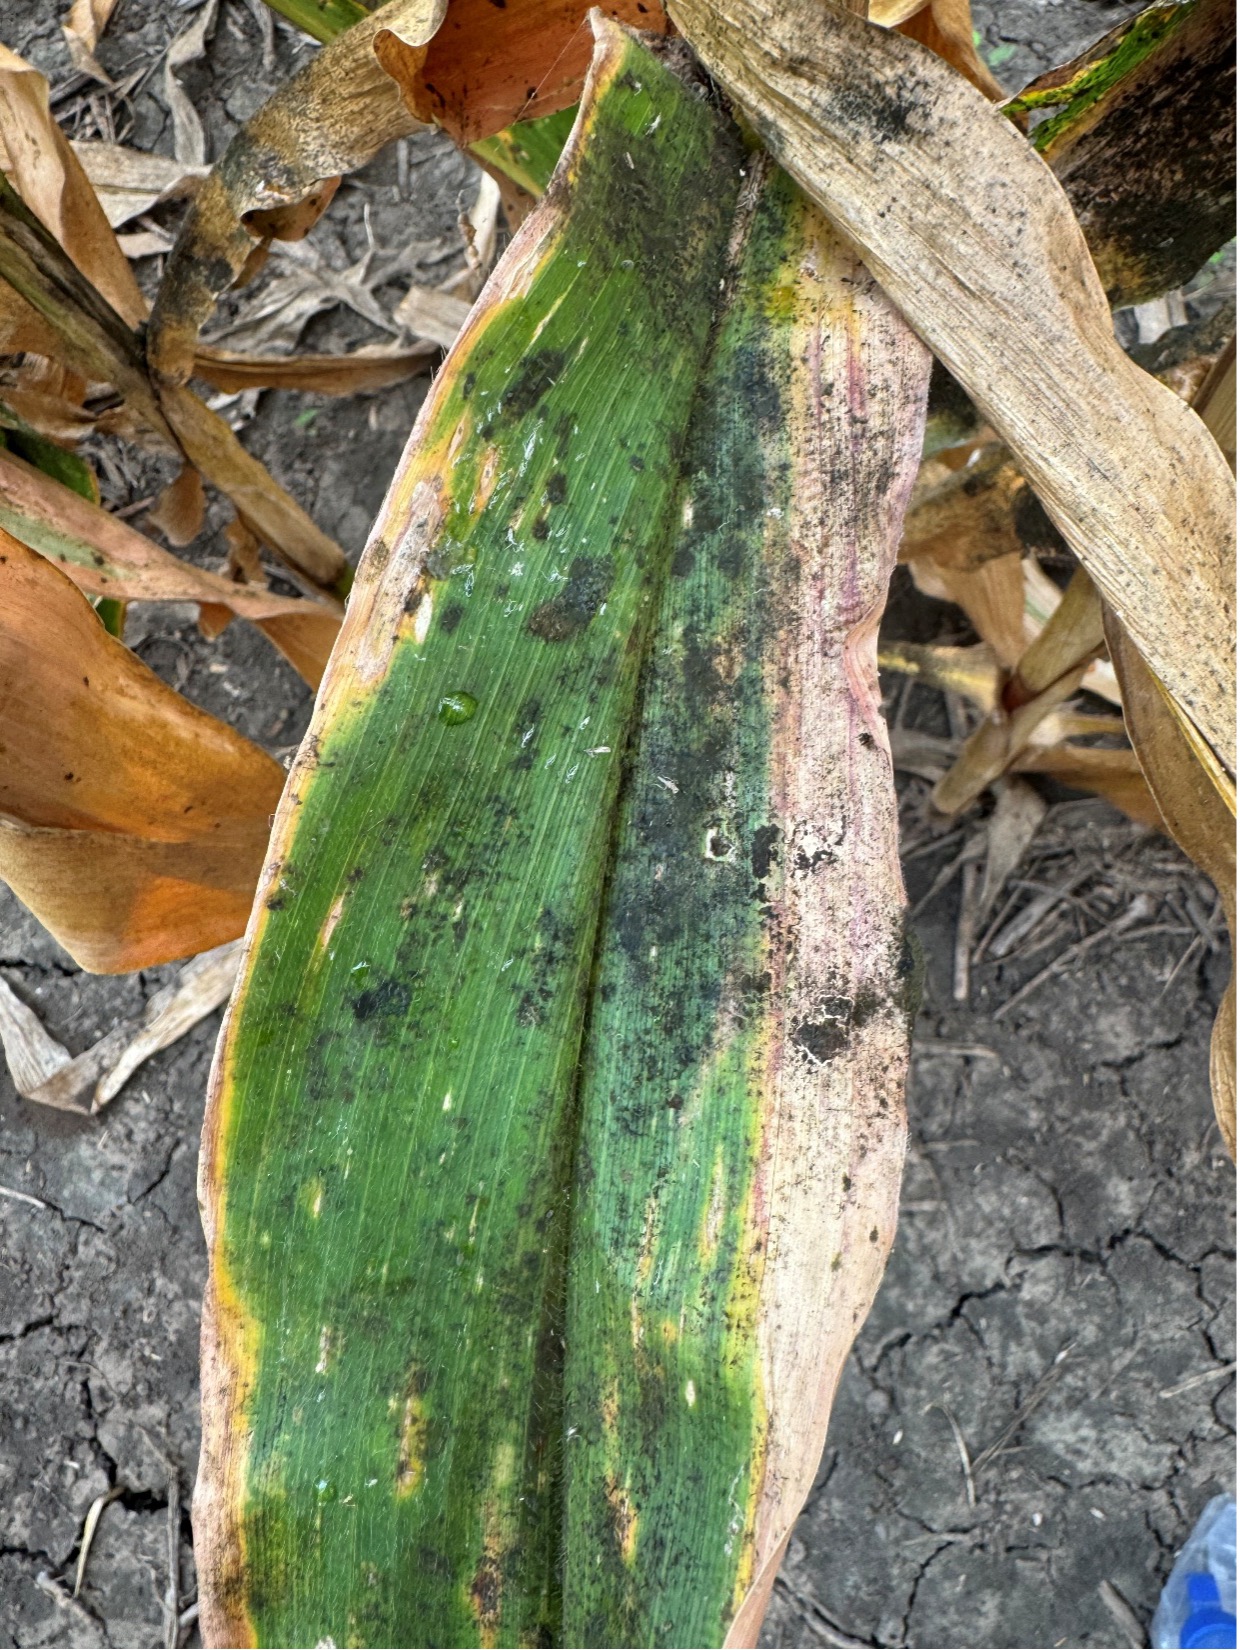
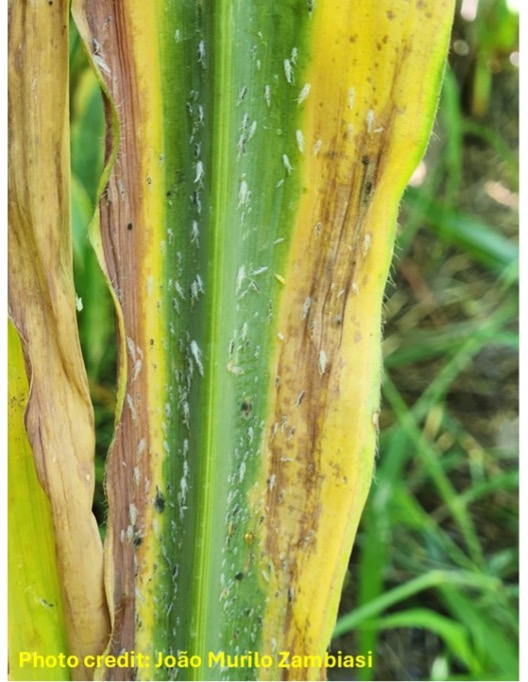
In addition to the insects themselves, other indicators of corn leafhopper presence include honeydew deposits, which appear shiny and feel sticky, the development of black sooty mold growing on honeydew (Figure 7), and the presence of white or translucent cast skins (exuviae) resulting from molting (Figure 8).
Current Integrated Pest Management (IPM) Guidance for Corn Leafhoppers
Pre-planting and Planting Decisions
There are currently no known corn stunt resistant hybrids available on the U.S. market. In areas where volunteer corn is present, growers should remove it as this vegetation serves as a reproductive resource for the insect and a potential reservoir for corn stunt pathogens. When possible, growers are encouraged to plant corn early, as this will help reduce the likelihood of corn being planted when corn leafhoppers are present. In areas where corn leafhoppers will be present at planting, growers should use a high insecticide seed treatment containing Cruiser® Corn 1250 or Poncho® 1250 to allow for protection of early vegetative stages. Trials conducted by Texas A&M AgriLife Research and Extension indicate that 500 and 1250 rates of the insecticide seed treatments suppress corn leafhopper adults through V5 and suppress nymphs (or egg laying) at least until V10. The higher 1250 rates of insecticide seed treatment outperformed the lower 500 rates.
Scout for the Corn Leafhopper
Follow the scouting guidance outlined above to monitor for the insect. Due to the efficiency of corn leafhoppers in transmitting pathogens associated with corn stunt disease, no economic threshold has been established at this time. As a result, growers are encouraged to manage corn leafhopper populations when they are detected in the field.
At present, the exact corn growth stage at which scouting should cease is not known. Previous guidance suggested continuing scouting through the V8 growth stage; however, based on past observations by state Extension personnel, recommendations have been extended to encourage growers to continue managing corn leafhopper populations through the R1 or R2 growth stages. More research is needed to determine the cutoff point for insect management under U.S. crop production conditions.
Chemical Control Options
Results from foliar insecticide efficacy trials conducted in 2025 by Dr. Ashleigh Faris at Oklahoma State University, and by personnel at Texas A&M AgriLife Research and Extension, provide insight into current foliar management options for corn leafhopper.
In these studies, pyrethroid insecticides and dimethoate were largely ineffective against corn leafhoppers. Foliar applications of indoxacarb at 8 – 10 fl. oz./A rate and flupyradifurone at 7 fl. oz./A rate provided up to 14 days of suppression for corn leafhopper nymphs. Thiamethoxam and lambda-cyhalothrin at 10 fl. oz./A rate provided similar nymph suppression for 14 days. If applying a foliar insecticide prior to tassel, applicators should not use a non-ionic surfactant (NIS) as an adjuvant. An NIS applied pre-tassel, particularly mid to late vegetative stages (V6-VT) can result in arrested ear development which causes “baby” or stunted ears/cobs with reduced or absent kernels, underdeveloped husks, poor or absent silk emergence and reddish/purple leaves These symptoms can appear like corn stunt disease symptoms; however, confirmation of corn stunt disease pathogens can only be done through molecular testing.
When selecting an insecticide, growers should prioritize products that are not broad-spectrum and that are less disruptive to beneficial arthropods, to preserve natural biological control in the agroecosystem. Insecticide applications should only be made when corn leafhoppers are confirmed to be present in the field being treated. As with all pest management decisions, the insecticide label must be followed; the label is the law.
Integrated pest management (IPM) recommendations for corn leafhopper will continue to evolve as additional research becomes available under Oklahoma growing conditions. Growers are encouraged to stay updated through future OSU Pest e-Alerts and to follow Cropping Systems Extension Entomologist Dr. Ashleigh Faris (@OSU_crop_insects) and OSU Field Crops Pathologist Dr. Maira Duffeck (@osu.plantpath) on Instagram for ongoing updates on corn leafhopper and corn stunt disease distribution in the state and results from 2026 insecticide efficacy trials.
Protect Your Emerging Stands: True Armyworm Movement from Maturing Wheat to Summer Crops
Ashleigh M. Faris, Cropping Systems Extension Entomologist & IPM Coordinator
As the Oklahoma winter wheat crop reaches maturity, producers and crop consultants should prepare for the annual migration of true armyworm larvae. While true armyworms are a common fixture in small grains, their movement out of maturing wheat and into newly emerged corn, soybeans, and sorghum can lead to stand thinning or loss if not monitored closely.
True Armyworm Migration Timeline
True armyworm moths typically migrate into Oklahoma from the south in early spring with infestations typically occurring in late April through the first two weeks of May. The first generation is typically laid in winter wheat. Once the larvae currently finish their development in wheat, they will soon seek new food sources as the wheat crop dries down. This transition period is the most critical time for scouting summer crops, especially those adjacent to wheat fields.
True Armyworm Life Cycle and Identification
Armyworms overwinter as pupae or as mature larvae which pupate in the spring. Moths emerge in the spring, mate, and lay eggs in masses on hosts plants (mostly in the grass family). Female moths deposit their eggs in low-lying areas on wheat or pasture ground, as well as field margins or fields with dense, grassy weeds like Johnson grass. Larvae feed for about 4 weeks but do most of their damage during the last 10 days of this period. They then pupate in the soil. A new generation of moths emerges about 1 week later. There are 4 generations per year in Oklahoma.
True armyworms have a smooth body and can be variable in color, ranging from green, tan, orange, and black, with distinct pale orange or reddish stripes running along the sides (Figure 1). A key identifier is a dark diagonal band on each of the abdominal prolegs; there are four pairs of prolegs (Figure 2). The head capsule is light brown with a distinct “net-like” or honeycomb pattern of dark lines (Figure 2).
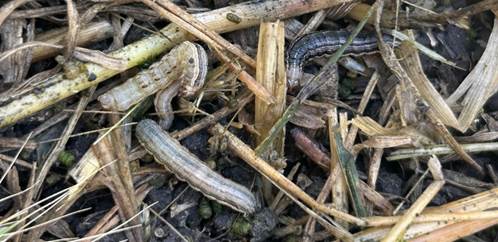
Figure 1. Four true armyworm larvae. One is dark (right) and three are light colored (left). Photo by Ashley Dean, Iowa State University Extension.
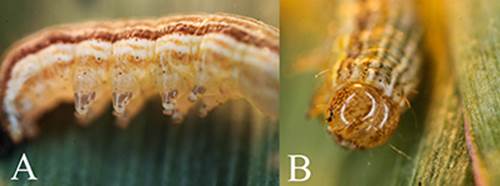
Figure 2. True armyworm. A) Dark band on prolegs. B) Orange head capsule with dark net-like pattern. Photos by Adam Varenhorst, Iowa State University Extension.
True Armyworm Management Cutoff in Wheat
A common question during this window is whether to treat armyworms in maturing wheat. Once wheat reaches the soft dough stage, the crop has generally accumulated its yield. Unless larvae are actively head-clipping (cutting the wheat heads off the stems), chemical control is rarely economical at this stage. Instead of treating the wheat, focus on young stands of summer crops. As wheat turns brown, larvae will move toward the nearest green tissue—often your emerging corn or sorghum.
Scouting, Damage, and Economic Thresholds for Summer Crops
Armyworms are whorl feeders in grass crops like corn and sorghum and will also feed on soybean leaves. True armyworms hide in the soil, crop residue, or whorls during the heat of the day and feed at in the early morning, evening or late when it is cool outside. When it is warm, larvae will hide in the soil, crop residue, or the whorl of corn plants. Large larvae consume more tissue but will generally be done feeding in a few days. Insecticides should target young, small larvae that will be feeding for a long time; however, you may see a range of larval sizes in a single field.
Corn, Sorghum, and Soybean Damage
True armyworm feeding typically begins at the leaf edges, leaving ragged holes and edges (Figure 3). As this leaf tissue is removed, the larvae will move to the upper leaves and continue feeding. True armyworms do not tunnel into the stalk and generally do not feed on the growing point of larger corn and sorghum plants. While not the preferred host, true armyworms will move into soybeans if no grasses are available. Larvae typically cause defoliation (Figure 4); however, soybeans are quite resilient to early-season leaf loss, but scout for stand-thinning if larvae are clipping seedlings.
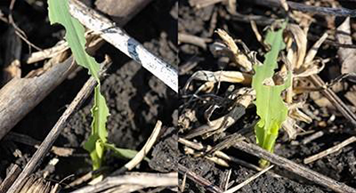
Figure 3. True armyworm feeding on young corn plant. Photo by Adam Varenhorst, Iowa State University Extension.
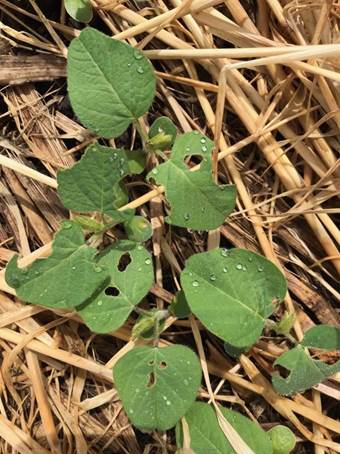
Figure 4. Soybean leaves with true armyworm feeding damage. Photo by Meaghan Anderson, Iowa State University Extension.
Corn Threshold: Small plants typically recover from true armyworm feeding and outgrow the defoliation. Per Kansas State Extension, treatment is justified only when larvae are less than 1.25 inches long and present on 30% of plants with 5 – 6 extended leaves, or when 75% of plants have one or more larva per plant. There is risk of yield loss if defoliation during reproductive stages approaches the ear zone before hard dent. Lower thresholds may apply if the plants are subject to additional stresses.
Sorghum Threshold: Sorghum is very tolerant of defoliation, so insecticide control is rarely justified. For early infestations (5-7 leaf stage, prior to panicle development) at the vegetative stages where true armyworms may be in the whorl, do not initiate controls unless 40% or more of the plants in a field are infested. Because the worms are only defoliating at this point in the sorghum plant’s development, economic damage is not a concern and there would likely be no return on investment for spraying before panicle development.
Soybean Threshold: Once grasses are fed upon or harvested, true armyworms can turn tobroadleaf crops, including soybean. While soybean is not a preferred host, the growing point is exposed early in the season, making them susceptible to stand loss. Management is suggested if soybean defoliation is greater than 35% – 40% during the vegetative stages.
True Armyworm Insecticide Management Options for Summer Crops
True armyworm is generally easier to control with pyrethroids than fall armyworm. Ensure high-volume water (10-15 GPA ground) is used to get the product into the whorl or canopy where the larvae hide. Remember that most insecticides work via contact; if true armyworm larvae are feeding or hiding under dense residue, insecticides are unlikely to make contact and are ineffective. Target applications when larvae are actively feeding on foliage to ensure good contact. Follow all instructions on the insecticide label to ensure good control.
For a complete list of recommended insecticides and rates for these crops, please consult the following OSU Fact Sheets: CR-7167: Management of Insect and Mite Pests in Corn and Sorghum and CR-7115: Management of Insect and Mite Pests in Soybean.
The information given herein is for educational purposes only. Reference to commercial products or trade names is made with the understanding that no discrimination is intended and no endorsement by the Cooperative Extension Service is implied.
Corn Hybrids’ Yield Response to Limited Well Capacities in the Central High Plains
Macie McPeak: M.S in Irrigation and Water Management
Sumit Sharma : Extension Specialist for High Plains Irrigation and Water Management
Background
The Central High Plains, which include the Oklahoma Panhandle, Southwest Kansas, Southeast Colorado, and Northern Texas Panhandle, is a heavily farmed semi-arid region that depends on the Ogallala Aquifer for irrigation to ensure stable crop yields. However, the continuous decline of the Ogallala Aquifer has resulted in increased need for irrigation strategies that conserve water while maintaining crop profitability. Corn remains the most water consuming crop with highest productivity per unit of irrigation applied, and strong economic returns in the Central High Plains region. However, corn is also the most sensitive to water stress among all the existing cropping systems (including sorghum, cotton, and sunflower, soybeans and wheat). Declining water table has reduced the well capacities in many areas in the region, which cannot meet crop water demand, making it a growing challenge for corn production. Therefore, there is a need for research in irrigation strategies and agronomic choices such as drought tolerant hybrids, seeding rate, planting date, and hybrid maturity for sustainable and profitable corn production with reduced well capacities in the region. This blog discusses the yield response of different corn hybrids to limited well capacities in the Oklahoma Panhandle area of the Central High Plains.
Limited well capacities only meet partial crop water demand, which in general leads to yield declines especially in high water demanding crops such as corn. Several previous studies suggest that crop productivity does not significantly decrease as long as irrigation is maintained at approximately 75–80% of full evapotranspiration (ET) replacement (Su et al., 2022; Klocke et al., 2007; Zhao et al., 2019). However, when irrigation levels are more restricted, such as under reduced well capacities, there can be substantial yield losses and diminished economic returns. The magnitude of yield reduction varies with region, hybrids, and growth stage at which water stress occurred. For example, in the Central High Plains the corn ET demand is highest in Texas Panhandle and decreases as we move north towards Nebraska. Zhao et al. (2019) found that applying 75% ET in the Texas Panhandle produced corn yields equivalent to full irrigation, whereas reducing irrigation to 50% caused significant yield reductions. Similarly, Klocke et al. (2007) reported that limited irrigation at roughly 50% of full ET replacement in Nebraska achieved 80–90% of fully irrigated yields across multiple crop rotations. Therefore, the irrigation strategies which work in one region may not work the same way in other regions with different crop water demand and must be tested for the region-specific climatic conditions.
The current study was conducted in 2025 at the Oklahoma Panhandle Research and Extension Center in Goodwell, OK. Four Pioneer brand corn hybrids including P13777 (113 day maturity), P10625 (110 day maturity), P05810 (105 day maturity), and P14346 (114 days maturity) were planted at 22,000 and 28,000 seeds per acre. The hybrids were irrigated with a center pivot fitted with variable rate irrigation system at 200, 300, 400, and 500 GPM well capacities. The well capacities were simulated by adjusting the frequency of irrigation events.
Results & Discussion
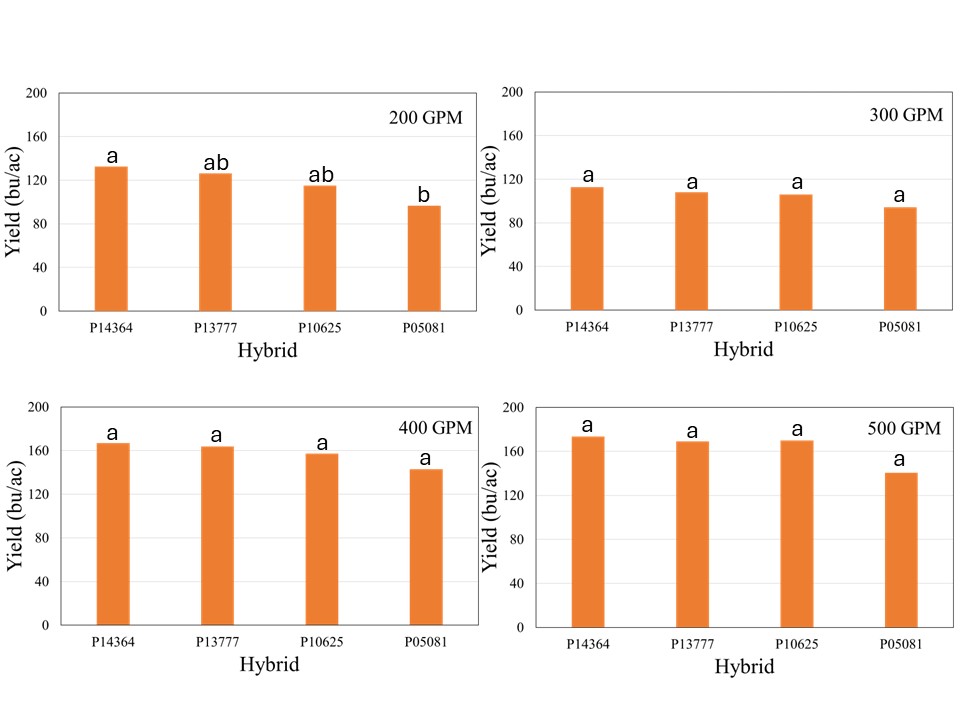
The crop received 12.1 inches of rain from planting until physiological maturity, while total rainfall from April till September was over 15 inches. Manual probing of the field showed near 4 feet soil profile at the time of planting which can hold up to 2 inches of plant available water per foot. The well capacities 200, 300, 400, and 500 GPM treatments received 7.4, 8.9, 10.8, and 12.0 inches of irrigation, respectively. The data showed no significant effect of population on corn yield across hybrids for any well capacity. However, the hybrids showed significant interaction with well capacities, which indicated that hybrid yield response varied at different capacities (Figure 1). In general, the average yield declined from longest maturity to shortest maturity hybrids irrespective of the well capacity, but was only statistically significant at for 200 GPM (Figure1). At this irrigation level, the shortest maturity hybrid P05081 yielded significantly lower yield than longest maturity hybrid P14364, while P13777 and P10625 were not different from either of these two hybrids.
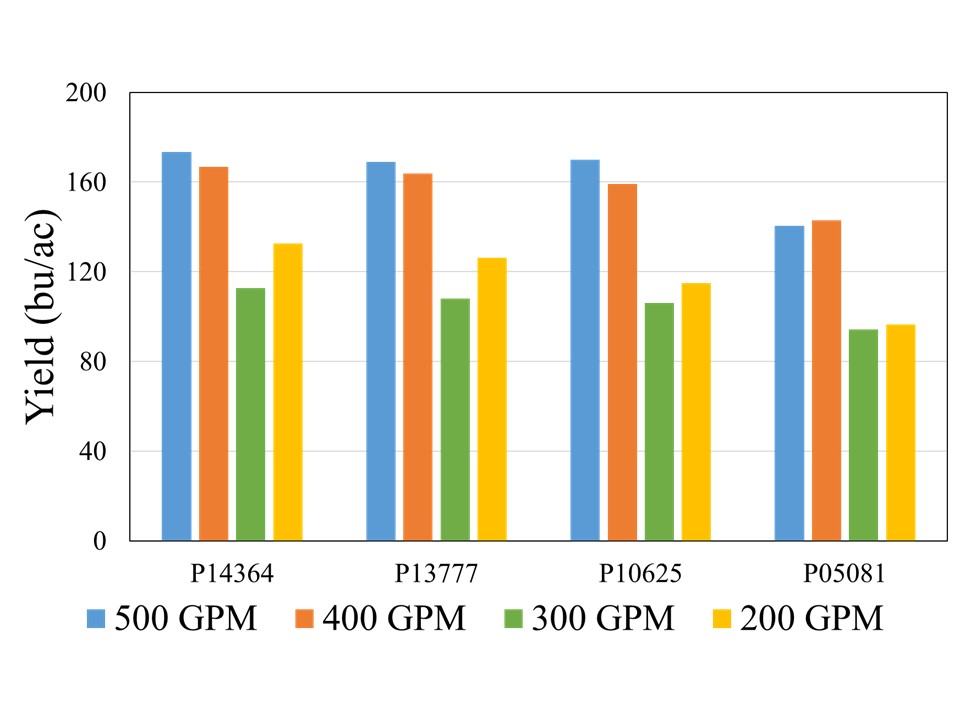
Although there was no statistical difference among the hybrids at 500, 400, and 300 GPM, when compared across well capacities, yield reductions were most pronounced at the 200 and 300 GPM irrigation levels for each individual hybrid, indicating that irrigation capacity was the primary yield limiting factor under restricted water availability (Figure 2). While the exact causes of this abrupt decline are not yet understood, as mentioned in the beginning of this blog, previous literature has suggested that severe yield decline in corn can be expected when irrigation is reduced to 60% ET replacement in the study region. Both 300 and 200 GPM well capacities met 60 and 65% crop ET demand, while 400 and 500 GPM met 71 and75% crop ET demand, respectively. More data will be needed to ascertain these threshold levels of well capacities for corn production in this region.
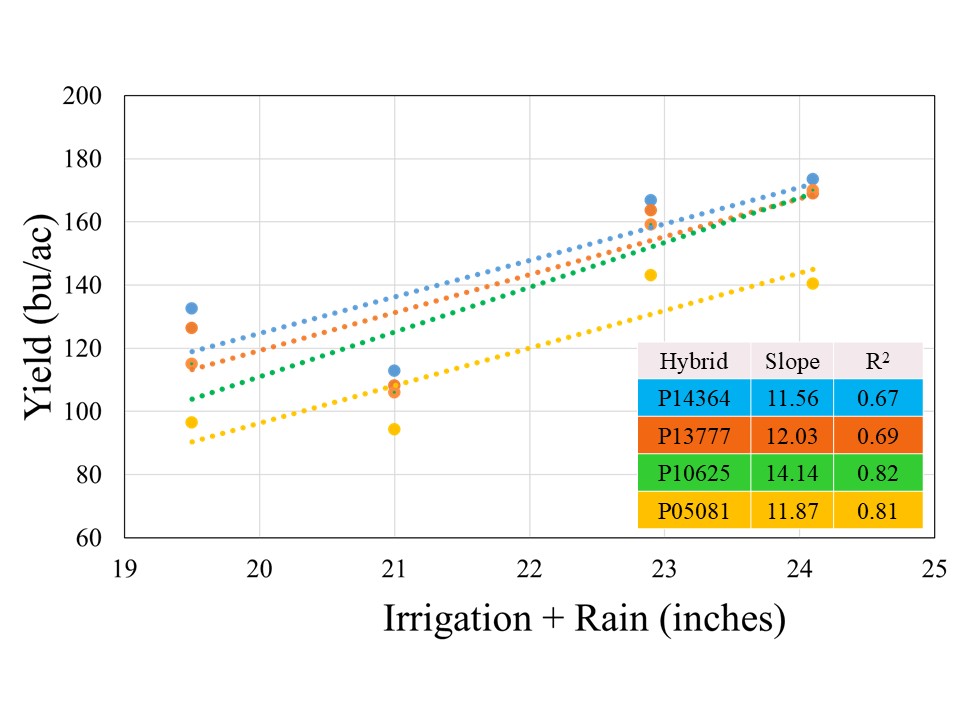
All the hybrids showed a positive yield response to Irrigation+Rain with different yield gains per inch of water applied (Figure 3). Hybrid P10625 registered highest yield gain of 14.1 bushel per inch of water applied, followed by P13777 (12.0 bu), P05081 (11.9 bu), and P14364 (11.6 bu). The stronger coefficient of regression (>80%) for two short maturity varieties indicated that irrigation was stronger yield limitation factor for these hybrids, in comparison to 114 and 113-day maturity hybrids for irrigation explained on 67 and 69% variability, respectively. This suggests that besides irrigation there might be other factors which could contribute to filling the yield gaps for given irrigation levels in longer maturity hybrids.
Planting population did not significantly affect grain yield across irrigation capacities. When pooled across the hybrids for individual planting populations, 28,000 seeding rates resulted in gain of 0.1, 2.6, 5, and 12 bushels per acre for 200, 300, 400, and 500 GPM, respectively. This indicates that higher planting populations at well capacities of 400 or above should be considered, while reducing population at 300 GPM or lower might be more cost-effective option.
Take Home
- Irrigation capacity remains the primary determinant of yield potential under limited well capacities in the Central High Plains.
- Pre-irrigation and recharging the soil profiles will be critical to support crop water demand for limited well capacities.
- Short maturity hybrids appeared to have consistently lower average yield and more vulnerable for yield losses at limited irrigation. However, one must consider that the growing conditions were more conducive for corn production in 2025 which generally favor long maturity hybrids. Therefore, long-term data will be required to assess the performance of short maturity hybrids during inclement growing seasons.
- Even though population didn’t significantly influence the grain yield. The 28,000 seeding rates overall had higher average yield at 400 and 500 GPM. Therefore, producers should consider the higher population at these well capacities or more.
- Overall, irrigation is the most important factor for yields, but there is a need for long-term agronomic data on hybrid maturity and population along with economic analysis to ascertain these findings.
Thoughts from an Agronomist- 1 Management of the Primordia
Josh Lofton, Cropping Systems Specialist
Many crop management recommendations emphasize actions that must be taken well before a crop reaches what we often call “critical growth stages.” Management this early can seem counterintuitive when the crop still looks small, healthy, or unchanged aboveground. However, much of a crop’s yield potential is determined early in the season at a level we cannot see in the field. Long before flowers, tassels, or heads (or any reproductive structure) appear, the plant is already making developmental decisions that shape its final yield potential. Understanding this “behind the scenes” process helps explain why timely, early-season management is often more effective than trying to correct problems later.
At the center of this process is the shoot apical meristem, commonly referred to as the growing point. This tissue produces leaf and reproductive primordia, which are the earliest developmental stages of future everything in the plant. These primordia form well before the corresponding plant parts are visible. Once these structures initiate—or if they fail to begin due to stress—the outcome is permanent. The plant cannot later in the season go back and recreate leaf number, leaf size, or reproductive capacity. As a result, early environmental conditions and management decisions play a disproportionate role in determining yield potential.
Corn is a good example of how early development influences final yield. By the time corn reaches the V4 growth stage, the plant only has four visible leaves with collars, yet internally it is far more advanced. Most of the total leaf primordia that will eventually form the full canopy have already begun, and the potential size of the ear is starting to be established. During this stage, the growing point is still below the soil surface and somewhat protected from some stressors but highly susceptible to others. Nitrogen deficiency, cold temperatures, moisture stress, compaction, or herbicide injury at or before V4 can reduce leaf number and limit leaf expansion. Even if growing conditions improve later, the plant cannot replace leaf primordia that were never formed, which reduces its ability to intercept sunlight and support high yields.
As corn approaches tasseling (VT), the crop enters a stage that is visually and physiologically important. Pollination, fertilization, and early kernel development occur at this time, and stress can have a critical impact on kernel set. However, by VT, the plant has already completed leaf formation, and much of the ear size potential has already been determined several growth stages earlier. Management at VT is therefore focused on protecting yield rather than creating it. Late-season nutrient applications may improve plant appearance or maintain green leaf area, but they cannot increase leaf number or rebuild ear potential lost due to early-season stress. This distinction helps explain why some late inputs show limited yield response even when the crop looks responsive.
Grain sorghum provides another clear example of why early management is emphasized. Although sorghum often grows slowly early in the season and may appear unimportant during the first few weeks after emergence, the first 30 days are among the most critical periods in its development. During this time, the growing point is actively producing leaf primordia and transitioning from vegetative growth toward reproductive development. Head size potential is primarily established during this early window, and the plant’s capacity to support tillers is influenced by early nutrient availability and moisture conditions. Stress from nitrogen deficiency, drought, weed competition, or restricted rooting during the first 30 days can reduce head size and kernel number long before visible symptoms appear.
Once sorghum reaches later vegetative and reproductive stages, much like corn at VT, management shifts from building yield potential to protecting what has already been determined. Improving conditions later in the season can help maintain plant health and grain fill, but it cannot fully compensate for early limitations imposed at the primordial level. This is why early fertility placement, timely weed control, and moisture conservation are consistently emphasized in sorghum production systems.
Across crops, a typical pattern emerges: the growth stages we observe in the field often reflect decisions the plant made weeks earlier. When agronomists stress early-season management, they are responding to plant biology rather than simply following tradition. By the time visible “critical stages” arrive, the plant has already established many of the components that define yield potential.
The key takeaway is that effective crop management must be proactive rather than reactive. Early-season decisions support the crop while it is still determining how many leaves it can produce, how large its reproductive structures can become, and how much yield it can ultimately support. Waiting until stress becomes visible often means responding after the plant has already adjusted its potential downward. Recognizing what is happening at the primordial level helps explain why management ahead of critical stages consistently delivers the greatest return, even when the crop appears small and unaffected aboveground.
For questions or comments reach out to Dr. Josh Lofton
josh.lofton@okstate.edu
Toto, I’ve a feeling we’re not in Kansas anymore. Double Cropping, Orange edition
It has been pointed out that the blog https://osunpk.com/2025/06/09/double-crop-options-after-wheat-ksu-edition/ had a significant Purple Haze. And I should have added the Oklahoma caveat. So Dr. Lofton has provided his take on DC corn in Oklahoma.
Double-crop Corn: An Oklahoma Perspective.
Dr. Josh Lofton, Cropping Systems Specialist.
Several weeks ago, a blog was published discussing double-crop options with a specific focus on Kansas. I wanted to address one part of that blog with a greater focus on Oklahoma, and that section would be the viability of double-crop corn as an option.
Double-crop farming is considered a high-risk, high-reward system to try. Establishing a crop during the hottest and often driest parts of summer can present challenges that need to be overcome. Double-crop corn faces these same challenges and, in some seasons, even more. However, it is definitely a system that can work in Oklahoma, especially farther south. If you look at that original blog post, one of the main challenges discussed is having enough heat units before the first frost. When examining historic data, like those below from NOAA, the first potential frost date for Northcentral and Northwest Oklahoma may be as early as the first 15 days of October but more often will be in the last 15 days of October. In Southwest and Central Oklahoma, this date shifts even later to the first 15 days of November. This is later than Kansas, especially northern Kansas, which has a much higher chance of experiencing an early October freeze. I do not want to downplay this risk; however, it is one of the biggest risks growers face with this system, and a later fall freeze would greatly benefit it. We have been conducting trials near Stillwater for the past five years on double-crop corn and have only failed the crop once due to an early freeze event. But in that year, both double-crop soybean and sorghum also did not perform well.

The main advantage of double-crop corn is that if you miss the early season window, it offers the best chance for the crop to reach pollination and early grain fill without the stress of the hottest and driest part of the year. Therefore, careful management is crucial to ensure this benefit isn’t lost. In Oklahoma, we have two systems that can support double-crop corn. In more central and southwest Oklahoma, especially under irrigation, farmers can plant corn soon after wheat harvest, similar to other double-crop systems. This planting window helps minimize the impact of Southern Rust, which can significantly reduce yields in some years, and may reduce the need for extensive management. This earlier planting window is often supported by irrigation, enabling the crop to endure the hotter, drier late July and early August periods. Conversely, in northern Oklahoma, planting often occurs in July to allow pollination and grain fill (usually 30-45 days after emergence) to happen in late August and early September. During this period, the chances of rainfall and cooler nighttime temperatures increase, both of which are critical for successful corn production.
Other management considerations include maturity. Based on initial testing in Oklahoma, particularly in the northern areas, we prefer to plant longer-maturity corn. Early corn varieties have a better chance of maturing before a potential early freeze but also carry a higher risk of undergoing critical reproduction stages (pollination and early grain fill) during hot, dry periods in late summer. Testing indicates that corn with a maturity of over 110 days often works well for this. However, this does not mean growers cannot plant shorter-season corn, especially if the season has generally been cooler, though the risk still exists depending on how quickly the crop can grow. Based on testing within the state, the dryland double-crop corn system typically does not require adjustments to other management practices, such as seeding rates or nitrogen application. Because of the need to coordinate leaf architecture and manage limited water resources, higher seeding rates are not recommended. Maintaining current nitrogen levels allows the crop to develop a full canopy.
The final question often comes as; how does it yield? This will depend greatly. Corn looks very good this year across that state, especially what was able to be planted earlier in the spring. However, in recent years, delaying even a couple of weeks beyond traditional planting windows has lowered yields enough that double-crop yields are often similar. We have often harvested between 50-120 bushels per acre in our plots around Stillwater with double-crop systems. So, the yield potential is still there.
In the end, Oklahoma growers know that double-crop is a risk regardless of the crop chosen. There are additional risks for double-crop corn, such as Southern Rust in the south and freeze dates in the north. This risk is increased by the presence of Corn Leaf Aphid and Corn Stunt last season, and it is not clear if these will be ongoing problems. Therefore, growers need to be careful not to expect too much or to invest too heavily in inputs that may not be recoverable if there is a loss. One silver lining is that if double-crop corn doesn’t succeed in any given year, growers can still use it as forage and recover at least some of their costs.
Any questions or concerns reach out to Dr. Lofton: josh.lofton@okstate.edu
Chinch bugs are active!
Both Josh Lofton and myself have been talking a lot about the magnitude of chinch bugs we’ve seen this year and the devastation they are having on the crops, both false and true chinch bugs. They have marched through sorghum and now are being found in corn fields. They seen especially bad in failed wheat fields. And in my fields anywhere I had a crabgrass. We are also hearing and seeing a significant increase in blister beetles and stink bugs in soybeans. As a soil scientist all I can recommend is to scout Often, and contact an entomologist or trusted advisor. Kansas State just put out and E-update yesterday with this article from Jeff Whitworth I wanted to share.

Chinch bugs are active in Kansas
Guest Author Jeff Whitworth, Extension Entomologist jwhitwor@ksu.edu
Chinch bugs have historically been a problem in Kansas–in lawns, golf courses, turf farms, etc. But in agriculture, they are mainly a problem in sorghum. However, they can also affect corn and occasionally wheat. Since they are true bugs, chinch bugs may attack any grass where they insert their mouthparts into the plants and suck out the juice. This often has little to no effect on the plant unless there are large numbers of bugs and/or the plants are growing under less-than-ideal conditions so that they are already stressed. Chinch bug feeding simply adds to this stress.
Sampling for chinch bugs the week of July 4 indicated that 95% of the chinch bug population in north central Kansas were adults (Figure 1). Adults don’t feed as much as nymphs but are more concerned with mating, oviposition, etc. This means the majority of feeding in crops (sorghum, corn, etc.) is still to come after the nymphs hatch (Figure 2).
Treating for chinch bugs needs to be accomplished using as much carrier (water) as practical to ensure the insecticide gets good coverage on the plants, including the base of the plants (sprays directed at the base of the plants will help). Nymphs produced now will most likely become adults in 3-4 weeks, then mate and start the process all over again for another generation, which will then move to fall-planted wheat, then on to overwintering sites. They overwinter in bunch grasses then move to wheat in the spring to deposit eggs and start all over again.


Original link https://eupdate.agronomy.ksu.edu/article_new/chinch-bugs-are-active-in-kansas-553-4
To Subscribe to KSU E-update. https://eupdate.agronomy.ksu.edu/index_new_prep.php
Pre-plant Irrigation
Sumit Sharma, Irrigation Management Extension Specialist.
Jason Warren, Soil and Water Conservation Extension Specialist.
Pre plant-irrigation is a common practice in Western Oklahoma to recharge soil profile before growing season starts. Pre-plant irrigation is useful when the irrigation capacity is not enough to meet peak ET demand. It can also be important to germinate and provide for optimum emergence of the crop. As such, pre-plant irrigation is not useful when the soil profile is already wet, or soil profile is not deep enough to store moisture, or if planting dates are flexible and can wait until rains can recharge soil profile. Pre-plant irrigation becomes an important consideration if the previous crop had extensive rooting systems, which depleted moisture from deep in the profile. The crops in western Oklahoma especially in the Oklahoma Panhandle depend on stored water in the profile to meet ET demand during peak growth period, especially when well capacities are limited. Deep profiles and excellent water holding capacities of soil found in the region make the storage of a considerable amount of moisture possible. While pre-plant irrigation to recharge the whole profile (which can be 6 feet deep) may not be possible or advised, producers can still use certain tools to assess the stored water in the profile and make decisions on pre-plant irrigation.
A soil push probe (Figure 1) can provide a crude estimate of the moisture in a soil profile. For example, if an average person can push the probe to 2 feet, this means that the first 2 feet of the profile has moisture stored in it. The profile beyond 2 feet is considered too dry to push the probe through. This method does not provide the amount of water stored in the profile. For accurate measurements of soil moisture, soil samples could be collected, weighed, dried and weighed again to determine the water content in the soil. An alternative is to install moisture sensors, however this is usually not practical due to potential damage during planting, although some probes that can be permanently buried are becoming available. On average a clay loam soil in western Oklahoma can hold up to 2 inches of plant available water per foot. The approximate water holding capacity of your soil can be found on the websoilsurvey. Your county extension or NRCS personnel should be able to help you navigate this website if necessary. When the water holding capacity of your soil is known, the use of a push probe can provide a preliminary estimate of soil water content. Probing should be done at multiple locations in the field on both bare and covered (with crop residue) spots. The presence of crop residue reduces evaporation and increases infiltration so the first thing you will notice is that it is generally easier to push the probe into the surface where the ground is covered by residue. If the soil water content is near full the probe will be easy to push into the soil and it may even have mud on its tip when you pull it out. In this case you can estimate that the water content to the depth of penetration is near field capacity and that the current water content is equal to the water holding capacity. For example, if you can push the probe 2 ft into a soil with a water holding capacity of 2 inches/ft then we expect to have 4 inches of plant available water. In contrast if it takes some effort to push the rod 2 ft the estimated water content may be reduced.

When pre-irrigation is applied it can be useful to assess the increase in the depth to which the probe can be pushed into the soil after the irrigation event. For example, if 1 inch of irrigation is applied to the soil in the example above, we may expect that after this irrigation event we can push the rode 2.5 ft. However, in some case we may be able to push the rod 3 ft. The reason being that although we could not push the rod beyond 2 ft before the irrigation event, the soil below this depth was not completely dry. Therefore, the 1 inch of water was able to move to a depth of 3 ft. This is useful information, telling us that the soil below the depth we can push the rod contains some water and that each inch we apply may drain a foot into the profile. Generally, we expect the rooting depth of most crops to be able to extract water from at least 4 ft. Although it is certainly possible to extract water from below this depth, we generally don’t want to pre water our soils to full beyond 4 ft. When we fill the profile with pre water, we are increasing success of the following crop by providing the stored moisture that can offset deficits that may occur in the growing season. However, we are reducing our opportunity to capture and utilize spring rainfall. We must consider this when applying pre-irrigation, because if it is followed by rainfall in excess of ET our irrigation efficiency is greatly reduced by the drainage or runoff that can occur.
Components of a variable rate nitrogen recomendation
I recently wrote a article for the Crops and Soils magazine on the components of a Variable Rate Nitrogen Recommendation. The people at the American Society of Agronomy headquarters were kind enough to make it open access. What follows in this blog is just a highlight reel. For the full article visit https://dl.sciencesocieties.org/publications/cns/articles/49/6/24
Components of a variable rate nitrogen recommendation
Variable-rate nitrogen management (VRN) is a fairly hot topic right now. The outcome of VRN promises improved efficiencies, economics, yields, and environmental sustainability. As the scientific community learns more about the crop’s response to fertilizer nitrogen and the soil’s ability to provide nitrogen, the complexity of providing VRN recommendations, which both maximize profitability and minimize environmental risk, becomes more evident.
The components of nitrogen fertilizer recommendations are the same whether it is for a field flat rate or a variable-rate map. The basis for all N recommendations can be traced back to the Stanford equation (Stanford, 1973). At first glance, the Stanford equation is very basic and fairly elegant with only three variables in the equation.

Historically, this was accomplished on a field level through yield goal estimates and soil test nitrate values. The generalized conversions such as 1.2 lb N/bu of corn and 2.0 lb N/bu of winter wheat took account for Ncrop and efert to simplify the process.
NCrop
The basis for Ncrop is grain yield × grain N concentration. As grain N is fairly consistent, the goal of VRN methods is to identify grain yield. This is achieved through yield monitor data, remote sensing and crop models.
NSoil
The N provided by, or in some cases removed by, the soil is dynamic and often weather dependent. Kindred et al. (2014) documented the amount of N supplied by the soil varied spatially by 107, 67, and 54 lb/ac across three studies. Much of the soil N concentration is controlled by OM. For every 1% OM in the top 6 inches of the soil profile, there is approximately 1,000 lb N/ac.
efert
Historically, the efficiency at which N fertilizer is utilized was integrated into N recommendations and not provided as an input option, e.g., the general conversion factor for corn of 1.2 lb N/bu. Nitrogen concentration in corn grain ranges from 1.23–1.46% with an average of 1.31% (Heckman et al., 2003) or 0.73 lb N/bu. Therefore, the 1.2-lb value is assuming a 60% fertilizer use efficiency. More recently, recommendations have been to incorporate application method or timing factors in attempt to account for efficiencies.
Summary
While a VRN strategy that works across all regions, landscapes, and cropping systems has yet to be developed, the process of nitrogen management has greatly improved and is evolving almost daily. Those methods that are capable of determining the three inputs of the Stanford equation while incorporating regional specificity will capture the greatest level of accuracy and precision. Ferguson et al. (2002) suggested that improved recommendation algorithms may often need to be combined with methods (such as remote sensing) to detect crop N status at early, critical growth stages followed by carefully timed, spatially adjusted supplemental fertilization to achieve optimum N use efficiency. As information and data are gathered and incorporated and data-processing systems improve in both capacity and speed, the likelihood of significantly increasing nitrogen use efficiency for the benefit of the society and industry improves. The goal of all practitioners is to improve upon the efficiencies and economics of the system, and this should be kept in mind as new techniques and methods are evaluated. This improvement can be as small as a few percentages
This article is published in the Crops and Soils Magazine doi:10.2134/cs2016-49-0609. The full article includes more details on the components plus concepts of integration.
Agriculture Apps, 200 strong and growing
It was just 11 months ago when I wrote my last blog on Ag apps. Since that time I have presented on the topic several times, added nearly 100 new apps, have filmed several designated segment on sunup featuring apps (these can be seen at http://www.youtube.com/osunpk), and released two (soon to be three) apps myself. Below is the introductory slide I have been using in all of my app talks, on this slide you can see how the number of apps have been increasing overtime. In this update I wanted to share some of the new sections I have added to manage the vast number apps and go through some of my favorite apps in each of the sections.
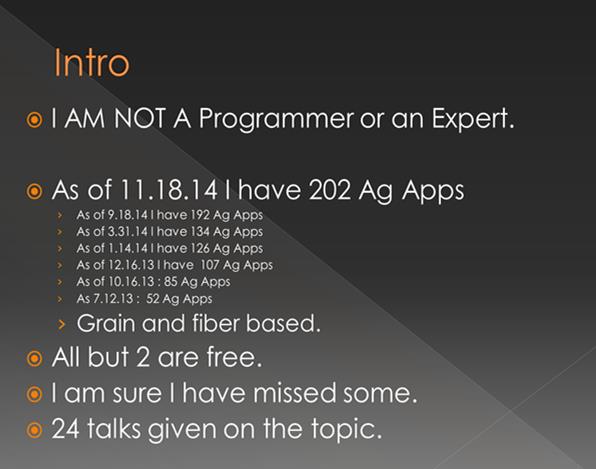
Finding the right app has not changed as I still just give an app 3 minutes before a keep or drop decision is made, however since a year ago some of the key words are now less useful. For example a search for wheat will bring up droves of gluten free diet apps. None of these fit the bill for what I am looking for. Though out the blog you can click on pictures screenshots to get a better view of the app buttons.
Ag News and Weather

Still a very large section with little change for my recommendations, just go with what suits you in layout and reporting. I personally use RonOnRON (Ron Hays, the voice of Oklahoma Agriculture), DTN/PF, AG/Web, and AgWired.
Ag Resources

This includes peer review publications, resource guides and extension materials.
Calculators

The majority of the Calculator apps preform relatively simple functions without the need of cellular or wifi connectivity. The Ag PhDs have two apps in the section I want to highlight, HarvestLoss and Fert. Removal. Both apps are useful tools in making management decisions. HarvestLoss allows the user to calculate the economic loss of a poorly set combine while Fert. Removal allows the user to select from a wide range of crops and see an exit ate of nutrient removal based upon selected yield level. Other useful apps are Growing Degree which allows the user to see cumulative heat units a crop has received anywhere in the US, Corn Yield Calc estimates corn yield based on ear girth and length, Canola Calc is a great apps produced by Pioneer which calculates the proper planting rate of canola based upon several factors and the Kansas Wheat Yield Calculator KWYC, uses growth stage stalk counts, height and/or NDVI to estimate potential grain yield.
Crop Tools

This section is filled with University Extension handbooks such as Purdue’s Field Guide ($12.99), University of Arkansas Corn Advisor, University of Kentucky Corn Production, and one private groups MFA Agronomy. Each of these guides are quality apps and should be chosen based upon geography or personal preference. The university apps mirror their respective hard copies however UK’s app added a nice update section highlighting local Ag news. MFA’s app is strong in pesticides with good herbicide performance data.
Fertilizer

For any producer who regularly applies animal waste the Manure Calc by the University of Nebraska is a great tool. The University of Wisconsin has a nice app in N Price Calculator and the Saskatchewan Soil Conservation association (SSCA) has created a nice fertilizer blend app. Oklahoma State University has Ammonia Loss Calculator which uses soil pH and environmental conditions to estimate N losses from surface applied urea.
OSUNPK

I am also getting into the app game with two recently released apps the Canola Starter and Field Guide. Canola Starter provides a recommendation for safe starter rates based on row width and fertilizer source. Field Guide is app version of my Nutrient Management Field Guide, this app includes a nutrient removal calculator, nutrient deficiency ID tool, and fertilizer rate calculators. Along with these I have several in the wings with titles like Crop Nutrients in Irrigation, GDDs>0, and Wildlife FoodPlot.
ID Tools

As mentioned in my first two blogs the University of Missouri’s IDWeeds app was the first taxonomy based weed identification tool. I still use it regularly but both BASF and Monsanto have brought products to the table, both named WeedID, that are very user friendly and effective. Plant Images ($5.00) is a library of nutrient deficiency photos from a large selection of crops. Years and Ag PhDs also have apps available with deficiency images named Yara Checkit and Crop Nutrient Deficiencies. Cereal Disease ID app by BASF is intended for the UK and DuPonts Pestbook for Australian cotton farmers but I find that both can be very useful even in Oklahoma.
Pay to Play, Registrations

I have heard several good things about many of these apps. However they reguire the user to either be an employee or patron of the company or online registration. In a pay to pay app I would expect an all inclusive tool that could replace several free apps and preform record keeping duties.
Records

To be honest this is not a section I use much as I do not have an operation to maintain records on. However just by walking through the apps Crop Calculator by the University of Wisconsin and Pesticide Recordkeeping (PeRK) by University of Nebraska.
Scouting/Mapping

This section has apps that I classify as decision aid tools that could be used by someone scouting crops and apps that can be used to map and or collect field notes. South Dakota State has two great tools in Soy Diseases and NPIPM Soybean Guide. Scout and Sirrus.
Seed Select

Company based, Pioneers app products are some of the best with Plantability and Estimator
Sprayer Chemical

Some things haven’t changed I still use Tank Mix Calc and Spray Select on a very regular basis. But over the past year a few companies have added product finders and Clemson University has released a very nice sprayer calibration app named Calibrate.
Weather

The last two apps are Mesonet and Climate Corp Basic. You will notice the background on the screen shot is slightly different. That is because neither of these apps is kept Ina folder, both are on my home screen. Whether it is rain, temp, or wind weather impacts all aspects of agriculture therefore these two apps are always within one tap. For any producer in Oklahoma the Mesonet is an amazing system with 120 automated weather stations spread evenly across the state. This app just provides this data with just a few swipes of the finger. For those outside of Ok Climate Basic allows producers to first save field of interest and then monitor rainfall and environmental conditions of each field. While not extremely accurate it is defiantly close enough for those with a wide territory to be a very handy app.
For more information and some screen shots of the apps in action either visit my website http://npk.okstate.edu/presentations or my YouTube site http://www.youtube.com/osunpk under the playlist OSU_NPK on Sunup.
Nutrient Products: Stabilizers, Enhancers, Safeners, Biologicals and so on.
In this blog I am not going to tell you what to use or what not to use. In fact I will not mention a single product name. What I will do is hopefully provide some food for thought, new knowledge and direction.
First I want to approach a topic I have been called out on several times. I believe there is a stigma that University researchers and extension specialists do not want products to work. It may seem that way at times but it is far from the truth. The reality is that all of us are scientists and know someone may be inventing the product that changes nutrient management as we speak. The issue is that most of us have been jaded. While I may be younger I have over 11 years experience, testing “products” in the field, and that includes dozens of products. I have sprayed, spread, tossed, drilled, mixed and applied everything under the sun, with hopes that I will see that one thing I am always looking for, MORE GRAIN…
The truth is Everything works Sometimes yet Nothing works ALL the time. I and others in my profession do not expect anything to work 100% of the time, I am personally looking for something that will provide a checkmark in the win column 50% of the time. A win is the result of one of two things, more money in the producers pocket or less nutrients in the water or air. Products can increase vigor, nutrient uptake, chlorophyll concentration, greenness but not yield. What Co-op or elevator pays for any of those attributes? Grain makes green.


So many safeners, stabilizers, enhancers, biologicals, and on and on are available, so what should a producer do? Here are few things to think about. Ask yourself “ what part of my nutrient management plan can I get the most bang from improving”?
If the answer is Nitrogen (N) there are three basic categories: Urease inhibition, Nitrification inhibitor, and slow release. All are methods of preventing loss; the last two are preventing loss from water movement.
Urease inhibitors prevent the conversion of Urea to NH3 (ammonia). This conversion is typically a good thing, unless it happens out in the open. Ideally any urea containing product is incorporated with tillage or rain. However, in No-till when urea is broadcast and no significant rainfall events (>0.5”) occur, N loss is likely. The urea prill starts dissolving in the presence of moisture, this can be a light rain or dew, and urease starts converting urea into NH3. As the system dries and the day warms, if there was not enough moisture to move the NH3 into the soil the wind will drive NH3 into the atmosphere. Nitrogen loss via this pathway can range from 5% to 40% of the total N applied.
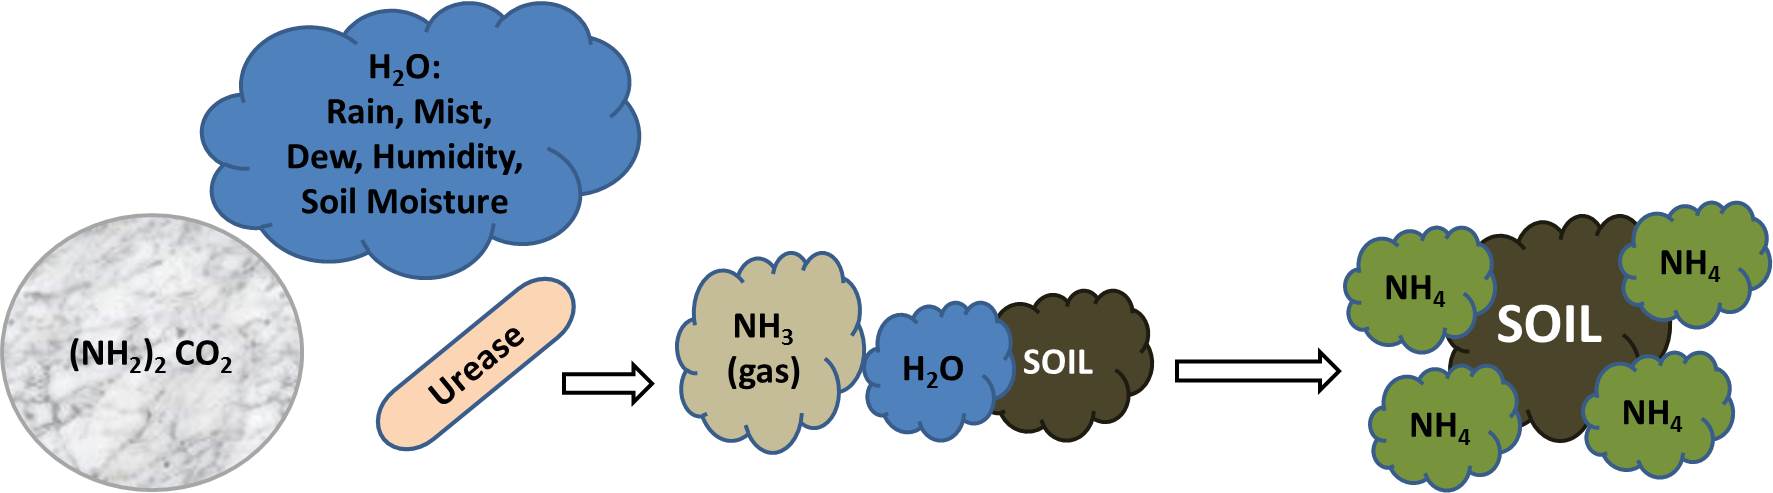
Graphic of Urea’s conversion to plant available ammonium.

Urea placed on a wet soil under two different temperatures. Number in white is hours after application.
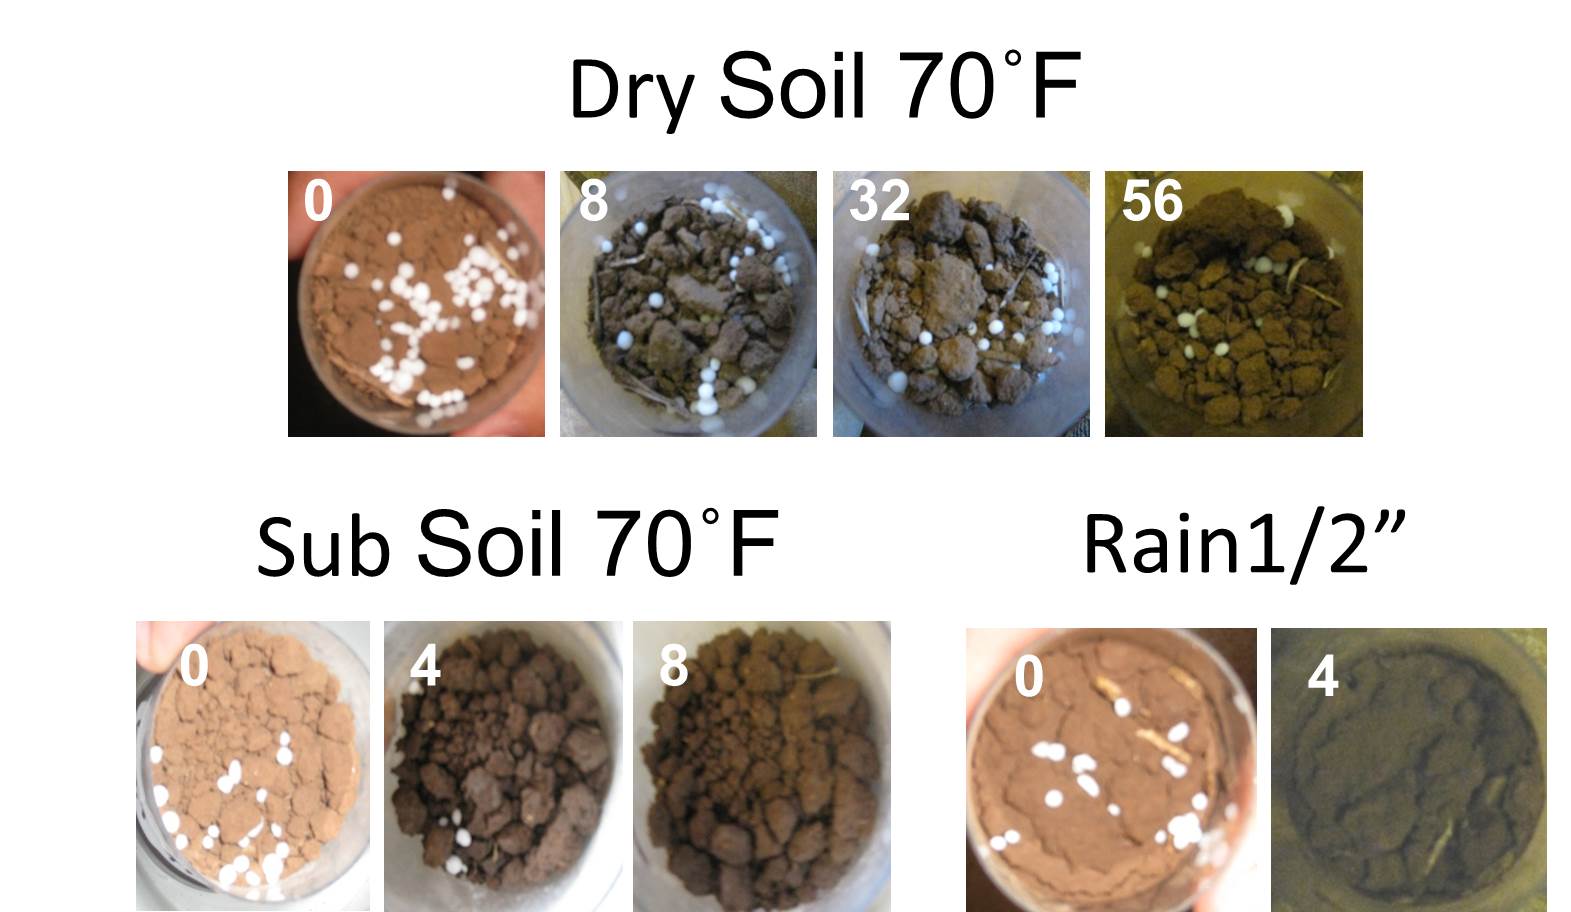
Urea placed on a dry soil, on top no water added, bottom left is moisture from the subsurface, and bottom right is simulated rain fall of 1/2″. Number in white is hours after application.
Nitrification inhibitors prevent the conversion of NH4 into NO3. Both are plant available N sources but NH4 is a positively charged compound that will form a bound with the negatively charged soil particles. Nitrate (NO3) is negatively charged and will flow with the water, in corn country that tends to be right down the tile drainage. Nitrate will also be converted to gasses under wet water logged soil conditions. Nitrate is lost in the presence of water, this means I do not typically recommend nitrification inhibitors for western OK, KS, TX dryland wheat producers.
Slow release N (SRN) comes in a range of forms: coated, long chain polymer, organic and many versions in each category. Again, water is the reason for the use of SRN sources. Slow release N whether coated or other have specific release patterns which are controlled by moisture, temperature and sometimes microbes. The release patterns of SRNS are not the same and may not work across crops and landscapes. For instance in Oklahoma the uptake pattern of nutrients for dryland corn in the North East is not that same as irrigated corn in the West. The little nuances in the growth pattern of a crop can make or break your SRN.
While N products have been on the market for decade’s phosphorus enhancers and stabilizers are relatively new, resulting in many of my peers holding back on providing recommendations until field trials could be conducted. At this point many of us do have a better understanding of what’s available and are able to provide our regional recommendations. Phosphorus products are not sold to prevent loss like their N counterparts; they are sold to make the applied P more available. On a scale of 1 to 10, P reactivity with other elements in the soil is a 9.9. If there is available Ca, Mg, Fe, or Al, phosphorus is reacting with it. In the southern Great Plains it is not uncommon for a soil to have 3,000-5,000 lbs of available Ca, a soil with a pH of 4, yes we have many of those, will have approximately 64,000 lbs of Al in the soil solution. That’s a lot of competition for your fertilizer P and for any substance that is trying to protect it.
I have been testing “biologicals” of all shapes and forms since 2003. While I have not hit any homeruns I have learned quite a bit. Many of these products originate from up north where the weather is kind and organic matter (OM) is high. Where I work the average OM is 0.75% and soil temp is brutal and unforgiving. Our soil does not have many reserves to release nor is it hospitable to foreign bodies.

Soil temperature for Stillwater OK under sod and bare soil conditions. Graph from http://www.Mesonet.org.
I hope you are still hanging on as this next topic is a bit of a soap box for me. Rate, Rate, Rate this aspect is missed both by producers and academia and it drives me crazy. If your crop is sufficient in any growth factor adding more will not increase yield. It goes back to Von Liebig’s LAW of the Minimum. I see too many research studies in which products are tested at optimum fertilization levels. This is just not a fair comparison. On the other hand, time and again I see producers sold on a product because they applied 30% less N or P and cut the same yield. If you let me hand pick 100 farms in Oklahoma I could reduce the N rate by 30% of the average and not lose a bushel on 75 of the farms. Why? Because the rate being used was above optimum in the first place, there is no magic just good agronomy. The list of products that increase the availability of nutrients is a mile long. Increasing nutrient availability is all well and good if you have a deficiency of one of those nutrients. If you don’t, well you have increased the availability of something you did not need in the first place.
University researchers and extension professionals seem to live and die by the statistics, and are told so regularly. We do rely upon the significant differences, LSD’s, and etc to help us understand the likely hood of a treatment causing an effect. However if I see a trend develop, or not develop, over time and landscape regardless of stats I will have no problem making recommendations. The stats help me when I do not have enough information (replications).
Too wrap up, have a goal. Do not just buy a product because of advertised promises or because a friend sells it. There is a right time and place for most of the things out there, but you need to know what that is and if it suits your needs. I also recommend turning to your local Extension office. We do our best to provide unbiased information in hopes of making your operation as sustainable as possible. If you are looking at making sizable investments do some reading, more than just Google. Testimonies are great but should but should not be enough to cut a check. Google Scholar www.google.com/scholar is a good resource for scientific pubs. I have done my best to put together a list of peer reviewed publications and their outcomes. To make the review work I had to be very general about outcome of the research. Either the product increased yield or decreased environmental losses or it had no impact. This was not easy as many of the papers summarize multiple studies. I did my best to make an unbiased recommendation but some could be argued. http://npk.okstate.edu/Trials/products/Product_Peer_Review.8-21-2014.pdf
