
How long can wheat wait for Nitrogen? One more year of data.
Update to the delayed nitrogen study.
Joao Bigatao Souza, PhD. Student Precision Nutrient Management|
Brian Arnall Precision Nutrient Management Extension Specialist.
Due to the surprising results seen from the delayed N study that was first reported below we repeated the the study for a third year at two locations, the Lake Carl Blackwell Research farm near Perry OK and the Ballagh Research Farm near Newkirk OK. Due to the excessive rain fall the wheat was planted and trials established later than normal and a cool winter and spring and winter the crop green up (end of dormancy) was delayed compared with the two first cropping seasons. For this season we started applications before visual symptom difference between the N-rich Strip (pre-plant) and the rest of the field actually occurred. This can be seen with the pre-plant dates of late Oct-Early Nov and the notation of visual difference above the yield bars. Just as the other two previously crop years, the timing of the application did impact wheat yield and protein. In this season at LCB we see a increase in yield with application of N during the first part of March compared to the preplant with yields dropping off below the preplant when N was applied in mid April. At the Ballagh farm there is no yield benefit from delaying N after preplant but there was steady increase in protein, again at this location yield is lost when N was delayed past mid April. In both of these locations mid April was after the growth stage of Feekes 7. After three cropping seasons with some extremely different weather patterns we saw that in this work, pre-plant N was never better than in-season N applied prior to mid April, Feekes 7. In most cases N applied in-season yields and protein values were greater than that of the pre-plant treatment. My take home message from this project is multi fold; First, pre-plant may be cheaper and easier but it often falls short of in-season applications, Second that there should be no reason to rush putting top-dress nitrogen on. The application window is much wider than most ever expected and the closer we get to peak demand the better the yield and quality will likely be. And third, and final make the application of nitrogen when the conditions are the most conducive to getting the N in the ground and limiting losses.
Note: This trial used ammonium nitrate as its N source to evaluate the plants response and remove potential fertilizer efficiency problems. However while these trials were being conducted mirror studies using Urea as the N source were also being conducted. Those results are currently being compiled right now and we hope to share the results soon.

Grain yield and protein results from the delayed nitrogen study preformed at the Lake Carl Blackwell near Perry in 2018-2019. 11/7/2018 was the pre-plant application date.

Grain yield and protein results from the delayed nitrogen study preformed at the Ballagh research farm near Newkirk in 2018-2019. 10/24/2018 was the pre-plant application date.
Questions for comments feel free to contact me via email at b.arnall@okstate.edu
Original Post made Oct 1, 2018
How long can wheat wait for Nitrogen?
Joao Bigatao Souza, PhD. Student Precision Nutrient Management|
Brian Arnall Precision Nutrient Management Extension Specialist.
The N-rich strip method allows wheat producers a greater window of decision making regarding the application of nitrogen (N) fertilizers. Besides having greater accuracy in N rates than standard methods (based on the SBNRC – OSU) also helps to reduce costs in the production system and to preserve the environment avoiding over N applications.
With the experiments performed in the last two crop seasons (2016/18 and 2017/18), we can now be even more accurate with regard to the best application time to increase the N use efficiency by the crop. The objective of our study was to determine the impact of prolonged nitrogen deficiency on winter wheat grain yield and protein. Eight studies were conducted with 11 N application timings in no-till dryland conditions. A pre-plant treatment of 90 lbs ac-1 of N was broadcast applied as ammonium nitrate (AN). We used AN as our source because we wanted to measure the crops ability to recover and eliminate the impact of source efficiencies. When visual symptom differentiation (VSD) was documented between the pre-plant and the non-fertilized check, i.e the N-Rich Strip showed up, top-dress applications were performed every seven growth days (GDD> 0) (https://www.mesonet.org/index.php) until 63 growth days after VSD at all sites. The only N the treatments received where applied according to treatment structure. No preplant N was applied other than trt 1, and all locations had residual N under 15 lbs 0-6” sample.
The first visual response to fertilizer N ranged from November 11 to February 5 (Table 1). The soil can have residual N from the previous season which can supply the subsequent crop in the beginning of the development what makes the wheat not demonstrate any sign of stress in the early season. For example LCB2017 a and b which were located 100 yards apart but under a different point in the crop rotation (LCBa was wheat after wheat and LCBb wheat after canola) had a 30 day difference in date of first N response. This range in first and last dates allowed us to evaluate N application over a wide range of dates and determine whether the first sign of stress is actually the best indicator of top dress application timing.
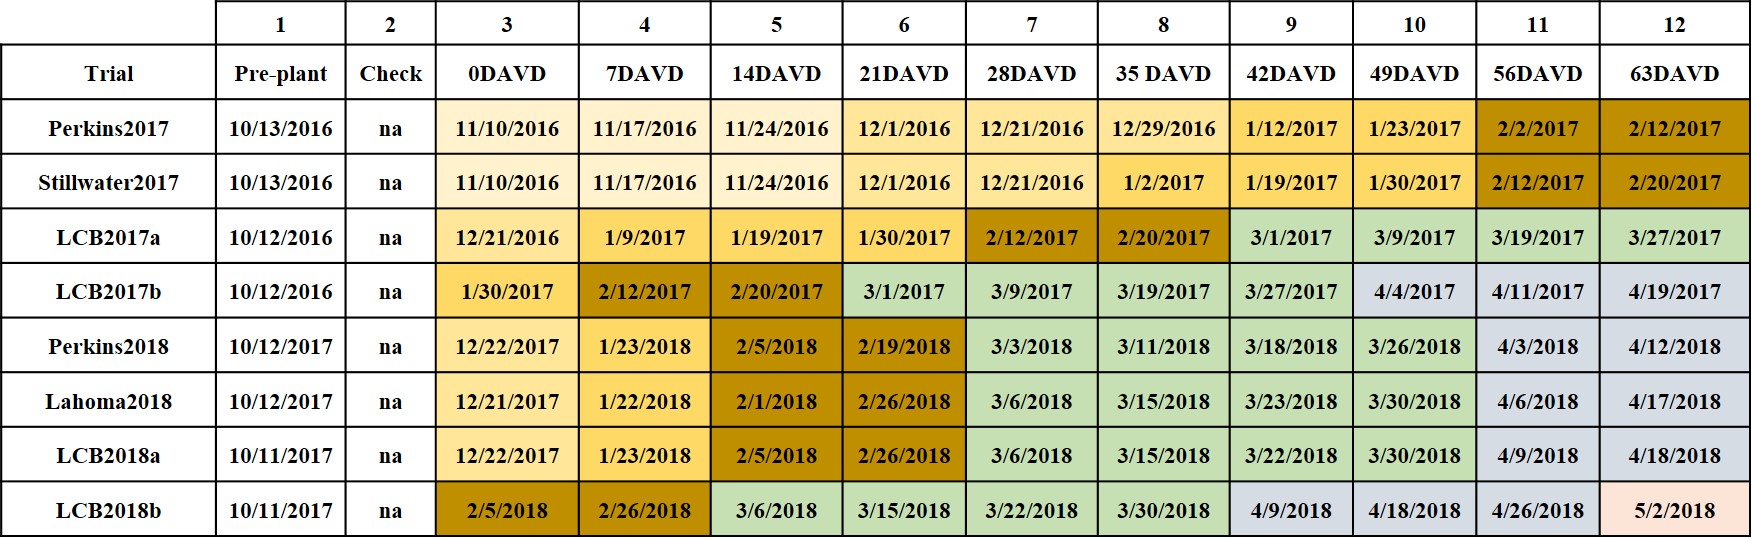
Table 1 shows the planting date, date of first visual difference (0DAVD) and each of the application dates for all locations. Different colors represent individual months. Hollow stem occurred approximately Feb 20 in the 2017 crop and March 10th in the 18 crop.

Image of the 2016-17 Perkins location. Image collected March 21 2017.
As shown in the Tables 2 and 3 below only three of the 78 comparisons made back to the pre-plant application were significantly less in terms of grain yield. All three of these comparisons where from when N application was delayed until late March or April. When the delayed applications were compared to 0DAVD yields only two of the 68 comparisons showed a significant decrease on yield. One was the pre-plant application for LCB2017a while the other were the 63DAVD application for LCB2017b. In most locations applications made in March yields were at the highest point, however when delayed till April yield trends on the downward trend. The 2017 crop reached hollow stem (Feekes 6) around Feb 20th while the 2018 crop reached hollow stem around March 10th.
Grain protein concentration was decreased only once when compared to both the pre-plant and 0DAVD treatments. This one timing, LCB2018b 64DAVD, was the only application made in May. During this time the crop was in the early stages of grain-fill. In all locations delaying N application until February/March increased grain protein content above the check, and in most cases above the 0DAVD trt.

Tables 2-3 shows the winter wheat grain yield and protein concentration, respectively, of all treatments. The colors of the cells represent statistical difference from the Pre-plant treatment. Treatments with cells shaded yellow are equal to the pre-plant, Green is statistically greater than while red is statistically less than the pre-plant treatment.

2016-2017 Delayed nitrogen winter wheat grain yield and protein results. For the locations of Perkins and N40 the Dec-1 application has a higher yield due to a 2x application of N to equal 180 lbs.

2017-2018 Delayed nitrogen winter wheat grain yield and protein results. The Perkins location in 18 was the only location in the study which did not have a statistically significant response to added N.
All the data was combined and plotted by cumulative GDD’s>0 from planting (GDDFP) across all locations to determine a general “best” timing. Using the pre-plant application yield as a base there was no yield loss if the applications was made prior to the 143 GDDFP. When the results were normalized by 0DAVD N there was no yield loss if the applications were made prior to 130 GDDFP. The quadratic model created provides the opportunity to identify the point of highest grain yield, which was approximately 94 GDDFP. In terms of the relationship between the application of N based on GDDFP and % of protein content on the grain, a linear response of N delay application observed for grain protein concentration. Our results suggest that the later the application, the higher the protein % in the grains.

Growing degree days > 0 from planting and equivalent calendar days for all experimental sites (Lake Carl Blackwell, Perkins, Lahoma, Stillwater) utilized in the study evaluating the impact nitrogen fertilizer timing on winter wheat, conducted in north central Oklahoma over the 2016-2017 and 2017-2018 winter wheat growing seasons.
We have concurrent work looking at similar approaches with other sources of N such as Urea and UAN. While all of these studies are being continued the past two years of work have presented some easy take homes.
First: Timing of N application does matter, but yellow wheat does not necessarily mean yield loss.
Second: Two years in a row ALL Nitrogen could be delayed until hollow stem without yield Loss, in fact yields of trts with N applied at this time typically better than that of the pre-plant.
Third: Protein content increased as N applications was delayed.
Fourth: The conclusions of this and other studies support that N-Rich Strip concept does not increase risk of lost yield.
Fifth: Applying the majority of the N at or just after hollow stem maximized grain yield and protein with a single shot.
Sixth and Final: Be more concerned about applying N in an environment conducive to increased utilization and less about applying at the first sign of N stress. Take a look at the wheat N uptake curve by K-State.The crop really doesnt get going in terms of N-uptake until jointing i.e. hollow Stem.

Wheat N-uptake. Figure adapted from Lollato et al.
Questions for comments feel free to contact me via email at b.arnall@okstate.edu
Double Crop Response to Additional N, P, K and S.
Vaughn Reed, PhD. Student Precision Nutrient Management
Brain Arnall Precision Nutrient Management Extension Specialist.
Data presented below are the results of Mr. Reeds Masters research project.
On farm research trials are important, because they give us the ability to see responses over a larger geographic area, and even more importantly, evaluate our recommendations on fields that are managed by producers, not researchers. They also allow us to look at current production practices and see if there are any missed opportunities. Several years ago, we looked at whether producers were leaving yield on the table by not applying enough nitrogen (N), phosphorus (P), potassium(K), and sulfur (S) to winter wheat. We did this by applying strips of N, P, K, and S fertilizer on farmers’ fields with the instructions to not change their fertilizer management strategies. If one or more of the strips resulted in higher yields then it could be assumed that either the nutrient was under-applied by the producer, or in the case of N, lost. That study concluded that at 75% of the locations, yield was maximized by the producer with [their respective] NPKS management system, however the greatest responses came from the addition of P and that Oklahoma State University’s soil testing and analysis was adequate for nutrient recommendations. That studies results were published in 2017 and is open access, so available for anyone to read. https://dl.sciencesocieties.org/publications/cftm/abstracts/3/1/cftm2017.02.0014

Locations of double crop fertility response strips applied in the summers of 2016 and 2017.
There are many producers around the state that follow winter wheat with double crops (DC). Often, this practice is done with limited inputs to reduce economic risk. Oklahoma State does not make different recommendations for DC or full season crops, with the exception that yield potentials can differ. In 2016 and 2017 we duplicated the Wheat NPKS study across 3 double crops (soybean, grain sorghum, sunflower) following winter wheat and canola. With a recent climb in DC yields we wanted to investigate if producers were applying enough nutrients to maximize grain yield. Additionally it would allow us evaluate the accuracy of OSU’s soil test based fertilizer recommendations in a double crop. Over the two years, 61 on-farm sites ranging from central to NE Oklahoma had 200 lb/ac of product per nutrient applied in strips 6ft wide by 150 ft long. Urea (46-0-0), triple super phosphate (0-46-0), muriate of potash (0-0-60), and gypsum (0-0-0-19) were used for sources N, P, K, and S, respectively (92 lbs N, 92 lbs P, 120 lbs K, 38 lbs S). In most cases the fertilizer was applied post planting and post-emergence to ensure strips were applied an areas with good stand.
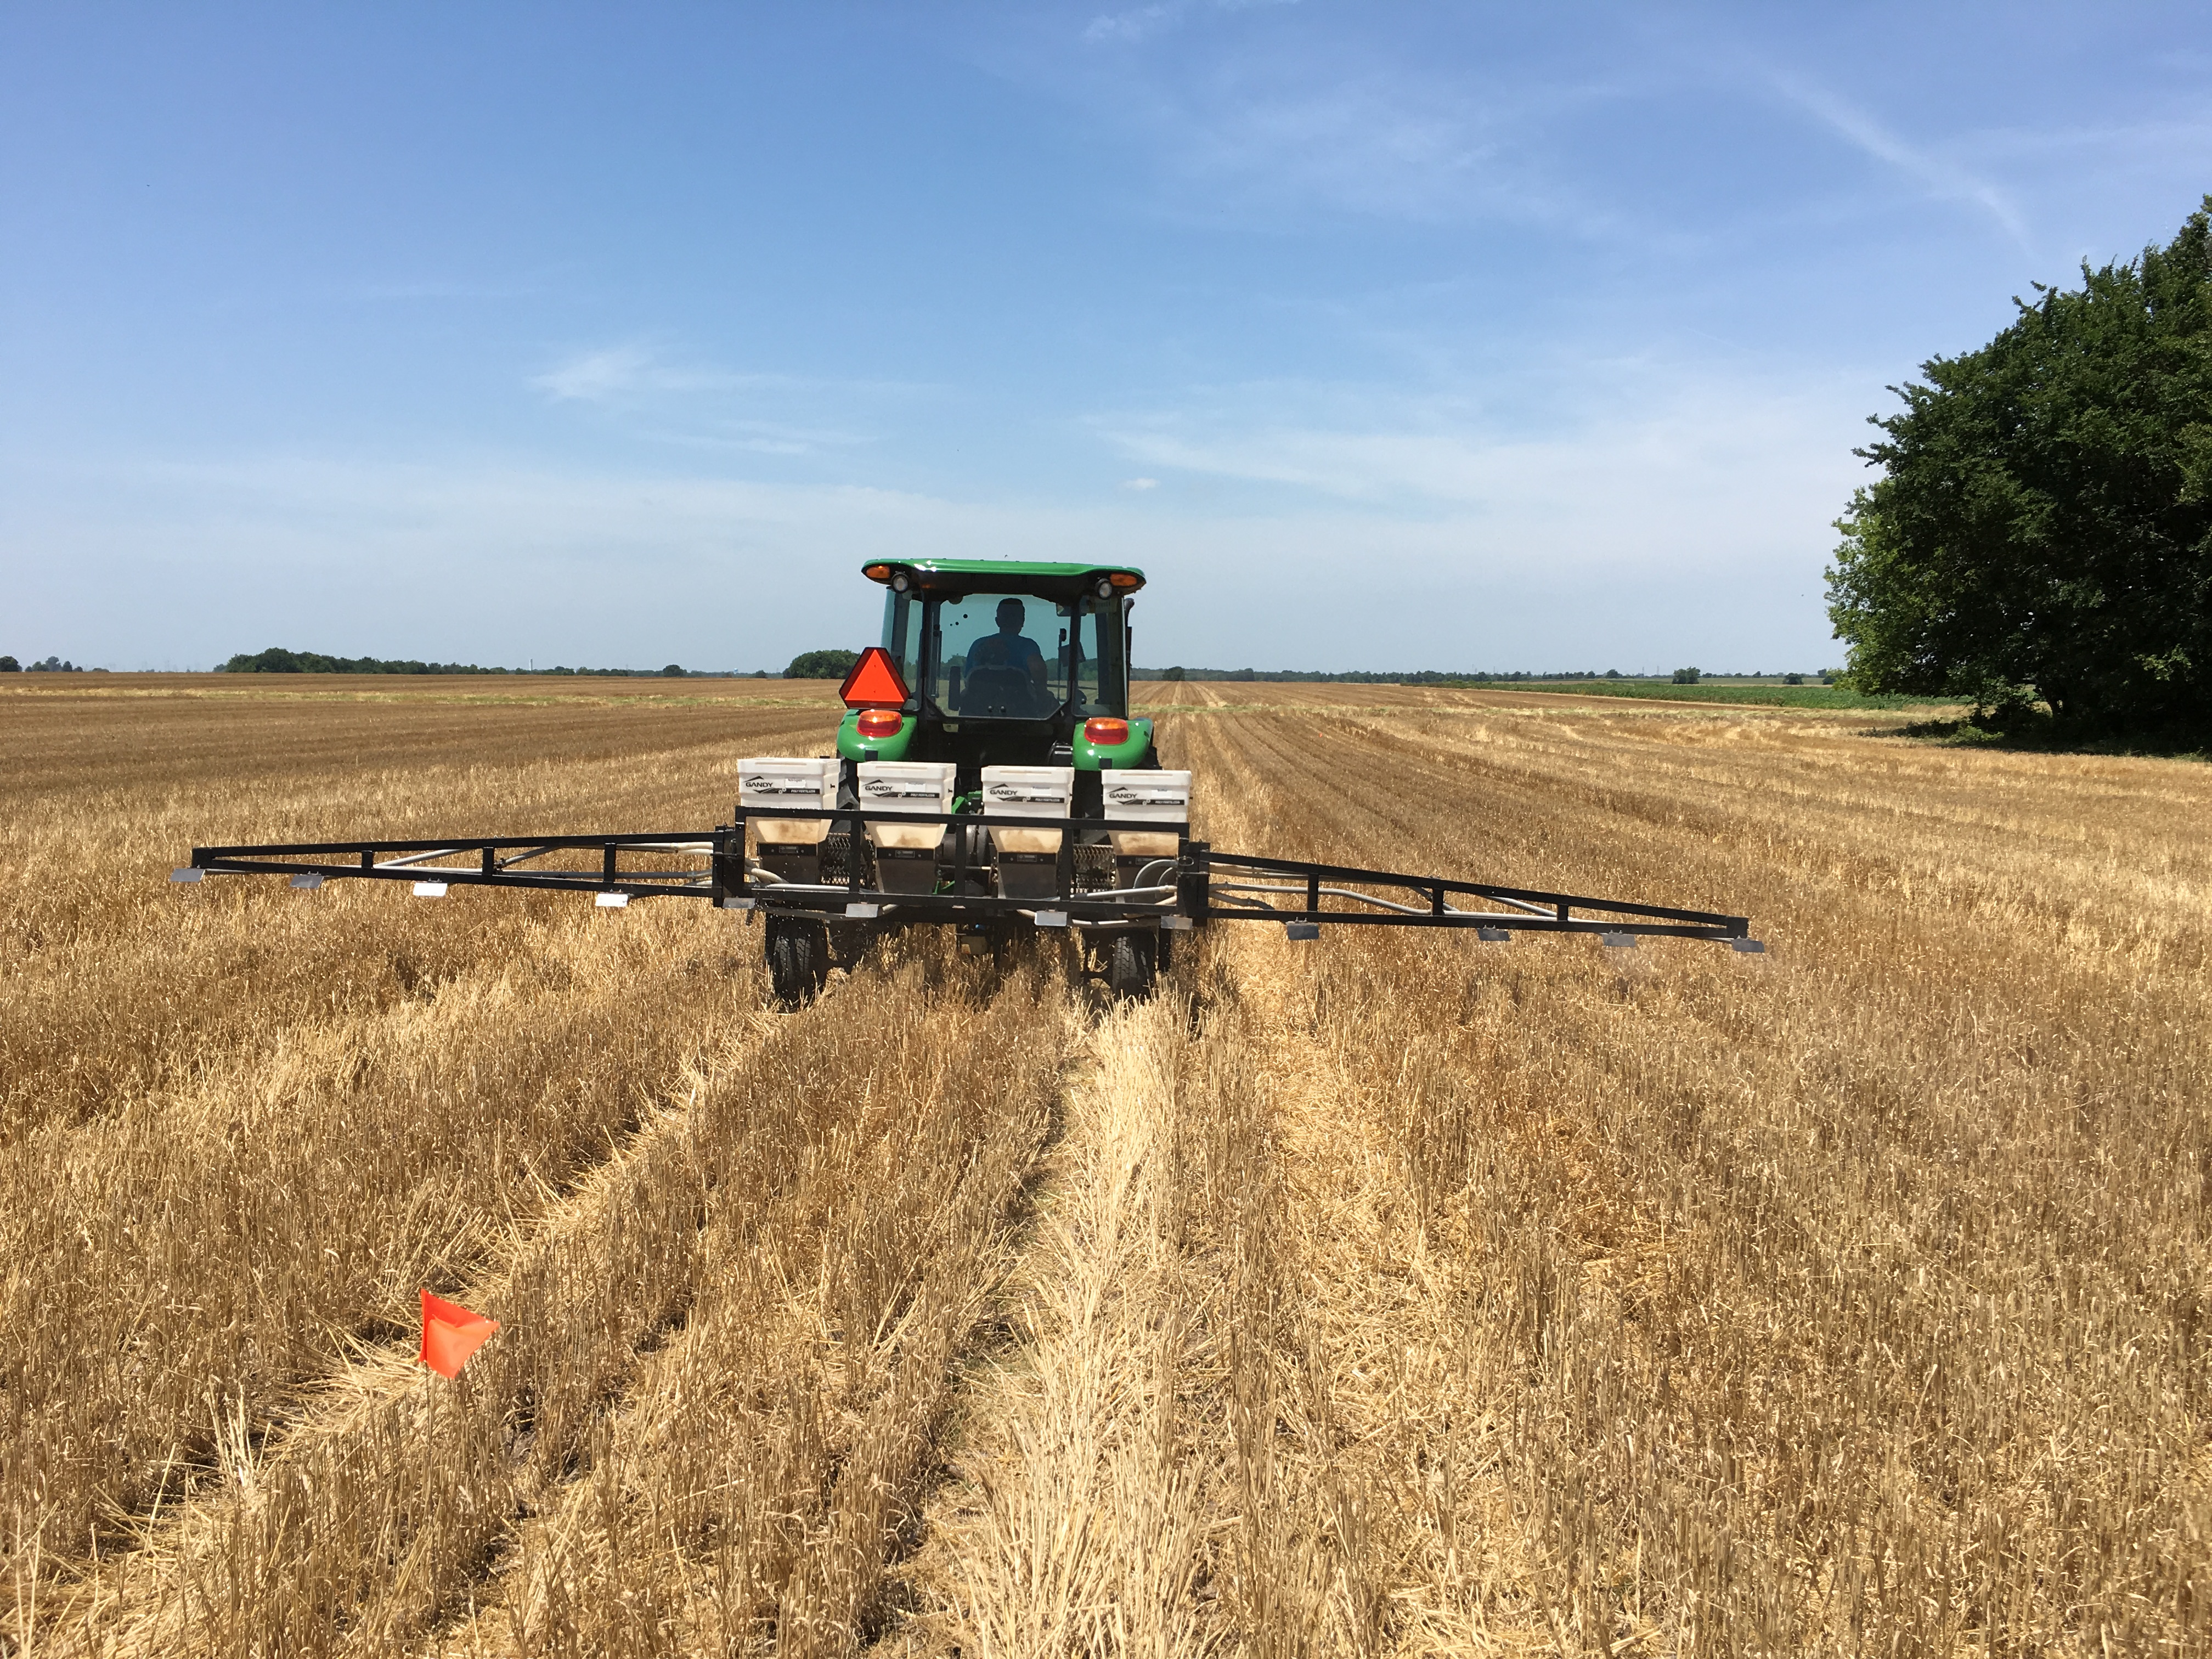
NPKS Strip Applicator. This ground driven 3pt rig uses Gandy boxes to deliver fertilizer into tubes which is then blown, by a PTO driven fan, out into strips 6 feet wide, per box. This applicator was putting out 200 lbs of Urea, 0-46-0, potash, and gypsum out per acre.
Much like with the wheat-NPKS study 75% of the locations did not respond to additional fertilizer. Twenty treatment comparisons of the 244 made across all 61 locations (50 soybean, 7 grain sorghum, 4 sunflower) yielded a statistically significant change in yield due to the addition of N-P-K-or S. For this report, a comparison was the yield of each nutrient versus the non-treated check, therefore there were four comparisons made per location. Seventeen of the twenty positive responses were found in soybean, three with grain sorghum, and no responses were found in sunflower plots. Lack of response from grain sorghum and sunflower locations is contributed to small amount of grain sorghum and sunflower fields in the study.
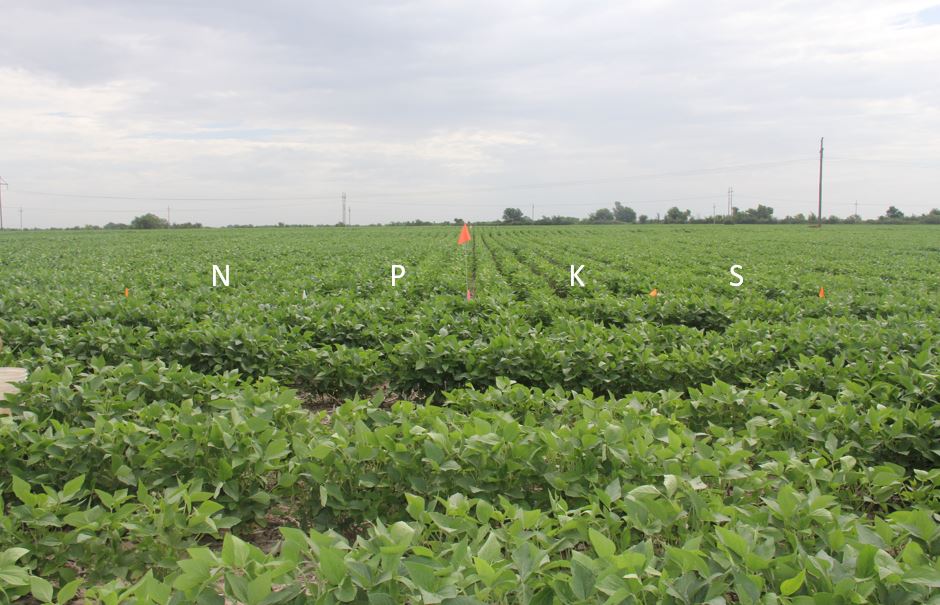
Double crop soybeans in Ottawa County with strips of nitrogen, phosphorus, potassium, and sulfur applied post plant.
Nitrogen rates, for non-legumous crops, are yield driven, meaning the higher yielding a crop, the higher amount of N required. Both grain sorghum and sunflower crops, due to neither being legumes, were expected to see N response, especially to those locations that applied little to no N to begin with. A yield response from the addition of N was found in one grain sorghum location, where the producer application was not enough to maximize yield, and the additional N pushed the yields. As expected, there were no soybean locations that responded to the addition of N.
Phosphorus and potassium are both sufficiency based, not yield driven. This means that if the soil is at 100% sufficiency, the crop will produce at its highest rate achievable, based on that nutrient. 100% sufficiency for P and K are approximately 65 STP and 250 STK, respectively. Phosphorus and potassium strips yielded the most results, especially in soybean locations. Of 20 responses, five responses were due to P, ten due to K, and four due to S. Locations that responded to the addition to P were locations that either had low levels of STP (approx. 80% sufficiency or less), or had low pH, which leads to less availability of P (pH>5.0).
Potassium yielded the most positive results, with ten responsive locations, as well as the most interesting results, with only three sites falling below 100% sufficiency. The other responses were attributed to having low Cl levels (Cl, as in Chloride, which while responses are rare, is a necessary nutrient, and sometimes can lead to losses in yield, especially in sandy environments), as well as drought stress conditions. Potassium has been shown to have a vital role in nutrient uptake and water retention, as it is found to be critical for root growth, and these are displayed highest in crops found in drought like conditions. One hypothesis for the K response is related to root growth. The later planted DC will spend less resources in root development before going reproductive. Soybean is a heavy user of K, combine smaller roots, typically hot drier soils, and high K demand it is not surprising to find this occurrence.
Sulfur, while not wide-spread reported in Oklahoma, has recommendations by OSU built on a yield driven scale. There were four responsive locations found in this project. While one location had low soil test S values there were located areas that received high rainfall events during the growing season, and therefore the response was attributed to leaching of S.
So, after all that, what is the bottom line? Here is our observations:
- Producers maximized yield 75% of the time, with 25% of locations responding to any additional nutrient.
- The 20 responses to additional nutrients occurred across 15 locations, four locations had responses to more than one nutrient
- By nutrient: Note for P and K, due to site variability it was not expected to observe statistic yield increase due to P or K unless soil test was below 70% sufficiency, of which no location had soil test P or K below 70%.
- 38 locations were below 100% sufficiency of phosphorus, with five observed responses
- Seven locations were below 100% sufficiency of potassium, two observed responses. An additional eight locations responded that were not predicted by soil test
- Based on pre-plant soil test there were no sites expected to respond to the addition of Sulfur, 4 locations did respond.
- Soil test results were adequate in correctly identifying locations that would not respond to the addition of nutrients (93.5% accurate), while not as accurate at predicting sites that would respond.
- For K, soil testing was less accurate, as eight of the ten responsive locations had soil test values above 250 soil test K (125 ppm or 100% sufficiency). For this reason, we are currently doing work evaluating K recommendations for soybeans.
This work confirms that of the fields we evaluated, the majority was not yield limited by N, P, K or S. However, as with anything, we have more work to do in order to further refine our recommendations, and always looking to learn more about how to aid producers.
Recent Weather Causing Corn (and Sorghum) Injury From Pre-emerge Herbicides
With the brief window of dry ground last week my crew went at full speed planting and applying pre-emergence. Today I am sitting at home with campus closed due to the potential to severe weather with a forecast of 4-6 inches of rain for the areas I planted. Combine the recent planting activities and limited windows for pre-emergence applications, I will not be surprised if we don’t start seeing injury in some of the sorghum that was just planted before the rains. I would also add the over the years I often see bleaching in sorghum, that looks similar to zinc and/or iron deficiency, caused by atrazine injury. This typically occurs when atrazine is applied prior to a heavy rain. The atrazine is washed down slope and into the rows, the injury is almost always seen in low lying areas. The crop usually grows out of it.

Atrazine injury in sorghum. Heavy rains followed application. Pic via Rick Kochenower.
Brian A.
This article is written by Mr. Cody Daft, Field Agronomist Western Business Unit, Pioneer Hi-Bred
Have you noticed any corn leafing out underground prior to emergence? Have you seen tightly rolled leaves or plants that can’t seem to unfurl leaves and look buggy whipped? Almost all of the fields I have looked at recently have shown these symptoms in at least a portion of the field, and some fields this has been very widespread. The common denominator in all the fields I have viewed has been the herbicides applied were a metolachlor (Dual/Cinch type products) and the weather (cooler than normal, wetter than normal). Similar issues can be noted in grain sorghum to some extent.
The recent wet weather and water-logged soils have increased the possibility of corn injury from many popular soil applied herbicides. Corn growing in wet soils is not able to metabolize (degrade) herbicides as rapidly as corn growing in drier conditions. Plant absorption of herbicides occurs by diffusion. What this means is that the herbicide diffuses from locations of high concentration (application site on the soil) to low concentration (plant roots). The diffusion process continues regardless of how rapidly the corn is growing. In corn that is not growing rapidly (cool, wet conditions) corn plants can take up doses of herbicide high enough to show damage and a few differences in symptomology.
The unfortunate aspect of wet soil conditions is that additional stress is put on the plant not only to metabolize herbicide residues, but also to ward off diseases and insects. These additional stresses can impact a corn plant’s ability to metabolize herbicide.
The most common type of herbicide injury observed under these conditions is associated with chloroacetamide herbicides. These herbicides are used for control of grass and small seeded broadleaf weeds, and are seedling root and shoot inhibitors.
These products include the soil-applied grass herbicides such as:
- Dual/Cinch/Medal II
- Degree/Harness
- Microtech/Lasso
- Frontier/Outlook
- Define/Axiom
- And other atrazine premixes like Lumax (a premix of mesotrione (Callisto), s-metolachlor (Dual II Magnum), atrazine and a safener benoxacor).
What About The Injury Symptoms?
Before corn emergence:
- Stunting of shoots that result in abnormal seedlings that do not emerge from soil.
- Corkscrewing symptoms similar to cold/chilling injury.
- Corn plants and grassy weeds may leaf out underground and leaves may not properly unfurl.
After corn emergence:
- Buggy whipping – leaves may not unfurl properly.

Figure . Buggy-whipping symptom from carryover of PPO herbicides to corn.via https://www.pioneer.com/home/site/us/agronomy/library/herbicide-carryover/
What About Safeners?
Products like DUAL II Magnum herbicide contain the safener benoxacor which has been shown to enhance S- Metolachlor metabolism in corn. This enhanced metabolism can reduce the potential of S- Metolachlor injury to corn seedlings when grown under unfavorable weather conditions such as cool temperature or water stress. However, a safener is not the silver bullet, and slow plant growth may still have trouble metabolizing the herbicide even with a safener…but it does help the severity of damage/symptoms.
Will The Plants Recover?
Plants that have leafed out underground or show corkscrewed mesocotyl symptoms are likely to not recover or even emerge from below the soil. Larger plants that are already emerged that show tightly rolled leaves and are buggy whipped will most likely recover once the field sees drier conditions and we have warm weather and sun light to assist in better plant growth.
More Information Discussing Corn Injury From Pre-emerge Herbicides Here:
Cody Daft
Pioneer Hi-Bred
cody.daft@pioneer.com
The Pick 2 Dilemma of Nitrogen Management
If you read my blog very often you know I spend a lot of my time talking about and thinking about nitrogen (N) management. And a great aspect of a blog is the ability to share ideas and theories, and this idea has been rattling around for awhile. What follows is not my recommendation for how to manage N but my assessment of challenge that comes with adopting a new N management strategy.
My wife, years ago, introduced me to the Pick 2 concept also known as the triple constraint theory of project management. I have thought of it and used it often when I am trying to get a project completed. This concept suggest that if you are able to get something of high quality, and have it done quickly but you will have to pay for it, aka it will not be cheap. While you can get something produced cheap and quickly, but it will not be of quality. And of course you may be able to get something of quality produced cheaply, however it will not be done quickly.

Some time back, while contemplating my reply to a tweet about N management by Dr. Josh McGrath @NPK_Professor, it hit me that it was quite similar to triple constraint theory. I have been researching and speaking on improved N management strategies for a decade now. While I have seen some change in practice and improved efficiencies, overall movement is slow. I have for awhile known the challenge I was up against but never able to communicate it well. I believe that at least in concept the 2 Pick diagram begins to make the point.
Lets talk the 3 components
EFFICIENCY:
Almost theoretical in concept itself. My definition of efficiency is being as close a zero net addition of N as possible. The goal being if we add 150 pounds of N as fertilizer we remove 150 pounds of N in grain, feed, or fiber. In other words 1 lb in and 1 lb out. My blog Nitrogen Management Report Card takes a look at nitrogen use efficiency.
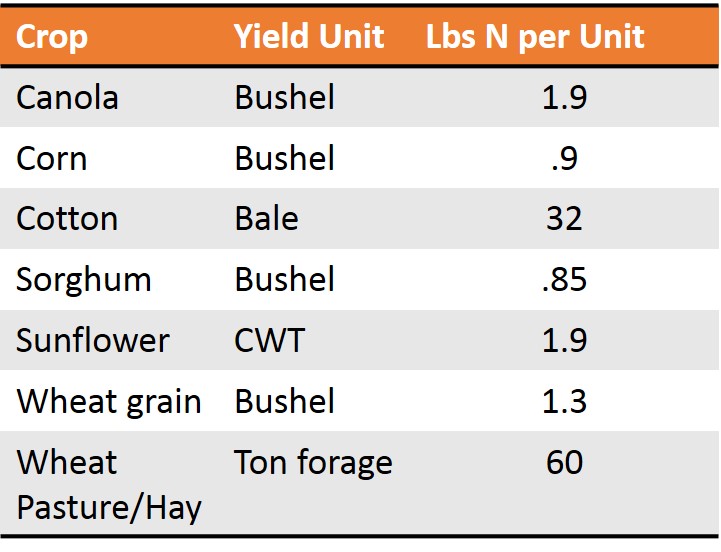
Pounds of nitrogen removed per one unit of yield harvested. These values are generalized averages and can change based on environment, management, and cultivar.
Economic
This one is not too hard to explain. The strategy has to be economically viable. You can go even further and say that the new N management approach should produce an economic return that is equal to or better than the currently implemented strategy.
Low Risk
The third component is the one that is more challenging to quantify, and in my opinion one of the greatest drivers in N management adoption. Risk, you know all the of the What Ifs. I can not think of a time when I gave a talk on increasing N use efficiency when I did not have at least one producer approach me with a What If question/statement. What if its to wet, what if its too dry, what if I lose to much, what if I under apply? The what ifs outline those things a producer or agronomist see as potential risk. I use the words perceived or real not to say the concerns are unfounded, shoot in Ag we all know not only can everything go wrong but at some point it probably will. Its that sometimes the level of concern may be greater than the actual risk. And to be honest N has been one of the few things producers could manage to reduce risk, i.e. loss of yield. What I mean is a producer can not control the weather or market but they could make darn sure they had enough nitrogen in the ground to produce every pound possible.

Pick two Nitrogen Dilemma. The three options you much choose two from are Efficiency; how much of the applied makes it to the grain, Risk; probability of not maximizing yield, and Economic; making a profit.
Lets talk about our Pick 2 options:
Economic and Low Risk:
This one for me is really easy to describe, whether it is winter wheat or corn. This pairing is 100% Pre-Plant Anhydrous Ammonia.
And even though there is a greater inherent risk of losing N due to high rainfall or over applying N because in season environment limited yield potential, there is only 1 application of a low cost N source and the perceived risk of yield loss due to not having enough N is much less. For Oklahoma wheat producers 100 lbs of N as anhydrous is easy and considered risk adverse, however it is not efficient in terms of nutrient use. If fact in a good year this method typically only gets close to the 33% NUE that Dr. Raun and Dr. Johnson discussed in their 1999 Agronomy Journal paper titled “Improving Nitrogen Use Efficiency for Cereal Production” Link.
Efficient and Low Risk:
To be absolutely efficient in a perfect world we provide the N when the plant needs it not before or after. Many refer to this as spoon feeding, which while is absolutely economical in a drip irrigation system it is not in dry land environments. In this scenario uptake rate can be determined using on site weather stations and growth models. N losses could be determined using the same onsite weather data and some soil and N cycle modeling. But with spoon feeding the number of applications is potentially quite high and is often limited by the overall cost of application. Therefore making this option not economical.
Economic and Efficient:
This involves reduced to no pre-plant and application(s) made in-season after enough time, and environment, has passed to collected the data/information needed to determine yield potential, activity of the N-Cycle and losses. This is the method that utilizes precision ag, this is where I place the use of N-Rich Strip and Sensor Based Nitrogen Rate Calculator. Previous blogs Nitrogen Rich Strips Re-Post: Sensing the N-Rich Strip and Using the SBNRC . Even though we have plenty of data, on farm and small plot, that spans almost two decades of environments and dozens of states adoption is slow. But as I look out over the entire N management landscape adoption of most N management strategies are slow.
First I acknowledge there are a dozen other aspects to why technology is not adopted, and this is just one of many theories. But as I see it, it is the Risk component that can be the hinge for the changing of a N management strategy. We can not change the math on Efficiency or Economics, but we can change how we not only perceive risk but how we manage around risk. How and what a producer views as a risk often influences management. If I am a wheat producer in Oklahoma and my greatest concern is yield, then it makes since to leverage N inputs early to ensure crop never stresses. If losses occur then I can top it off. However on the flip side if I see being over leverages with inputs early as a risk, then I will delay N application and see what my crop and environment is going to provide in the given cropping season. And yield stability, how consistent are the yields year after year, will likely be the driver of where I see my risk being.
In conclusion this is not a recommendation, not a review of current science or an opinion of what is right or wrong. This blog was a way to convey what I have interpreted from the past 15 years of observation.
Please feel free to contact me with comments or questions.
Brian Arnall
Precision Nutrient Management Specialist
Oklahoma State University
b.arnall@okstate.edu
Managing Protein in Hard Red Winter Wheat_Repost and Update.
As I write this on May 5, 2019, the wheat is at or nearing flowering and Stillwater just received another 2.22 inches last night helping the 30 day rain total to be just shy of 9 inches. Its wet, cool, and the wheat has truly gone from rags to riches (the crop not the market). I have been regularly fielding calls on late season N and protein. I thought it would be a good time to repost my previous protein blog and add some thoughts and updates. Since the original post we have more data on nitrogen (N) timing work and one year of data from a trial we call “Protein Progression”. First if you are interested in the timing study the full blog summarizing 2 years of work can be seen here How long can wheat wait for Nitrogen? . But the short short version was that two years in a row delaying the application of ANY nitrogen until very late in the season, past hollow stem, resulted in the best combination of yield and protein. Meaning even when wheat was yellow and stunted yields and quality recovered when N was applied at or shortly after hollowstem. This work is being continued and expanded this year. I have only shared the Protein Progression results in a few presentations, because they do not tell a consistent story. For a few years now I have been giving this advice when asked about late season nitrogen. Based upon the work I have done, this year is my 11th wheat crop in this position and I have always had at least 1 study with late N, that when nitrogen was applied at flag leaf the probability of a positive return on investment was below 50% and closer to 33%. Very seldom did I see the flag leaf applications of nitrogen provide much benefit. At the flag leaf stage when there was a positive benefit it could be yield, protein or both. When it came to anthesis (flowering) applications the probably increased to closer to a 66%-75% chance of positive impacts (Understand these percentages are drawn from my experiential learning across many environments, I have not yet run the data to determine exact values). Late applications in the right environment could increase protein by up to 2% and in the wrong environment, devastate yield due to burn. The weather needs to be cooler and humid to reduce the potential of burn and the rate of nitrogen must high enough to actually impact protein levels. Per each 1% of protein concentration of wheat grain there is 0.1 lbs N per bushel. So to increase to increase the protein content of a 60 bushel wheat crop by 1%, 6 lbs much be converted from fertilizer to protein. To get this amount of nitrogen on the crop without burning it up I have been using UAN (28-0-0) and water at a ratio of 1:1 putting on 20 total gpa. When applied this way I have not seen burn, I do however avoid spraying when its hot, windy with low humidity.
Below are last years results of the Protein Progression study. In this I wanted to look at N application timing pre vs post, the addition of sulfur (many sources state added sulfur increases yield), flag and anthesis application. Last year we had locations near Stillwater (LCB) and Chickasha. Both yielded in the 60 bushel range which was OK but well below the five year average of both sites. At the LCB we saw a great response to N fertilizer. The more it was delayed the better off yields were. We saw a consistent negative impact of S at top-dress, which is a result I can not explain, there was no crop damage due to application. The flag leaf N application significantly increased yields, at flag leaf there was evidence of N deficiency. And the anthesis application of N had no impact on protein. At Chickasha where the none fertilized check yielded 53 bushels, the response to N was reduced. Sulfur had no impact on yield or protein, flag lead N and anthesis N increased protein by about 1%.
What did I learn from those studies, I confirmed the response to late N is not very predictable. The low protein site (LCB average protein of 11.75) did not respond to late N but the high protein location (Chickasha’s average protein content was 15%) did. I was able to see N at flag leaf did impact yield when N deficiency was noted. It also confirmed this study will be continued for multiple years. The more environments we can get data from the better we can predict response/non response.

Results from the 2017-18 Protein Progression Study. The graphic on the left is from Lake Carl Blackwell near Stillwater, the center table is the treatment structure and the graphic on the right includes the yield and protein results from Chickasha. Nitrogen rate (pre + top) was 120 lbs N per acre, top-dress S rate was 10 lbs. The nitrogen rate at flag leaf and anthesis was 24 lbs N per acre, while the anthesis S rate was 10 lbs. N source was UAN for all application and S source was ammonium thiosulfate. For flagleaf and athesis applications water was used as a carrier at a 1 to 1 ratio with the fertilizer.
If you have any questions feel free to send me an email at b.arnall@okstate.edu.
Brian
Original Post Sept 27, 2017
A result of the 2016-17 winter wheat crop was a significant amount of discussion focused on protein levels. For two years running now, the protein levels have been low across the board. Low protein brings in a challenge to sell, could impact local basis, and even more concerning is that low protein is an indicator that nitrogen was limiting during grain fill. Therefore, the field maximum yield potential was not achieved. In this blog, we talk about what protein is, what can be done to maintain a good protein level, and what can be done to increase protein if desired.
First, the definition of protein is any of a class of nitrogenous organic compounds that consist of large molecules composed of one or more long chains of amino acids and are an essential part of all living organisms, especially as structural components of body tissues such as muscle, hair, collagen, etc., and as enzymes and antibodies. Protein is also one of the many attributes that determines end-use quality and marketability of winter wheat. Sunup TV met with Dr. Carver in the baking and milling lab to create a great video discussing wheat quality impact on baking and milling.
We determine protein by measuring the percent of nitrogen in the grain and multiplying by a factor of 5.7. So if the grain has N % of 2.5, the protein content is 14.25. The amount of N in the grain is affected by many variables such as weather during grain fill, yield level, and N availability during grain fill. If weather is conducive to good grain fill and test weight is high, we will often see protein values dip. On the other hand when grain fill conditions are hot and dry and we have light test weight, wheat protein will be higher. Research has shown (Figures 1 and 2) that generally as yields increase protein levels decrease. Of course if N is limited during grain fill, the N available for the grain is reduced, and the plant is forced to get all grain N from re-immobilizing N in the leaf tissue.
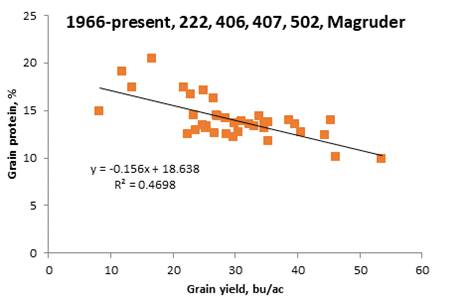
Fig 1, Yield and protein averages from all of the OkState Long Term fertility trials. Data courtesy Dr. Bill Raun.

Fig 2, Grain protein and yield of from intensively managed wheat. Data Courtesy Dr. Romulo Lollato KSU.
Maintaining Protein, and yield.
Managing nitrogen to maintaining protein and maximizing yield comes down to making sure that N is available at critical growth periods. With wheat, the critical uptake stage is typically the time frame between hollow stem and soft dough. The two graphs below show nitrogen uptake in wheat and barley. If the same graph was made for dual purpose wheat, the upward swing would start sooner but would follow the same general trend.

Fig 3, Nutrient Uptake of Wheat found in “Agricultural and Biological Sciences » “Crop Production”, ISBN 978-953-51-1174-0, Chapter 5 By Juan Hirzel and Pablo Undurraga DOI: 10.5772/56095″

Fig 4, Nitrogen uptake in Barley at two nitrogen rates. http://apps.cdfa.ca.gov/frep/docs/N_Barley.html
When it comes to making sure N is available during this time of peak need, the only way we can do that is apply just before it is needed. This means split application. While putting all the nitrogen out pre-plant as anhydrous ammonia is the cheapest method, it is also the method that provides the lowest nitrogen use efficiency and is most likely to show deficiencies late in the season. One of the challenges with 100% preplant N application is that years with good yield potential coincide with years with good/high high rainfall, which means more nitrogen loss. Some interesting results from studies implemented in the 2016-17 cropping season showed the importance of nitrogen application timing. The study is determining how long nitrogen application can be delayed after the N-Rich strip becomes visible (https://osunpk.com/2013/09/19/nitrogen-rich-strips/). For the study, 90 lbs of N was applied on one of the treatments at planting When that plot became visibly greener or bigger than the rest, N application was triggered. After the 0 DAVD (Days after visual difference where the day had growing degree days >0), another treatment was applied every 7 growing days for 63 growing days. Each plot, excluding the zero N check, received 90 lbs as NH4NO3 (we use this to take the variable of volatilization out of the data). In all cases, 90 lbs applied in late January to early February was better than 90 lbs pre-plant. Keep in mind there was 0 N applied at planting for each DAVD application timing; yet, we still hit 50-80 bushel wheat with nothing but in-season N. This is the result of supplying the N when the plant needs it. I should add this is just one year of data, and every year is different. The study is being replicated again this year and will be highlighted at the Lahoma field day.
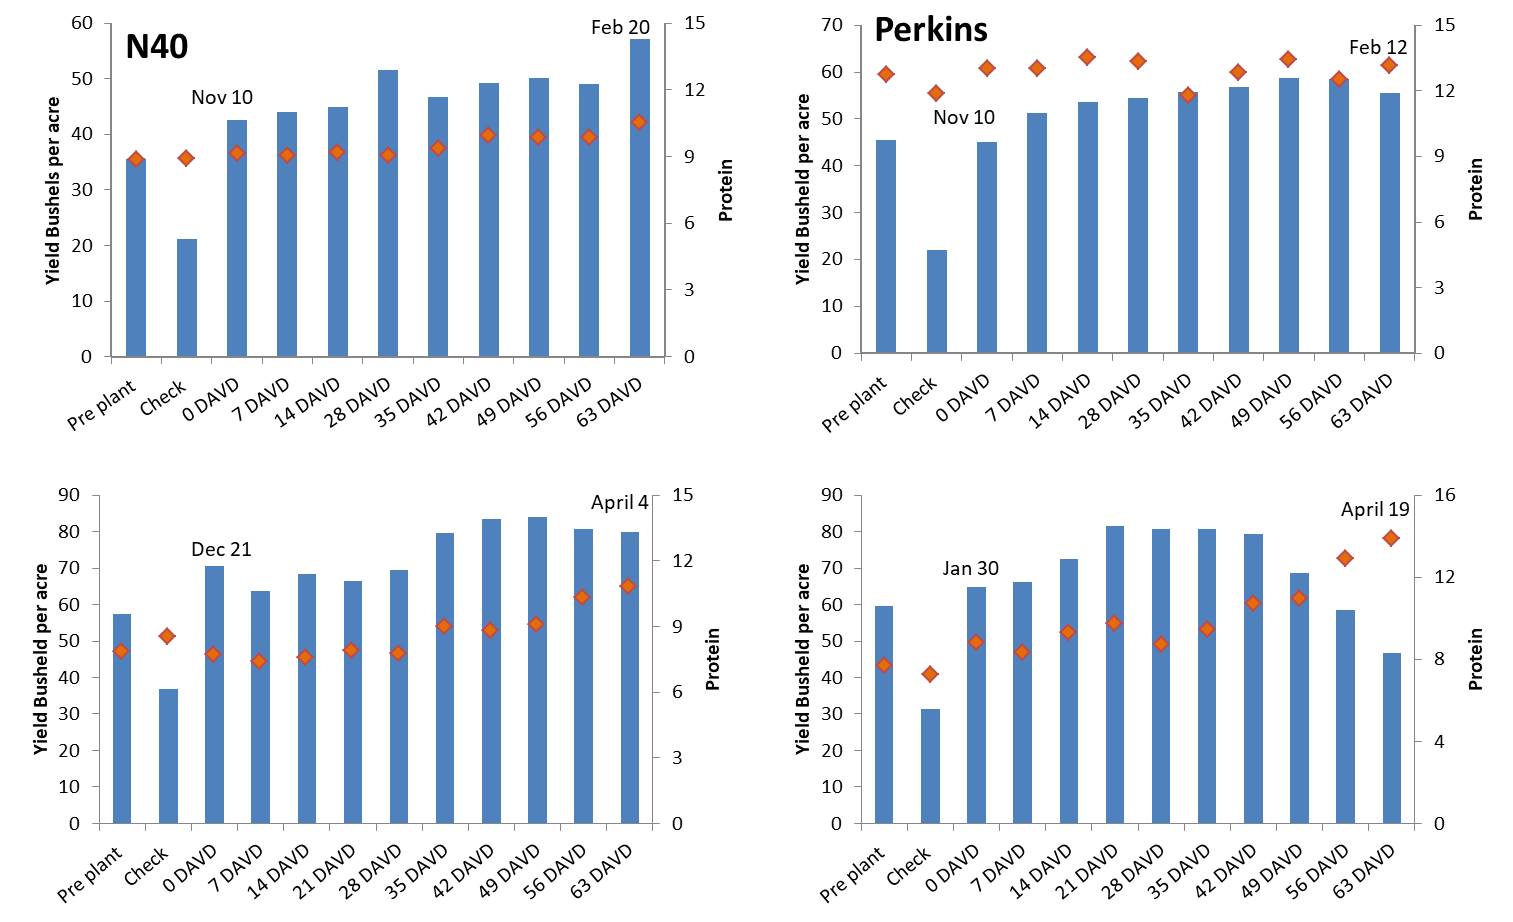
Fig 5, Results from the 2016-2017 delayed nitrogen study led by Mr. Joao Bigato Souza. The trials consisted of a preplant plot, unfertilized check plot, and then a series treatments in which N application was based on days from a visual difference between the pre-plant and check. All fertilized plots received 90 lbs N as NH4NO3. DAVD is days after visual difference. (Error in bottom left graph, the last date should be March 27 not April 4)
For dual-purpose wheat, the total amount of N expected for the forage production needs to be applied pre-plant. Oklahoma State recommends 30 lbs N for every 1,000 lbs of forage expected For grain-only wheat, there needs to be only 20 to 40 lbs of N available to the crop when planted (this includes residual N). The remaining N should be applied at green up or early spring. The only way to ensure that N is applied when the crop needs it is to utilize the N-Rich Strip method. Having a N-Rich strip in your field lets you know when the wheat needs more nitrogen and when it does not.

Fig 6. Nitrogen Rich Strip (N-Rich) showing up in a No-till wheat field.
Two years testing the N-Rich Strip and Sensor based nitrogen rate calculator (SBNRC) from the Texas boarder to the Kansas boarder showed that the SBNRC on average reduced N but maintained yield and protein when compared to standard farmer practice (Table 1).

Table 1. Results from testing the Nitrogen Rick Strip and Sensor Based Calculator Method across Oklahoma wheat fields.
Increasing Protein
Some producers may plan to market high protein for a premium if available. Fortunately, there are opportunities to increase protein via management. While most of the strategies for increasing protein happen later in the growing season, some of the early decisions can be a significant contributing factor. Variety selection and keeping the plant healthy and free of competition (i.e., pest management) throughout the growing season are going to increase the opportunity to produce high protein wheat. After that, the equation goes back to Figures 3 and 4 and making sure the crop has access to nitrogen during peak periods, including grain fill. If you will note, the bottom two graphs of Figure 5 both show significant increases in protein on the later applications. For both locations, this was when N (90 lbs N ac-1) was applied after full flag leaf emergence. There has been a significant amount of work at OSU looking at late application of N stretching back into the 1990s http://nue.okstate.edu/Index_Publications/Foliar_N_Curt.pdf. The focus has been looking at timing, source, and rate. The take home of decades of work can be summarized as such. Yes, protein can be increased with late season application, but not always. Applying N at or after flowering has a significantly greater probability of increasing protein than a application at flag-leaf. Source of N has had little impact if managed properly (UAN, 28-0-0, has to be watered down so that it does not burn the plant). The rate of N does matter quite a bit. Most of the work suggests that for every pound of N applied, the percent grain protein could increase by .05%. So to increase protein from a 12.5% to 13.5%, it would require approximately 20 lbs of N per acre. My work has shown the same trend that a 20 lbs application at post-flowering had more consistent increases in protein than lower rates at the same time or similar rates applied at flag leaf.
This wheat season we are looking to improve our knowledge of management on protein content through multiple studies by continuing the evaluation of varieties and management practices.
If you have any questions for comments please feel free to contact me.
Brian A.
B.arnall@okstate.edu
Rain makes grain, but also washes Nitrogen away.
Precipitation in the southern Great Plains is never something you take for granted. As I write this blog I am just wondering when it will be dry enough for long enough to finishing sowing my wheat, but I also remember just how dry it was last winter. The last three months, Aug-Oct rank as one of wettest in the states recorded history. Below are the 30, 60, and 90 day rain fall totals (as of 10.26.18) from Mesonet. By the 60 day map most the wheat belt is showing double digits and the 90 day maps shows a lot of our graze out wheat regions in the 20+ inch realm.
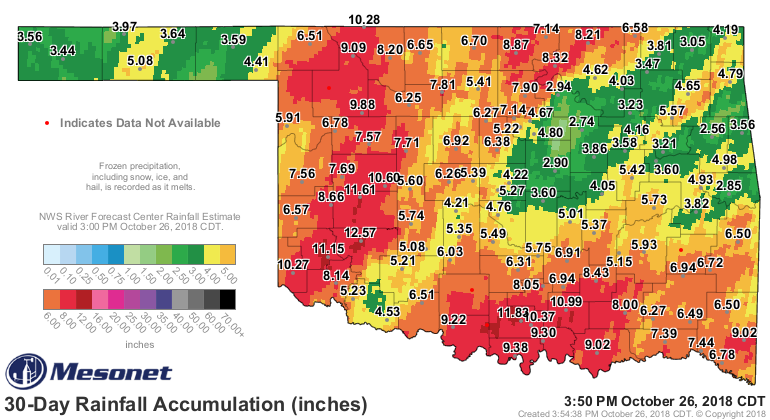
30 Day rainfall totals retrieved from Mesonet on 10.26.18. Putting recording window from Sept 26-Oct 26. http://www.mesonet.org/index.php/weather/category/rainfall

60 Day rainfall totals retrieved from Mesonet on 10.26.18. Putting recording window from Aug 27 – Oct 2 http://www.mesonet.org/index.php/weather/category/rainfall

90 Day rainfall totals retrieved from Mesonet on 10.26.18. Putting recording window from July 28-Oct 26 http://www.mesonet.org/index.php/weather/category/rainfall
I bring up graze-out wheat for a reason, to get as much forage as possible it is planted as early as possible. I know of fields that were seeded in July and early August. And to produce this great quality forage, nitrogen fertilizer is applied pre-plant. It just so happens that this July more fertilizer was sold than any other month since I have been in Extension. In July producers bought nearly 1/3 of totoal tons of fertilizer what is typically sold in a single year. While a portion of this may have been pre-purchased for later delivery, I know a lot of it made it to the field. To see why this matters, lets take a look at the nitrogen cycle.

Complete Nitrogen Cycle. http://psssoil4234.okstate.edu/lecture
The nitrogen cycle is made up of a central component (Organic Matter), three N sinks (Microbial/Plant, Atmosphere, Nitrate {NO3}), four loss pathway (Ammonia Volatilization, Leaching, Plant Loss, Denitrification), and five additions (N2 Fixation, Fertilization, Lightning/Rainfall, Industrial Fixation, Plant/Animal Residues). We are going to spend the next bit talking about what is happening in the bottom right corner and left hand side.
When we put anhydrous ammonia (NH3) in the soil it pulls a hydrogen (H) from water and turns in to ammonium (NH4). Urea goes through a similar process but has to first be converted to NH3 by the enzyme urease. Ammonium is important because it is a positively charged ion (cation) which will be fixed on the cation exchange sites. This means is it not going to move around in soil, but is readily available for plant uptake. However when NH4 is in a soil with temperatures above 50 degrees and in the presence of oxygen the two bacteria nitrosomonas and nitrobacter convert it to NO3. Given warm soils and our good soil moisture levels it very likely that any N applied in July or August would have converted 50% or more of its NH4 into the NO3 form by this point.
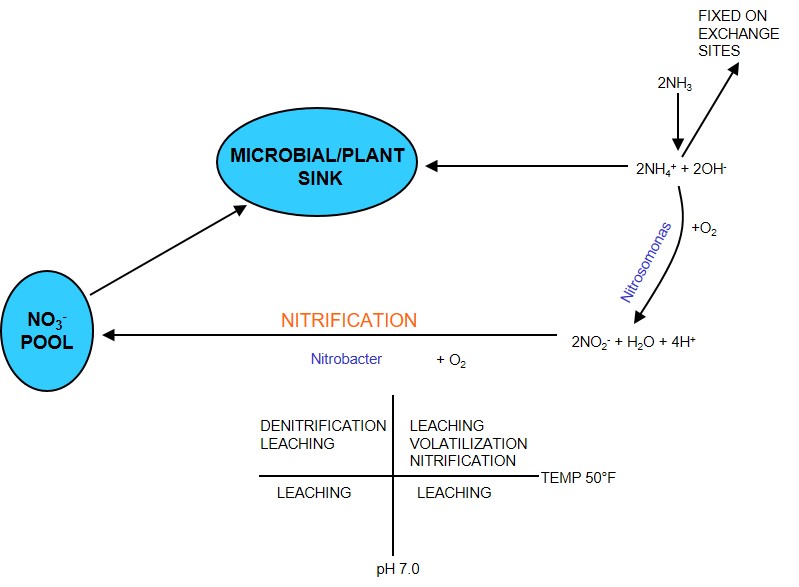
Nitrification portion of the Nitrogen Cycle. Complete Nitrogen Cycle. http://psssoil4234.okstate.edu/lecture
Nitrate is a negatively charged ion (anion) which is repelled from the negatively charged soil. This is beneficial for plants as when they take up water, NO3 is taken up though mass flow. The downside is that since NO3 is in the soil solution, where ever the solution goes so does the NO3, that is called leaching. So in well drained soils the recent rains will have caused a fair amount of leaching. For some areas the NO3 that is leached below the root zone and could potentially be drawn back up as the soils dry. But there are going to more scenarios in which the N is gone, or at least gone elsewhere. In a sloping field the soil water will hit a limiting layer or clay increase layer and move down slope. I have already seen many wheat fields that are showing yellowing on side slopes.
Unfortunately leaching isn’t the only way we are losing N during this wet cycle. Denitrification occurs when the soil is saturated and oxygen (O) levels are depleted. In anaerobic conditions, microbes strip O from NO3 reducing it gaseous forms. Typically it takes about one week of standing water to start seeing high levels of denitrification.

Nitrate loss pathways of the Nitrogen Cycle.
Complete Nitrogen Cycle. http://psssoil4234.okstate.edu/lecture
What does this all mean? Conservative guess is that for July or early August applied N we could be looking at losses of 50% or more. This is a rough guesstimate of course, a fields soil texture, slope, soil type, tillage etc will all impact the loss amount. As the date of application moves closer to Oct there will have been less nitrification and less total rainfall. What I can say with 100% certainty is that if N fertilizer was applied any time from July through early September, N has been lost.
So whats my N manage recommendations? First, foremost, and always This is the perfect scenario where N-Rich Strips will pay off! (Here’s a blog on N-Rich Strips https://osunpk.com/2013/09/19/nitrogen-rich-strips/). The N-rich Strip will allow you to detect N stress early, which for grazers is important. Close attention needs to be paid on fields with wheat being grown for grazing, N deficiencies will reduce forage production and gain. If the N-Rich strip shows up or there are signs of N deficiencies (yellowing of older leaves from the tip toward the collar) its time to be looking at applying N. For grain only fields we have some time. It is important though that as we get closer to spring and hollow stem we are taking care of the crops N needs. Here is a link to a blog on reading the N-Rich Strips to get a N rate rec https://osunpk.com/2014/02/24/sensing-the-n-rich-strip-and-using-the-sbnrc/ and here is a link to one of my latest blogs on Timing of Nitrogen Application for Wheat https://osunpk.com/2018/10/01/how-long-can-wheat-wait-for-nitrogen/.
For more information please contact me at b.arnall@okstate.edu
Below is a Sunup TV video on the subject of Nitrogen Losses with the recent rains.
Planting Date and Seeding Rate Considerations for Winter Wheat
As the current weather pattern has this state headed to one of its wettest, if not the wettest, Aug-Sept-Oct on records, this is good information. As we start progressing towards November wheat seeding rate needs to be increased to compensate for lost tiller production. Keep in mind I have not done ANY research on seeding rate. After the mid Oct I bump my seeding rate to 70-75 lbs per acre. As we hit November I am in the 80s.
With this August setting up similar to last year and the need for wheat pasture for a number of producers this fall, we will likely see drills start rolling in parts of the state by the end of the month. As planting gets going, here are a couple considerations when it comes to planting dates and seeding rates for Oklahoma winter wheat.
Planting date:
The optimal window for dual-purpose wheat for most of Oklahoma is between September 10-20 (approximately day 260 in Figure 1). This window represents a trade-off between maximizing forage production while minimizing potential grain yield loss. Earlier planting dates, last week into this week for example, will provide more fall forage potential, but this is usually not recommended unless the wheat is intended to be produced for grazing, or “grazeout.” Planting dates for grain-only producers will be at least 2-3 weeks later than what is the ideal…
View original post 297 more words
How long can wheat wait for Nitrogen?
Joao Bigatao Souza, PhD. Student Precision Nutrient Management
Brain Arnall Precision Nutrient Management Extension Specialist.
The N-rich strip method allows wheat producers a greater window of decision making regarding the application of nitrogen (N) fertilizers. Besides having greater accuracy in N rates than standard methods (based on the SBNRC – OSU) also helps to reduce costs in the production system and to preserve the environment avoiding over N applications.
With the experiments performed in the last two crop seasons (2016/18 and 2017/18), we can now be even more accurate with regard to the best application time to increase the N use efficiency by the crop. The objective of our study was to determine the impact of prolonged nitrogen deficiency on winter wheat grain yield and protein. Eight studies were conducted with 11 N application timings in no-till dryland conditions. A pre-plant treatment of 90 lbs ac-1 of N was broadcast applied as ammonium nitrate (AN). We used AN as our source because we wanted to measure the crops ability to recover and eliminate the impact of source efficiencies. When visual symptom differentiation (VSD) was documented between the pre-plant and the non-fertilized check, i.e the N-Rich Strip showed up, top-dress applications were performed every seven growth days (GDD> 0) (https://www.mesonet.org/index.php) until 63 growth days after VSD at all sites. The only N the treatments received where applied according to treatment structure. No preplant N was applied other than trt 1, and all locations had residual N under 15 lbs 0-6” sample.
The first visual response to fertilizer N ranged from November 11 to February 5 (Table 1). The soil can have residual N from the previous season which can supply the subsequent crop in the beginning of the development what makes the wheat not demonstrate any sign of stress in the early season. For example LCB2017 a and b which were located 100 yards apart but under a different point in the crop rotation (LCBa was wheat after wheat and LCBb wheat after canola) had a 30 day difference in date of first N response. This range in first and last dates allowed us to evaluate N application over a wide range of dates and determine whether the first sign of stress is actually the best indicator of top dress application timing.
Table 1 shows the planting date, date of first visual difference (0DAVD) and each of the application dates for all locations. Different colors represent individual months. Hollow stem occurred approximately Feb 20 in the 2017 crop and March 10th in the 18 crop.
Image of the 2016-17 Perkins location. Image collected March 21 2017.
As shown in the Tables 2 and 3 below only three of the 78 comparisons made back to the pre-plant application were significantly less in terms of grain yield. All three of these comparisons where from when N application was delayed until late March or April. When the delayed applications were compared to 0DAVD yields only two of the 68 comparisons showed a significant decrease on yield. One was the pre-plant application for LCB2017a while the other were the 63DAVD application for LCB2017b. In most locations applications made in March yields were at the highest point, however when delayed till April yield trends on the downward trend. The 2017 crop reached hollow stem (Feekes 6) around Feb 20th while the 2018 crop reached hollow stem around March 10th.
Grain protein concentration was decreased only once when compared to both the pre-plant and 0DAVD treatments. This one timing, LCB2018b 64DAVD, was the only application made in May. During this time the crop was in the early stages of grain-fill. In all locations delaying N application until February/March increased grain protein content above the check, and in most cases above the 0DAVD trt.
Tables 2-3 shows the winter wheat grain yield and protein concentration, respectively, of all treatments. The colors of the cells represent statistical difference from the Pre-plant treatment. Treatments with cells shaded yellow are equal to the pre-plant, Green is statistically greater than while red is statistically less than the pre-plant treatment.
2016-2017 Delayed nitrogen winter wheat grain yield and protein results. For the locations of Perkins and N40 the Dec-1 application has a higher yield due to a 2x application of N to equal 180 lbs.
2017-2018 Delayed nitrogen winter wheat grain yield and protein results. The Perkins location in 18 was the only location in the study which did not have a statistically significant response to added N.
All the data was combined and plotted by cumulative GDD’s>0 from planting (GDDFP) across all locations to determine a general “best” timing. Using the pre-plant application yield as a base there was no yield loss if the applications was made prior to the 143 GDDFP. When the results were normalized by 0DAVD N there was no yield loss if the applications were made prior to 130 GDDFP. The quadratic model created provides the opportunity to identify the point of highest grain yield, which was approximately 94 GDDFP. In terms of the relationship between the application of N based on GDDFP and % of protein content on the grain, a linear response of N delay application observed for grain protein concentration. Our results suggest that the later the application, the higher the protein % in the grains.
Growing degree days > 0 from planting and equivalent calendar days for all experimental sites (Lake Carl Blackwell, Perkins, Lahoma, Stillwater) utilized in the study evaluating the impact nitrogen fertilizer timing on winter wheat, conducted in north central Oklahoma over the 2016-2017 and 2017-2018 winter wheat growing seasons.
We have concurrent work looking at similar approaches with other sources of N such as Urea and UAN. While all of these studies are being continued the past two years of work have presented some easy take homes.
First: Timing of N application does matter, but yellow wheat does not necessarily mean yield loss.
Second: Two years in a row ALL Nitrogen could be delayed until hollow stem without yield Loss, in fact yields of trts with N applied at this time typically better than that of the pre-plant.
Third: Protein content increased as N applications was delayed.
Fourth: The conclusions of this and other studies support that N-Rich Strip concept does not increase risk of lost yield.
Fifth: Applying the majority of the N at or just after hollow stem maximized grain yield and protein with a single shot.
Sixth and Final: Be more concerned about applying N in an environment conducive to increased utilization and less about applying at the first sign of N stress. Take a look at the wheat N uptake curve by K-State.The crop really doesnt get going in terms of N-uptake until jointing i.e. hollow Stem.
Wheat N-uptake. Figure adapted from Lollato et al.
Questions for comments fill free to contact me via email at b.arnall@okstate.edu
The challenge of collecting a representative soil sample
Guest Author, Dorivar Ruiz Diaz, Nutrient Management Specialist Kansas State University
At first glance, soil sampling would seem to be a relatively easy task. However, when you consider the variability that likely exists within a field because of inherent soil formation factors and past production practices, the collection of a representative soil sample becomes more of a challenge.
Before heading to the field to take the sample, be sure to have your objective clearly in mind. For instance, if all you want to learn is the average fertility level of a field to make a uniform maintenance application of P or K, then the sampling approach would be different than sampling for pH when establishing a new alfalfa seeding or sampling to develop a variable rate P application map.
In some cases, sampling procedures are predetermined and simply must be followed. For example, soil tests may be required for compliance with a nutrient management plan or environmental regulations associated with confined animal feeding operations. Sampling procedures for regulatory compliance are set by the regulatory agency and their sampling instructions must be followed exactly. Likewise, when collecting grid samples to use with a spatial statistics package for drawing nutrient maps, sampling procedures specific to that program should be followed.

Figure 1. The level of accuracy of the results of a soil test will depend, in part, on how many subsamples were taken to create the composite sample. In general, a composite sample should consist of 15 or more subsamples. For better accuracy, 20-30 cores, or subsamples, should be taken and combined into a representative sample. F
Regardless of the sampling objectives or requirements, some sampling practices should be followed:
- A soil sample should be a composite of many cores to minimize the effects of soil variability. Take a minimum of 12 to 15 cores from a relatively small area (two to four acres). Taking 20-30 cores will provide results that are more accurate. Take a greater number of cores on larger fields than smaller fields, but not necessarily in direct proportion to the greater acreage. A single core is not an acceptable sample.
- Use a consistent sampling depth for all cores because pH, organic matter, and nutrient levels often change with depth. Match sampling depth to sampling objectives. K-State recommendations call for a sampling depth of two feet for the mobile nutrients – nitrogen, sulfur, and chloride. A six-inch depth is suggested for routine tests of pH, organic matter, phosphorus (P), potassium (K), and zinc (Zn) (Figure 2).
- When sampling a specific area, a zigzag pattern across the field is better than following planting/tillage pattern to minimize any past non-uniform fertilizer application/tillage effects. With a GPS system available, recording of core locations is possible. This allows future samples to be taken from the same locations in the field.
- When sampling grid points for making variable rate nutrient application maps, collecting cores in a 5-10 foot radius around the center point of the grid is preferred for many spatial statistical software packages.
- Avoid unusual spots obvious by plant growth and/or visual soil color/texture differences. If information on these unusual areas is desired, collect a separate composite sample from these spots.
- If banded fertilizer has been used on the previous crop (such as strip tillage), then it is suggested that the number of cores taken should be increased to minimize the effect of an individual core on the composite sample results, and to obtain a better estimate of the average fertility for the field.
- For permanent sod or long-term no-till fields where nitrogen fertilizer has been broadcast on the surface, a three- or four-inch sampling depth would be advisable to monitor surface soil pH
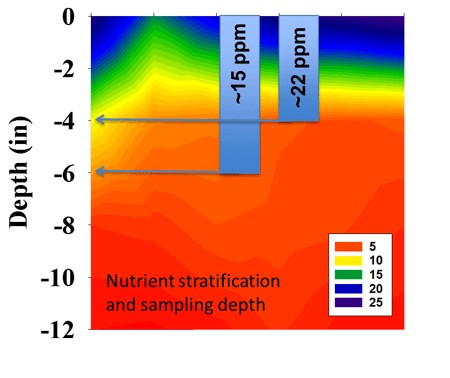
Figure 2. Consistency is sampling depth is particularly important for immobile nutrients like P. Stratification of nutrients and pH can be accentuated under reduced tillage.
Soil test results for organic matter, pH, and non-mobile nutrients (P, K, and Zn) change relatively slowly over time, making it possible to monitor changes if soil samples are collected from the same field following the same sampling procedures. However, there can be some seasonal variability and previous crop effects. Therefore, soil samples should be collected at the same time of year and after the same crop.
Soil test results for organic matter, pH, and non-mobile nutrients (P, K, and Zn) change relatively slowly over time, making it possible to monitor changes if soil samples are collected from the same field following the same sampling procedures. However, there can be some seasonal variability and previous crop effects. Therefore, soil samples should be collected at the same time of year and after the same crop.
Soil testing should be the first step for a good nutrient management program, but it all starts with the proper sample collection procedure. After harvest in the fall is good time for soil sampling for most limiting nutrients in Kansas.
For instructions on submitting soil samples to the K-State Soil Testing Lab, please see the accompanying article “Fall soil sampling: Sample collection and submission to K-State Soil Testing Lab” found in this eUpdate issue.
For any questions Contact.
Dorivar Ruiz Diaz, Nutrient Management Specialist
ruizdiaz@ksu.edu
How Does Soil pH impact Herbicides?
Misha Manuchehri and Brian Arnall
There are many factors that influence the persistence and uptake of a herbicide that has soil activity. One of those factors is soil pH or the amount of hydrogen (H) ions present in the soil solution. Some herbicides will persist for an extended amount of time or rapidly degrade when outside the pH window of 6.0-7.0.
The triazines (atrazine, simazine, etc.) and sulfonylureas (chlorsulfuron, metsulfuron, etc.) are two herbicide chemical families that are especially affected by soil pH (Table 1). The dinitroanilines, and the active ingredient clomazone also can be affected by low and high soil pH; however, degradation by light and/or volatility are more important when it comes to the activity of these herbicides. Generally, the triazines and sulfonylureas persist longer and are more available for plant uptake in higher pH soils (>7.0) while the opposite is true for imidazolinone herbicides (imazamox, imazapic, imazethapyr, etc.). Imidazolinones persist and are more available for plant uptake in lower pH soils (<6.0). The persistence of the triazines and sulfonylureas in high pH soils is a result of a decrease in chemical and microbial breakdown, a trend that is often observed in high pH soils where neutral herbicide molecules are loosely adsorbed to the soil and are more available for plant uptake. Conversely, in low pH soils, triazine and sulfonylurea herbicides become charged and are more tightly adsorbed to the soil where they are more susceptible to breakdown.
A key management factor that must be considered when evaluating a field’s soil pH is whether or not the field is no-till and for how long it has been in no-till. Tillage will impact how deep you should take soil samples to determine soil pH. In no-till and minimum tillage fields, the traditional method of 0-6 inch or 0-8 inch soil cores may not be adequate. Instead, a 0-2 inch core depth and a 2-6 inch core depth may be needed, since application of limestone to the surface may increase surface pH more than expected or application of nitrogen fertilizer to the surface may cause a drop in pH at the surface. In many long term no-till fields with historic surface applications of N and no lime applications, soil pHs in the low 4s have been observed while the 3-6” depth will be at a 6.0. Since herbicides with a soil residual are affecting plants just below the soil surface, this is the soil zone we are the most interested in.
Oklahoma and Kansas production fields can have a wide range of soil pH from field to field and within field. In a dataset of over 300 grid sampled fields from Oklahoma (259 fields) and Kansas (47 fields), the average field pH was a nice 6.0. However, the average range in the lowest and highest soil pH within the fields was 1.9. This means the average field had a pH range from 5.0 to 7.0. It should be noted that more than 25% of the fields had a pH range of 3.0 units. This range of highs and lows has helped explain the presence of spotty herbicide issues on several fields in the past and should be taken into account when planning crop rotations.
It is extremely important to know and understand the pH of your soils and the herbicides you plan to use and how they will react. Soil testing is the only way to know your soil pH and reading your herbicide label is a great way to learn if soil pH affects the herbicide you are applying.
Table 1. Herbicide chemical families or selected herbicides that are most affected by soil pH.
|
Herbicide chemical family or active ingredient |
Common name (trade name) examples |
Importance of soil pH |
Soil pH considerations |
|
Sulfonylureas |
Chlorsolfuron + metsulfuron (Finesse C & F), metsulfuron (Ally XP) |
Extremely |
pH > 7a – persist longer and are more available for plant uptake |
|
Triazines |
Atrazine (AAtrex), simazine (prince) |
Extremely |
pH > 7 – persist longer and are more available for plant uptake |
|
Imidazolinones |
Imazamox (Beyond), imazapic (Plateau), imazethapyr (Pursuit) |
Somewhat |
pH < 6 – persist longer and are more available for plant uptake |
aAcidic Soils < 5.5, Basic Soils > 7.5
