Home » Starter Fertilizer (Page 2)
Category Archives: Starter Fertilizer

Canola fertilizer rates when skip row seeding.
When drilling canola a common strategy to improve seeding rate accuracy is to only use every other row which effectively doubles the rate of seed going through each meter. There are also many producers who utilize air seeders and just prefer the wider spacing. Every season I get several questions about determining total fertilizer rates if the seed is dropped every other row but fertilizer is dropped every row. Regardless of whether or not fertilizer goes down every row it is important that the amount of salts placed with seed does not exceed the limit. The table below provide the limits in terms of lbs of salt per acre. If using 18-46-0 (DAP) or 11-52-0 (MAP) this is equivalent to pounds of N per acre. However if the fertilizer you use contains potassium (K) or sulfur (S), those have to be considered. An easy rule of thumb for determining total salt level of a fertilizer is pounds of N + K + 1/2 S.

Maximum amount of salt that can be applied in furrow with canola seed. Application rate should be at or below this value.
In a scenario in which canola is seeded in skip rows but every row will get fertilizer the total amount of fertilizer can be doubled. For example on a 15″ row spacing the max salt rate is 5 lbs per acre. If you were using DAP as your starter that maximum rate to place in furrow would be 28 lbs of DAP per acre. If using a drill set of 7.5″ spacing and putting fertilizer down every row the max rate would increase up to 56 lbs DAP per acre.

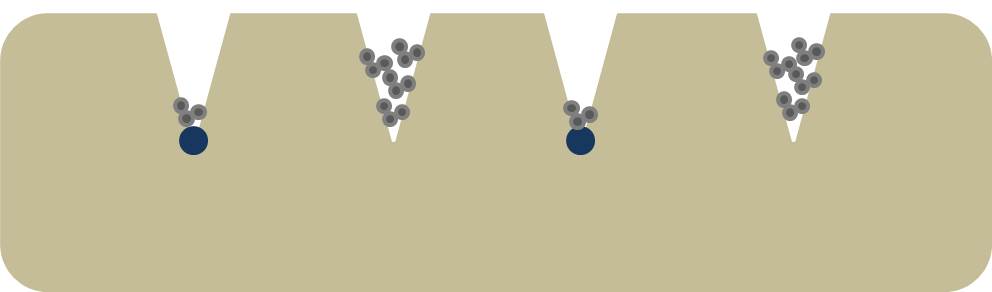
Seed, colored blue, is placed in every other row while an equal amount of fertilizer, dark grey circles, is placed in every row.
Some producers may have the capability of applying different rate in every other row. In this scenario it is important to maintain that safe rate in the seed furrow. In the opposite row, fertilizer rate can go as high as you wish or the equipment can handle.
Seed, colored blue, is placed in every other row while fertilizer, dark grey circles, is placed in every row. In this scenario a high rate is placed in the row without seed.
Now the big question is, “Is between row fertilization a good idea?” While we do not have results on this style of application (trials will be going out this year) we can draw upon upon similar work in other crops. For me the best win would be the second scenario in which a higher rate could be place between the rows. In this row I would use a urea and DAP blend. Any time we can put urea below the soil surface its a win and in fields with very soil soil test phosphorus (P) it would create something similar to the deep P bands once popular in corn production. Now if the field had adequate soil test P, I would focus on urea between rows. Keep in mind it is never a good to place urea in furrow with canola seed. For the average producer who is using a box drill the first scenario is the only option. In this case the rate of the between row bands will be reduced however I still believe on fields with very low soil test P this is potentially a great way to get the rest of it on. Remember if on 15″ and using DAP max rate only gets 12.9 lbs of P2O5 down. If fertilizer is dropped down every tube that number increases to about 26 lbs P2O5, which is still not enough for fields with low soil test P, but is better. With hope we will have some good results to share from the 2015-2016 canola crop.
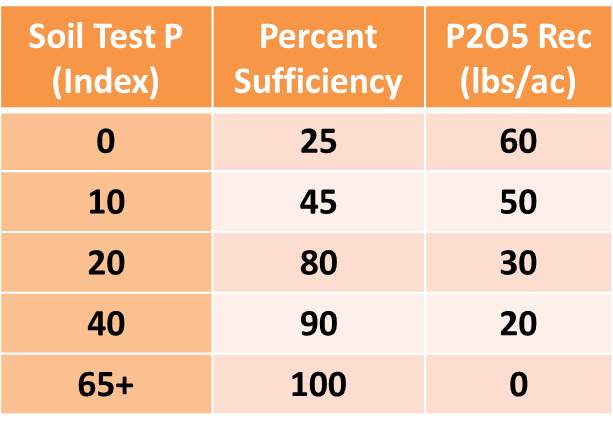
Phosphorus fertilizer recommendations based upon Mehlich 3 P test, reported as STP index (ppm * 2)
Results from 1st year of Soybean Starter Work
In the spring of 2014 we initiated what was to be the first year of a three year project evaluating starter fertilizers for soybean production in the southern Great Plains. The first and second year was and is being funded by the Oklahoma Soybean Board.
Year one was a bit experimental in that with so many products on the market we needed some initial work to help focus the direction for years two and three. I also added a treatment which I knew would have significant negative impact, for extension reasons. Keep in mind two locations in a single year does not make an experiment nor provide enough information to draw a definite conclusion. It is however enough to learn some lessons from and for us to plan for our 2015 trials.
The 2014 trial consisted of 12 treatments, Figure 1 and Figure 2. In these treatments I wanted to see the impact of a standard practice, see if a specific nutrient may be more so beneficial, and evaluate a few popular products. The spring of 2014 started out dry so at one of our two locations we pre-watered. This was done by hauling water to the Lake Carl Blackwell (LCB) 1000 gallons at a time and pumping through sprinklers. The other site, Perkins, we delayed planting until we had moisture.

Treatment Structure and rates for the 1st year of the Soybean Starter Study.

List of fertilizers and products used.

Image taken while planting the Soybean Starter study at Perkins. A CO2 system was used to deliver starter fertilizers with seed.
The two locations were also selected due to differences in soil fertility. The LCB site is has good soil fertility, with exception of phosphorus (P), and the Perkins site pH was an issue. I would have expected a benefit from adding P at both of these locations. Figure 4 shows the soil test results.

Soil Test results from LCB and Perkins.
At LCB as expected some of the treatments (Thio-Sul) reduced stand, some unexpectedly reduced stand (Fe) and others had less impact on stand (APP 5.0) than expected. The growth at LCB was tremendous, the 30 in rows covered over very quickly and the majority of the treatments hit me waist high by early August (I am 6’0”). Many of the treatments showed greater growth than check. But when it comes down to it, grain pays and green does not. Statistically there were no treatments that out preformed the un-treated check, however the K-Leaf and 9-18-9 did make 3 and 2 bpa more than the check respectively. What I am hypothesizing at this site is that the added nutrients, especially those with high P levels, significantly increased vegetative grown and these big plants were delayed into going reproductive and they started setting pods later in much hotter weather. While riding in the combine I could see that the plots with compact plants with clearly defined rows out yielded those were the vines had crossed over and we harvested through more of a solid mat of mature plants. A hot August is not uncommon and I am curious on whether this trend repeats itself. If it does this may direct us into research evaluating ways to force/promote the reproductive stage to start in these big plants. Even if we can force flowering to start earlier, it’s unknown whether yields will increase or not.
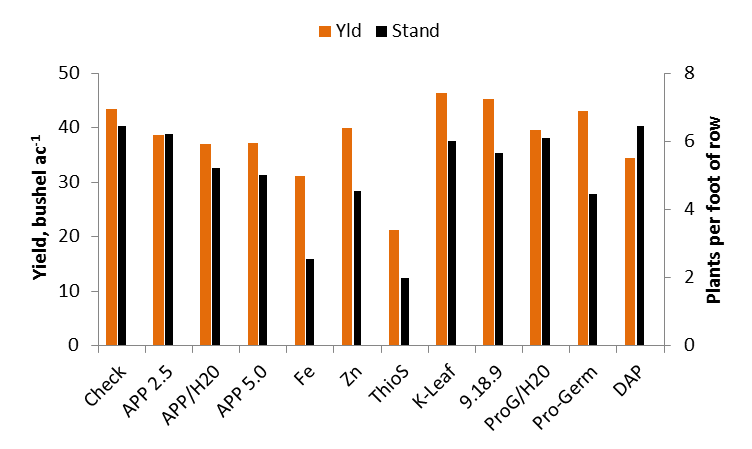
Yield and Stand counts from the 2014 LCB Soybean Starter Study.

The Check plot at LCB were plants noticeably a bit smaller and more yellow than the neighbors with phosphorus.

Soybeans at LCB on August 4th.
The same trends in treatments reducing stand can be seen at Perkins, however the impact was less extreme. Perkins being planted later due to waiting on moisture forced a later flowering date and I believe reduced overall yields. But the addition of P at this low pH site definitely made a difference. While again no treatments were statistically greater than the un-treated check the 2.5 gpa APP, DAP broadcast, APP/H2O, and Pro-Germ/H20 treatments increased yield by 5.6, 4.2, 3.8 and 1.7 bpa respectively.

Yield and Stand Counts from the Perkins 2014 Soybean Starter Study.
Take home from year one was that at LCB the addition of a starter fertilizer had little benefit and if done wrong could cost you yield while at the low pH site of Perkins an addition 2.5 gallons of APP did get a 5 bpa bump, but do to variability in the trial the increase was not statistically significant. This year we will drop some of the treatments and incorporate a few new treatments. Based on the current weather we look to potentially being able to start with better soil moisture at planting. Again do not take this work and significantly adjust any plans you have for your 2015 soybean crop. This is however some interesting findings that I wanted to share and make everyone aware of. Finally thank you to the Oklahoma Soybean Board for providing funding for this work. www.oksoy.org/
