Home » Nitrogen (Page 2)
Category Archives: Nitrogen

Management of soybean inoculum
Josh Lofton, Cropping Systems Specialist
Brian Arnall, Precision Nutrient Management Specialist
Soybean, a legume, can form a symbiotic relationship with Bradyrhizobium japonicum (Kirchner, Buchanan) and create their N to supplement crop demands. However, this relationship depends upon these beneficial microorganisms’ presence and persistence in the soil. This specific strain of microorganisms is not native to Oklahoma and thus must be supplemented using inoculum as a seed treatment. However, the use of inoculums alone does not guarantee a successful relationship. Handling, storage, soil conditions, and other factors can impact the ability of these microorganisms to do their job.
Soybean nitrogen demand is high, with most reports indicating that soybeans need 4.5 to 5.0 pounds of nitrogen per bushel of grain yield. This means that a 30-bushel crop requires between 135 and 150 pounds of nitrogen per acre (in comparison, corn and wheat need only 0.8 or1.6 pounds, respectively). This relationship has been shown to supply an equivalent of 89 lbs of N to the soil. In the previous example, these bacteria could fulfill 50-90% of nitrogen demand, reducing input costs significantly.
However, the bacteria associated with soybean inoculum are living organisms. Therefore, the conditions they experience before being applied to the seed and after treatment (including both before and following planting) can significantly impact their relationship with the soybean plant and, thus, their ability to provide N to the plant. By introducing a high concentration of bacteria near the seed and emerging root, this symbiotic relationship is more likely to be established quickly.
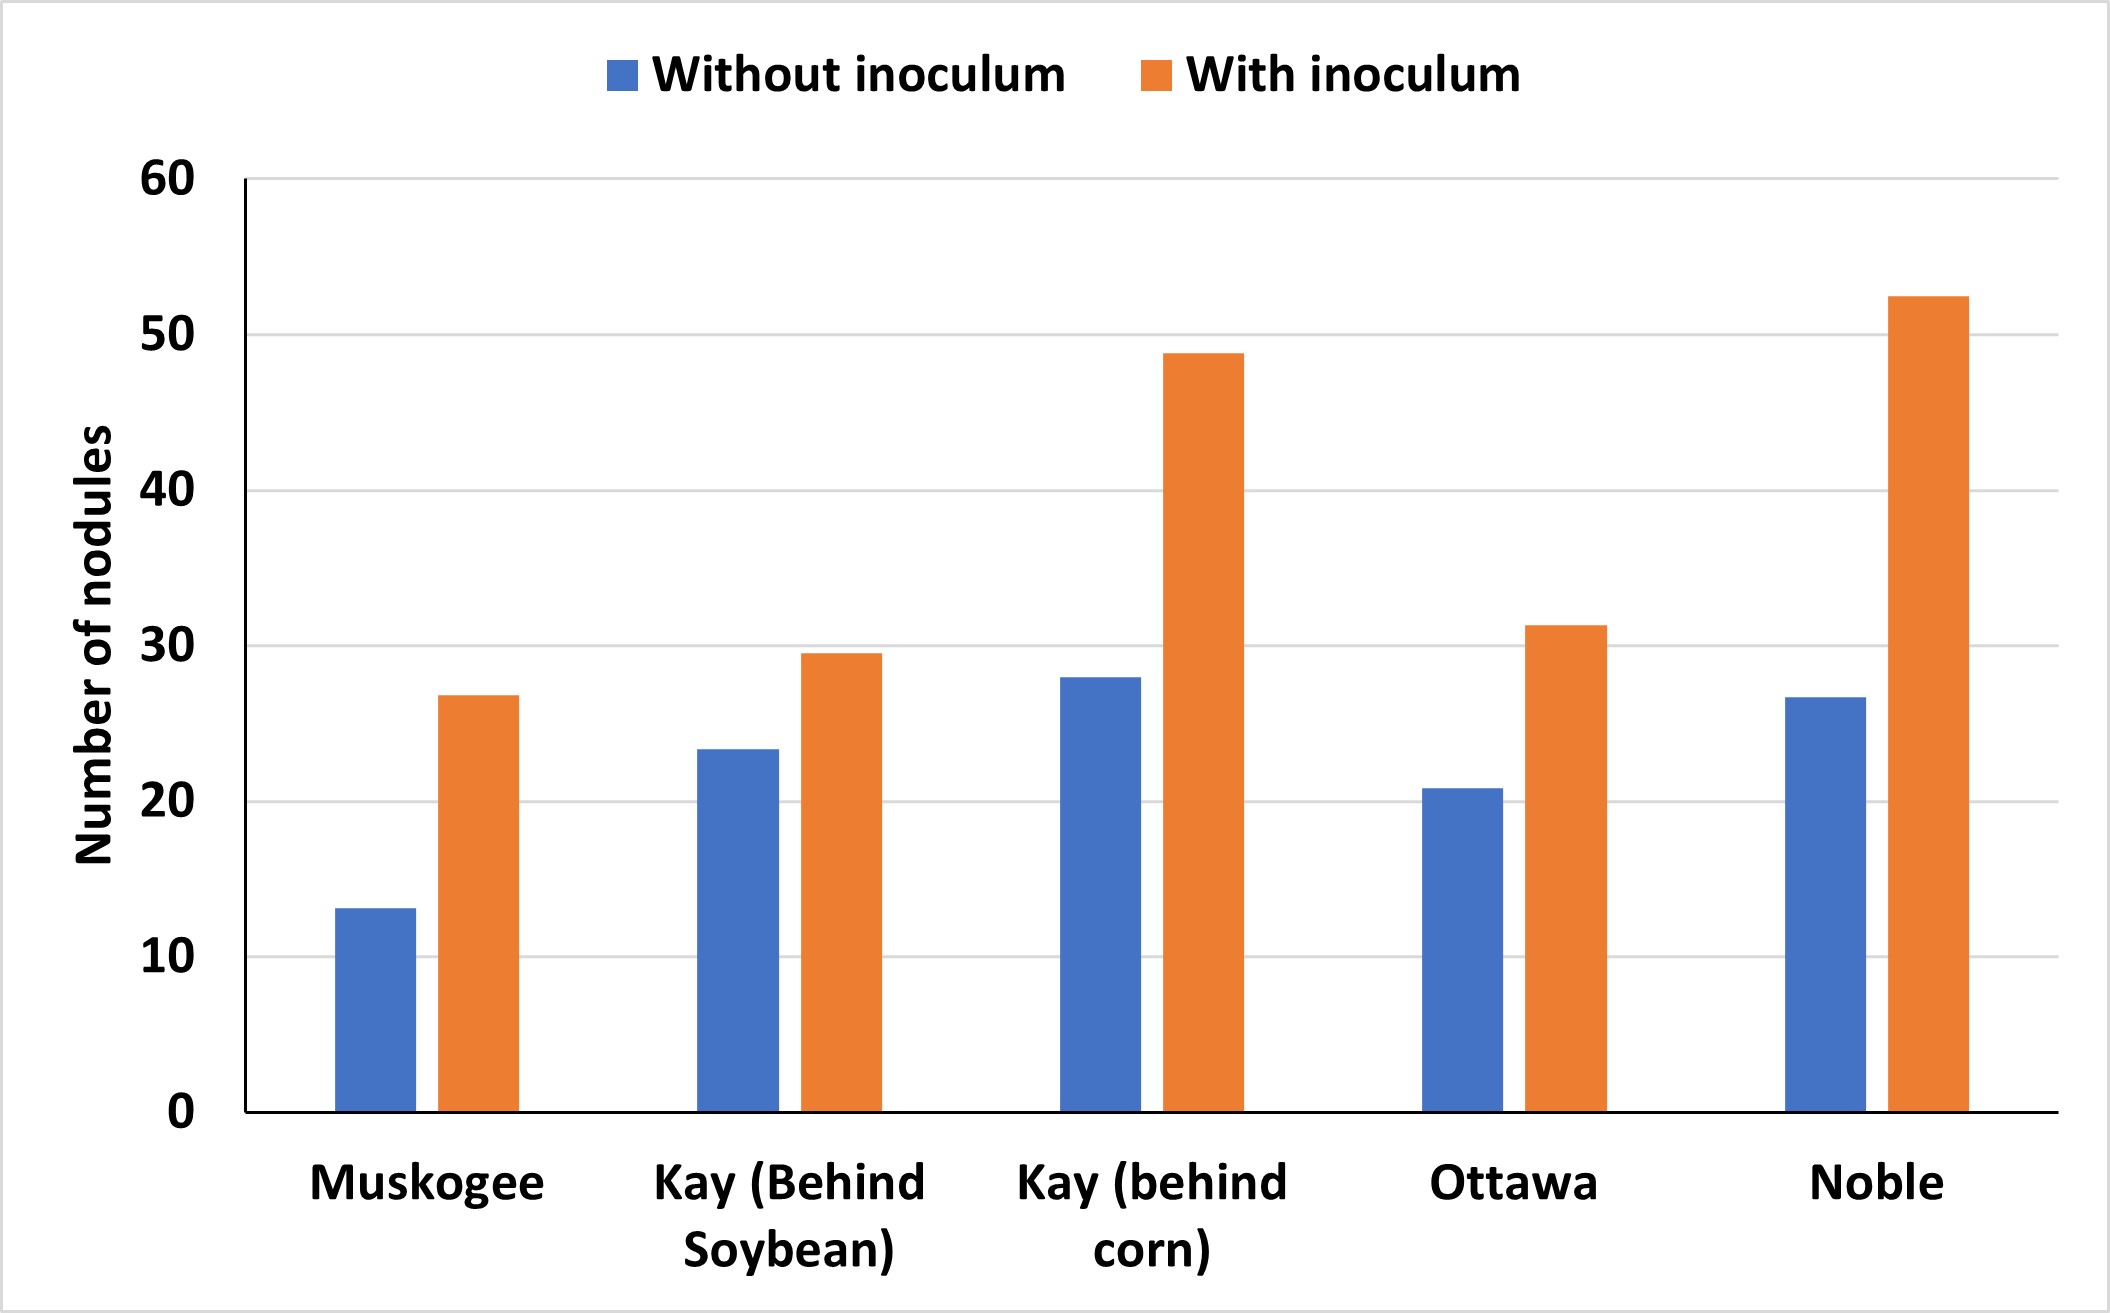
The importance of using inoculum is often debated in Oklahoma, particularly given the fluctuating prices of commodities and inputs. A recent assessment of various soybean-producing areas throughout the state revealed that most fields experienced advantages from incorporating soybean inoculation (Figure 1).
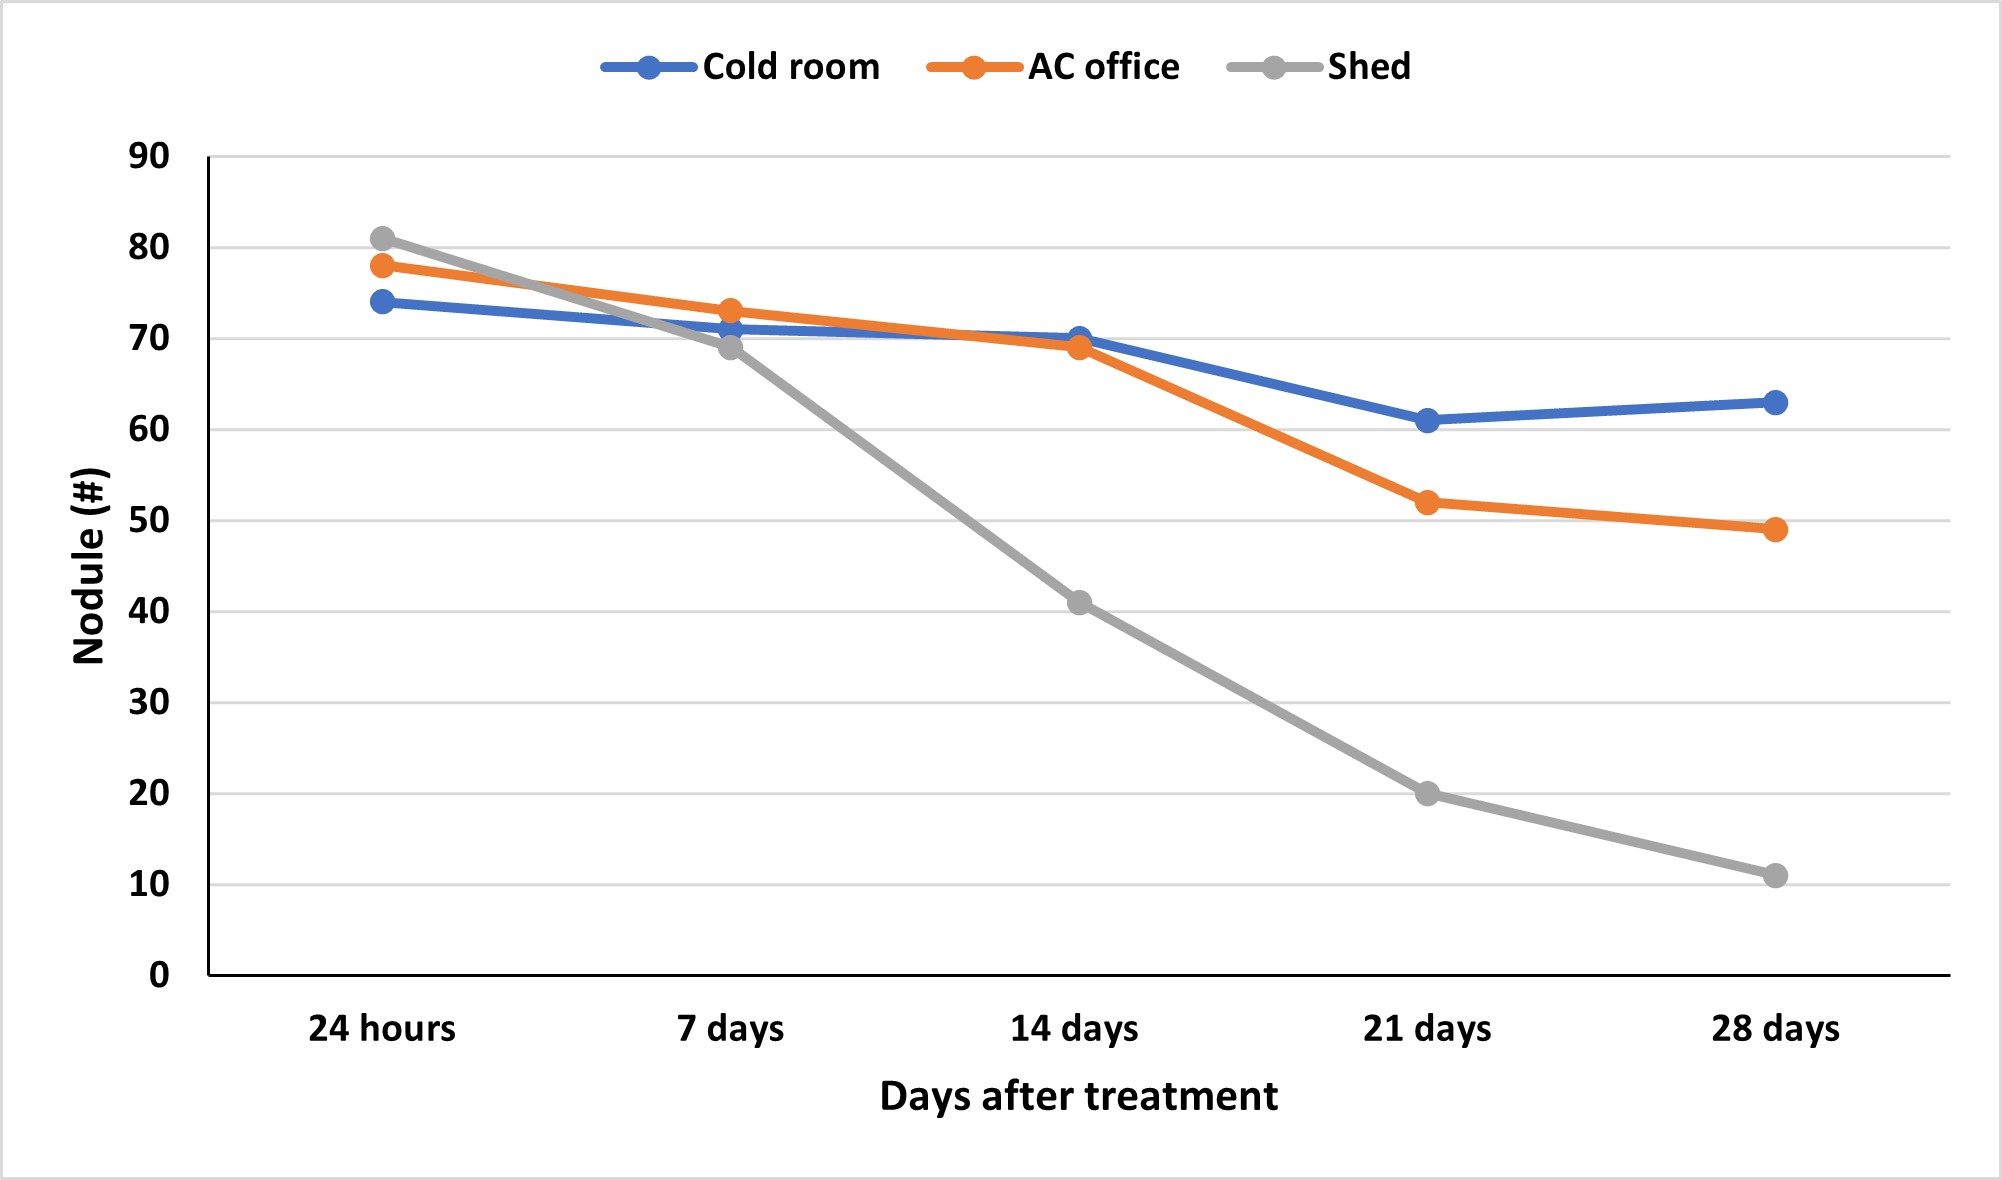
These benefits can be seen when the inoculum maintains viability until it is planted. It is always recommended that the bacteria be stored in a cool, dark environment before application on the seed. These conditions help preserve the survival of these bacteria outside of the host relationship. An evaluation of soybean inoculant after being stored short-term in different conditions found that in as little as 14 days, viability can decrease when kept in non-climate-controlled conditions (Figure 2). Additionally, viability was further reduced at 21 days when stored at room temperature compared to a refrigerated system
However, conditions colder than this, such as the use of a freezer, can compromise survival as well. Storing inoculum in the freezer forms ice crystals within the living cells and damages the cell membranes, making the microorganisms less likely to be alive upon rethawing. Additional chemicals can be added to increase the viability of long-term storage and sub-freezing temperatures. From an application standpoint, a new product should be purchased if additional storage is needed beyond short-term storage.
An additional question frequently arises: “How often should I inoculate my soybean?” As mentioned, these bacteria are not native to Oklahoma. As a result, they are not well adapted to survive in our environment and must outcompete native populations in the soil. Additionally, periods of hot and dry conditions appear to reduce the bacteria’s ability to survive without a host, the soybean roots. These are conditions we often observe in Oklahoma systems. Therefore, inoculation should be applied with every soybean planting to ensure a sufficient population of these bacteria. These bacteria promote root nodulation and nitrogen fixation in the soil.
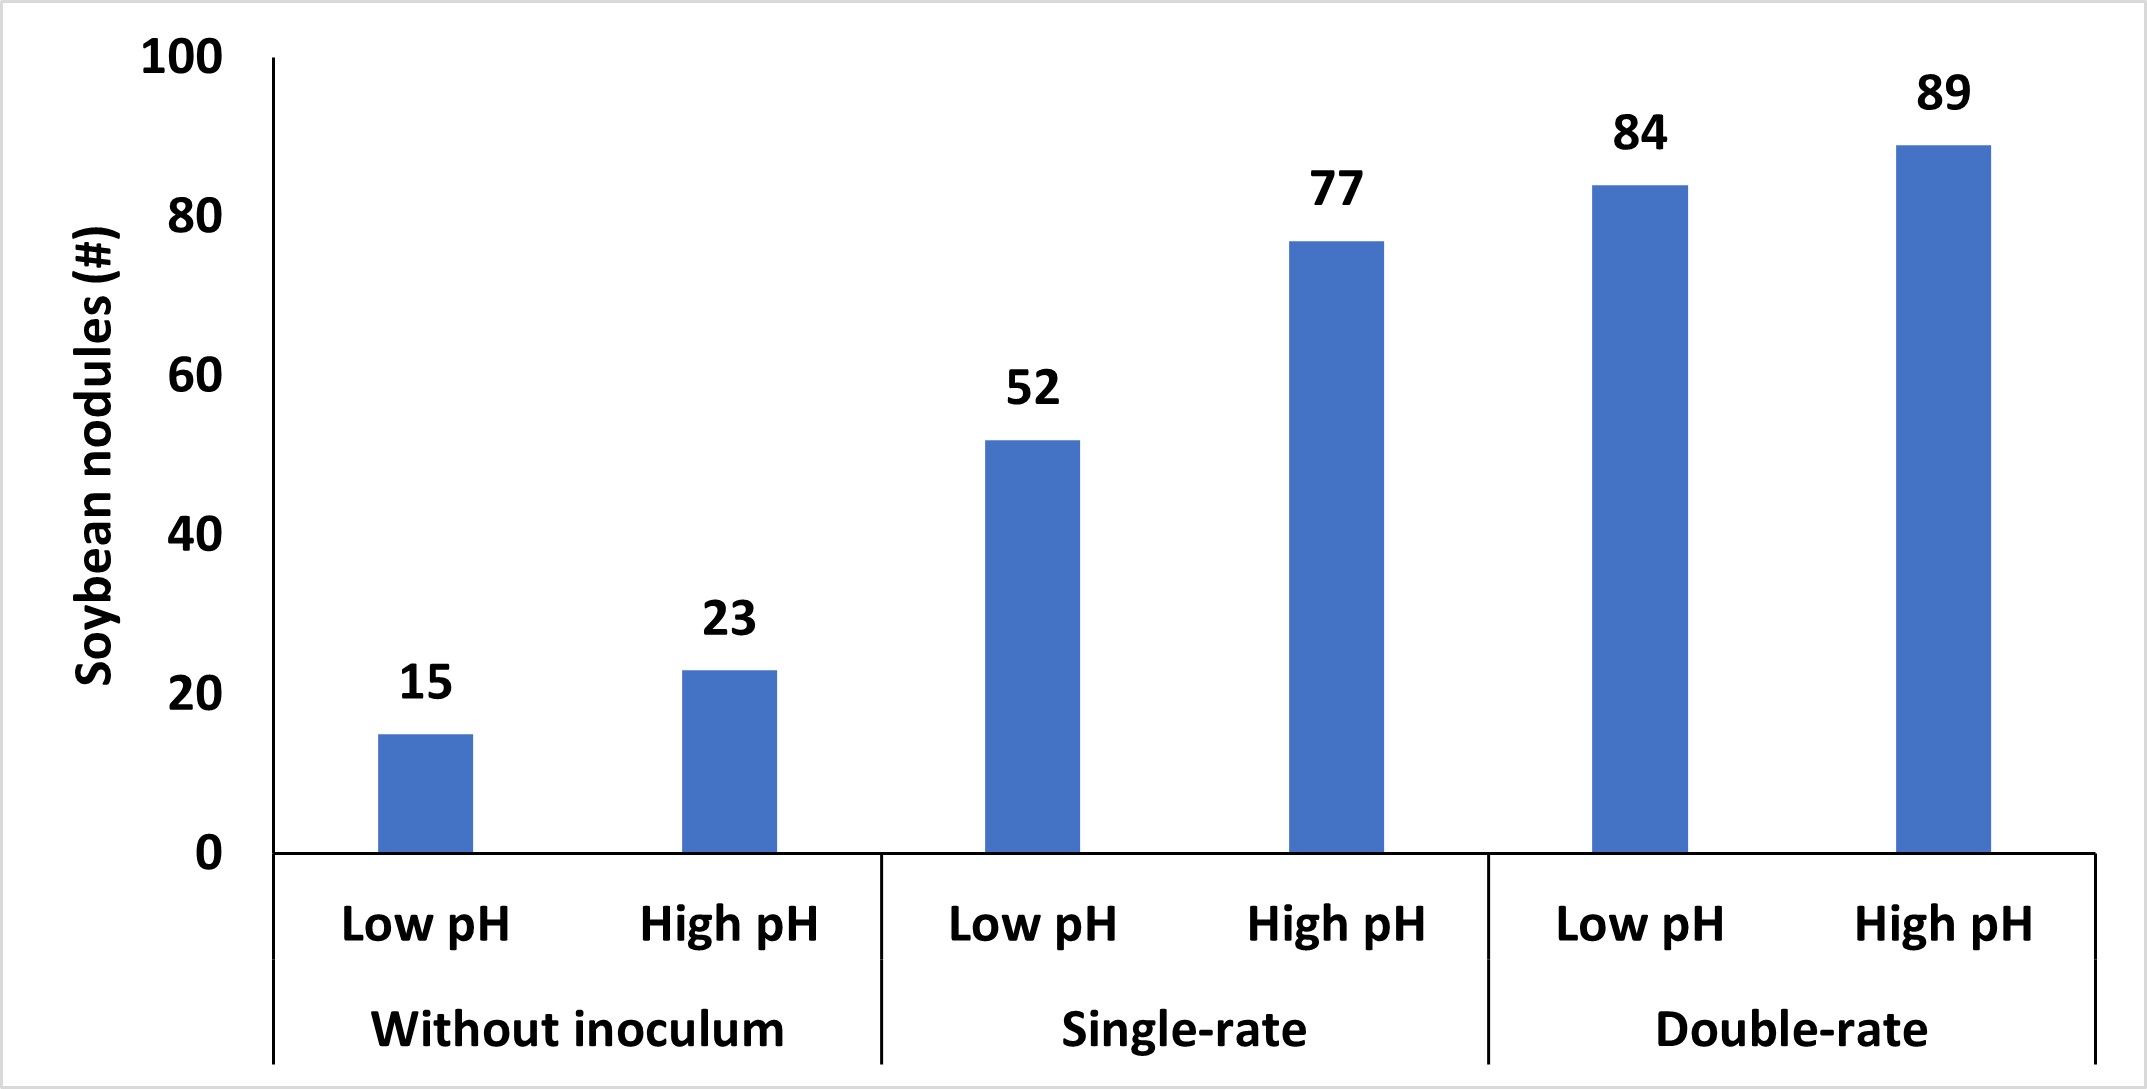
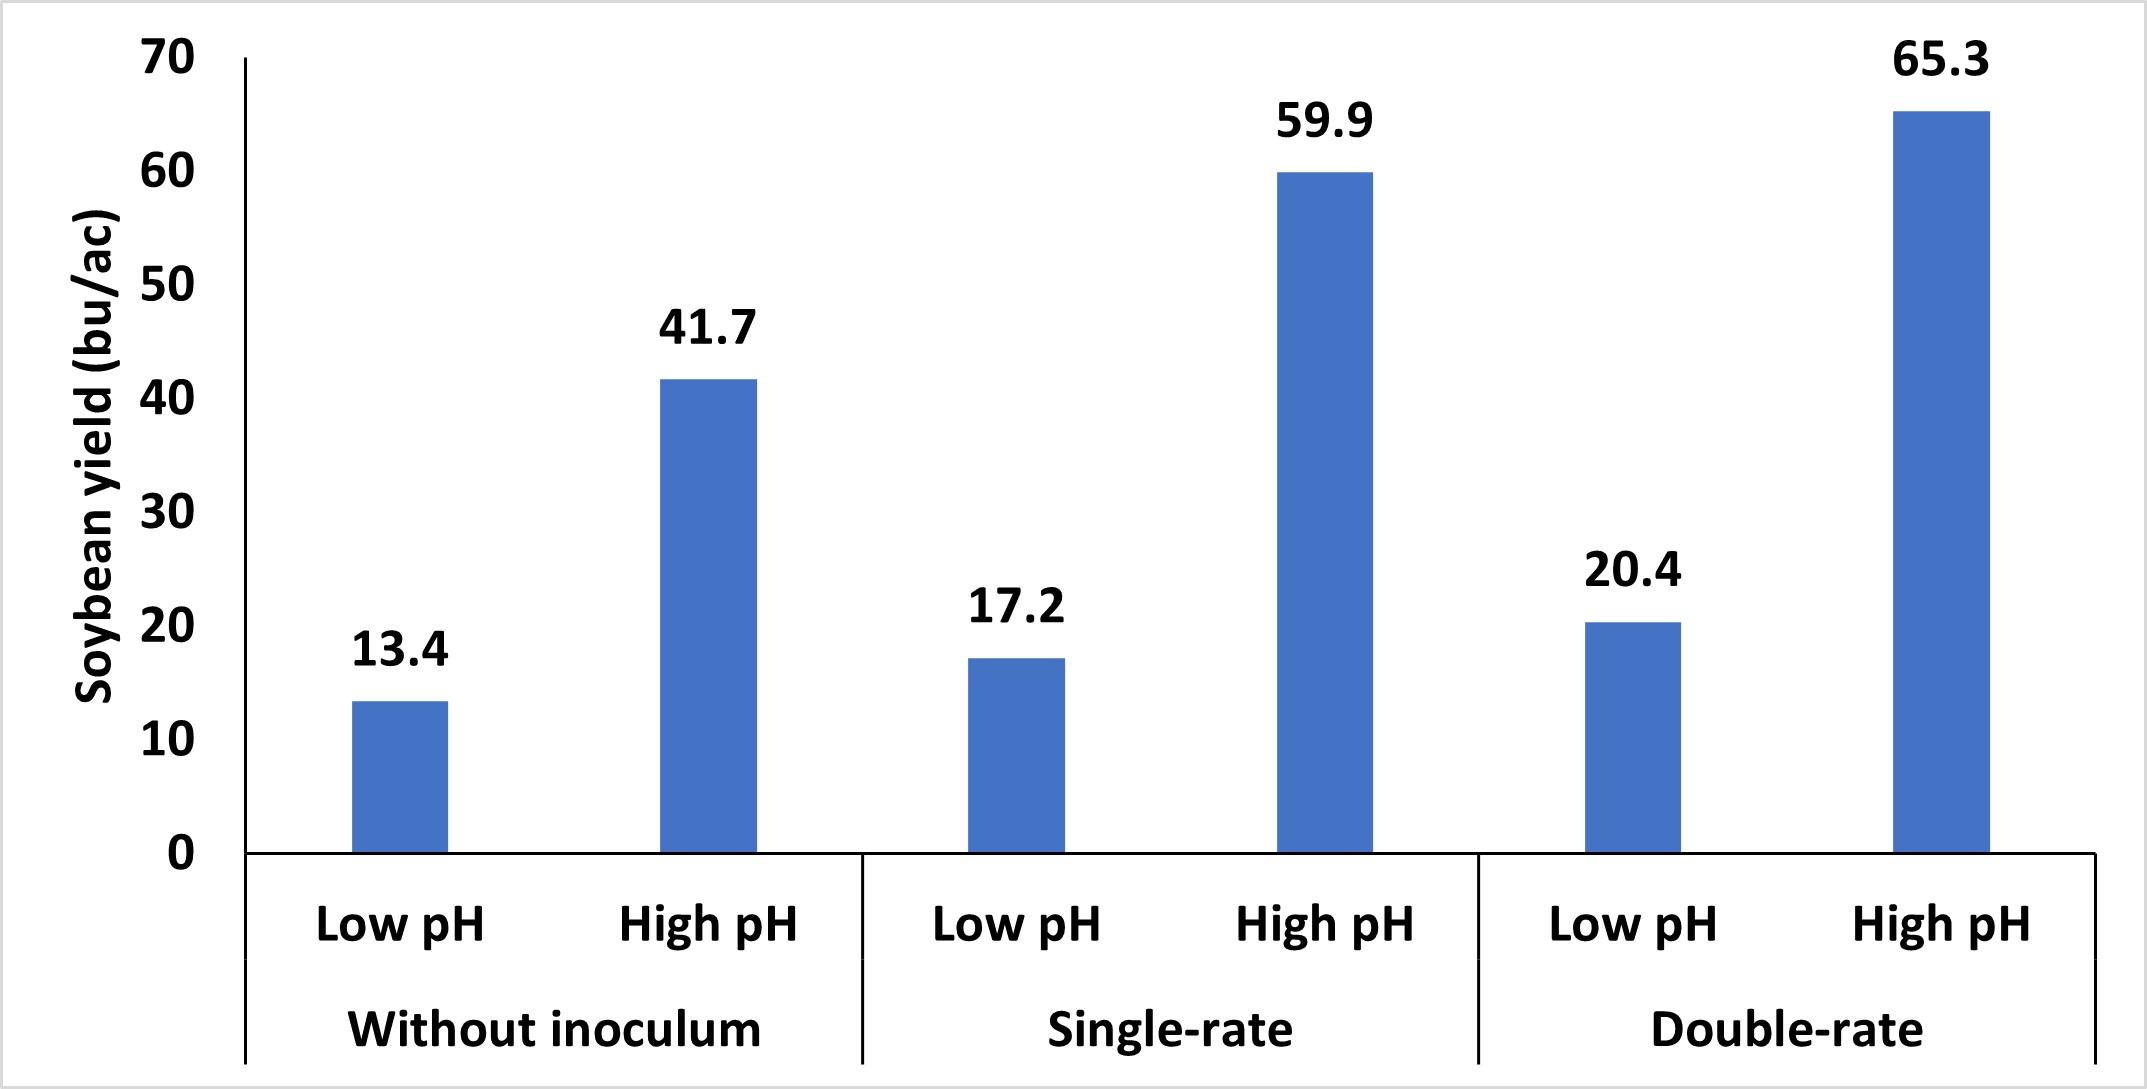
Other soil conditions, such as excessively dry or wet soils, high or low pH, and residual nutrients, can also impact the persistence of these microorganisms. Of these, soil pH has the biggest impact on the survival of these bacteria. High pH is less of a concern to Oklahoma production systems; however, soil with lower pH should be remediated. Like many bacterial systems, these bacteria optimally function at a pH range that closely resembles the ideal pH range for most crops. Lowering the soil pH below a critical threshold reduces the viability of the bacteria, hampers N-fixation processes, and diminishes the capacity of both the bacteria and soybean plants to form and maintain this relationship. While applying inoculum to soybean seeds in these adverse soil conditions can provide some advantages (Figure 3), but it often doesn’t increase yields. Therefore, inoculation with corresponding adjustments to soil pH represents the best approach.
While using inoculum is not a new concept, it is important to highlight the benefits it can provide when utilized correctly. The potential to reduce N input costs is attractive, but the effectiveness depends on proper handling, storage, and soil conditions until it can intercept the host. To maximize benefits, inoculum should be stored in a cool, dark environment and utilized in a timely manner. If there is doubt that there are not enough bacteria, an inoculum should be added. Oklahoma’s climate, particularly hot and dry conditions, can limit bacteria survival, reinforcing the need to treat the inoculum until it is in the ground carefully. Additionally, considering the soil environment is important to sustain the population of bacteria until it can inoculate its host. Emphasis on these small details can have a large impact on the plant’s ability to fix nitrogen and optimize productivity throughout the growing season.
TAKE HOMES
* Soybean requires more lbs of N per bushel than most grain crops.
* Soybeans symbiotic relationship with rhizobia can provide the majority of this nitrogen.
* Soybean rhizobia is not native to Oklahoma soils so should be added to first year soybean fields.
* Inoculum should be treated with care to insure proper nodulation.
* Due to Oklahoma’s climate and existing soil conditions rhizobia may not persist from year to year.
Any questions or comments feel free to contact Dr. Lofton or myself
josh.lofton@okstate.edu
b.arnall@okstate.edu
Appreciation of the Oklahoma Soybean Board for their support of this project.
A comparison of four nitrogen sources in No-till Wheat.
Jolee Derrick, Precision Nutrient Management Masters Student.
Brian Arnall, Precision Nutrient Management Specialist.
Nitrogen (N) fertilizer’s ability to be utilized by a production system is reliant upon the surrounding environment. The state of Oklahoma’s diverse climate presents unique challenges for producers aiming to apply fertilizers effectively and mitigate the adverse effects of unfavorable conditions on nitrogen fertilizers. To lessen the effect that unfavorable environments can have on N fertilizers, chemical additions have been introduced to base fertilizers to give the best possible chance at an impact. With that in mind, a study was conducted to investigate the impact of N sources and application timings on winter wheat grain yield and protein, aiming to identify both the agronomic effects of these sources and how variations in their timing may influence the crop. Included below is a figure of where and when the trials were conducted.

In each of the trials, four N sources (Urea, SuperU, UAN, and UAN + Anvol) were analyzed across a range of timings. The sources were categorized on two criteria: application type, distinguishing between dry and liquid sources, and the presence of additives versus non-additives. The two N sources were Urea and UAN. The other products in this study were SuperU and Anvol. SuperU is a N product that has Dicyandiamide (DCD) and N- (n-butyl) thiophosphoric triamide (NBPT) incorporated into a Urea base. Anvol is an additive product which contains NBPT and Duromide and can be incorporated with dry or liquid N sources.
For additional clarification, N- (n-butyl) thiophosphoric triamide is a urease inhibitor which prevents the conversion of urea to ammonia. Duromide is a molecule which is intended to slow the breakdown of NBPT. DCD is a nitrification inhibitor that slows the conversion of ammonium to nitrate.
Urea is a stable molecule which in the presence of moisture is quickly converted to stable ammonium (NH4), however it can be converted to ammonia gas (NH3) by the enzyme urease beforehand. Additionally, when urea is left on the soil surface and not incorporated via tillage or ½ inch of a precipitation event, the NH4 that was created from urea can be converted back to NH3 and gasses off. So, the use of urease inhibitors is implemented to allow more time for incorporation of the urea into the soil.
Ammonium in the soil is quickly converted to nitrate (NO3) by soil microbes when soil temperature is above 50F°. When N is in the NO3 form it is more susceptible to loss through leaching or denitrification. Therefore, nitrification inhibitors are applied to prevent the conversion of NH4 to NO3.
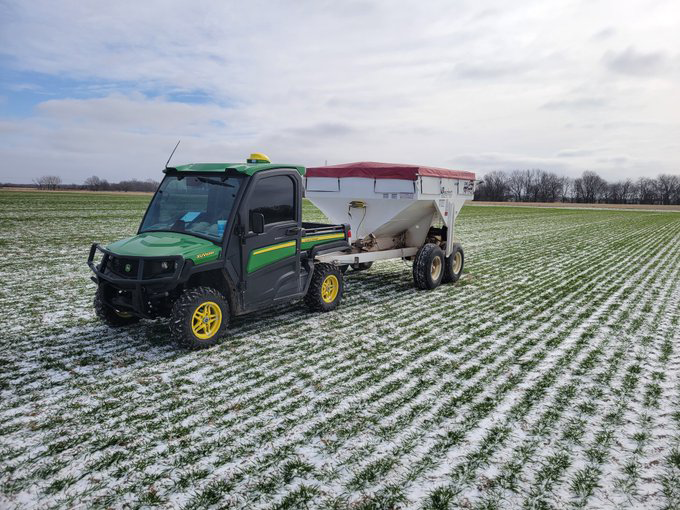
All treatments were applied at the same rate of 60 lbs of N ac-1, which is well below yield goal rate. A lower N rate was chosen to allow the efficacy of the products to express themselves more clearly, rather than a higher rate that may limit the ability to determine differences between product and rate applied. Furthermore, dry N sources were broadcasted by hand across the plots while liquid sources were applied by backpacking utilizing a handheld boom with streamer nozzles. Application timing dates were analyzed by identifying the growing degree days (GDD) associated with each timing which were correlated with the Feekes physiological growth chart displayed in Figure 3. Over the span of the study, N has been applied over six stages of growth. The range of application dates stems from the fact that it is difficult to get across all the ground exactly when you need to.


Over four years this study was replicated 11 times. Of those 11 site years, three did not show a response to N, so they were removed from further analysis. The graph above shows the average yield of each respective source (across all locations and timings). The data shows there is a statistical difference between SuperU and Urea vs. UAN, but no statistical difference between UAN treated Anvol and any other source. The data indicates that on average, a dry source resulted in a higher yield than when a liquid source was applied. This makes sense considering that in many cases, wheat was planted in heavy residue during cropping seasons that experienced prolonged drought conditions. Therefore, it is thought that a liquid source can get tied up in the residue. This was first reported in a previous blog posting, Its dry and nitrogen cost a lot, what now?, and years later, the same trends in new data indicate the same conclusion.

If we look at all timings and site years averaging together there is no statistical difference between a raw N source and its treated counterpart. This result is not surprising as we would expect that not all environments were conducive to loss pathways that the products prevented. Basically, we would not expect a return on investment in every single site year, and therefore you do not see broad sweeping recommendations. There was a 2-bushel difference between UAN and UAN Anvol. As this was a numerical difference, not a statistical one, I would say that while the yield advantage was not substantial there may be economic environments that would suggest general use.

While the evaluation of the four sources across all timings and locations showed some interesting results, this work was performed to see if there was a timing of application which would have a higher probability of a safened N returning better yields. As you look at the chart above it is good to remember the traditional trend for precipitation in Oklahoma, where we tend to start going dry in November and stay dry through mid-January. Rain fall probability and frequency starts to increase around mid-February, but moisture isn’t consistent until March. This project was performed during some of the dryest winters we have seen in Oklahoma. Also, just a note, since the graph above combines all the sites that have differing application dates the absolute yields are a bit deceiving. For example, the Nov and Feb timings include the locations with our highest yields 80+ bpa per acre, while January and February include our lowest. So, the way this data is represented we should not draw conclusions about best time for N app. For that go read the blogs Impact Nitrogen timing 2021-2022 Version and Is there still time for Nitrogen??


Figure 6a and b. A: The mesonet rainfall totals for Oct -Dec for the Lake Carl Blackwell research station for 2020-2023 A: The mesonet rainfall totals for Jan – April for the Lake Carl Blackwell research station for 2021-2024. The black line on both graphs is the 10 year average.
Now about the source by time. While it’s not always statistical you can see that the dry sources tend to outperform the liquid sources at most timings. Also, while there is never a statistical difference in the raw product and safened, there are trends. SuperU tended to have higher yields than urea when applied in Nov and Dec. It could be hypothesized that the addition of a nitrification inhibitor may have added value, however the UAN + Anvol in November also showed a positive response that would point to the value being derived from urease inhibition. As we move into the period of more consistent rainfall the differences between products start declining, which also makes sense.
The following figures illustrate rainfall events following N application, with the application dates indicated by arrows. Figure 7 corresponds to our trial conducted in 2020-2021, which revealed no statistical differences among the N sources for any timing. However you can see that for the first timing (orange bars) which received 0.7″ of rain two days after application that the yields are uniform than the grey bars with both safened products are numerically greater than the raw product, just makes since as a 0.1″ precipitation event happened 6 days application application and it wasn’t until day 9 that a good incorporating rainfall occurred.

Figure 8 has data the same location one year later, during which we observed statistically significant differences among the dry and liquid N sources. The environmental conditions during 2022 were drier, impacting the incorporation of N applications. The lack incorporating rainfall likely led to tie-up of the UAN on/in the residue, limiting access to plant available N.

It is essential to highlight the environmental conditions encountered throughout this project. From 2020 to 2023, moderate to extreme drought conditions were prevalent. During this period, the influence of a La Niña led to reduced moisture availability. For the first time in an extended period, the 2023-2024 wheat year began under a strong El Niño, which typically results in increased moisture accumulation compared to its La Niña counterpart. Currently, there are indications that a return to a La Niña system may occur by the end of the year, raising the expectation of a potential reversion to drought conditions. Consequently, this research may provide producers with options to consider regarding sources of N application in their production systems.
We plan to update this blog with a deeper analysis of the results seen at each location as soon as possible. But for now, we wanted to share the early look.
At this point the reason for the liquid yield gap is speculation. It could be increased loss via ammonia volatilization or it could be immobilization of the N by microbes. The next step of this process is to understand 1) is the UAN tied up in the residue via immobilization via microbes or is it lost to volatilization. 2) If tied up, what is the time frame between application and immobilization.
Take Home:
- It was observed that during low moisture conditions, dry N sources had significantly better results than liquid counterparts in no-till winter wheat production.
- On average, additive products had no significant impact on grain yield versus base fertilizers, however, when evaluated by location, differences could be found. Responses usually correlated with post-application weather conditions.
- When adequate precipitation was received shortly after application, N sources did not show differences.
Any questions or comments feel free to contact me. b.arnall@okstate.edu

How do you handle your soil sample….
It’s that time of year where wheat producers are in all stages of prep across the state, the graze out folks are wondering when the rains will hit to get the dusted in wheat up and the grain only folks are prepping grain drills or dealing with summer crop harvest. While this blog is focused on the wheat producers it should be acknowledged as a work of caution for anyone who pulls soil samples in environments where the temps during sampling can be above the mid 80’s.
Following some fantastic work by our Wild Cat Soil Fertility Counterparts (see blog) we dug into the same question of how does soil sample handling post collection impact the results. Dr. Ruiz-Diaz results on the impact of storage on nitrogen values was not surprising. But we wanted to go the next step and add in sample bag type.
Our Project
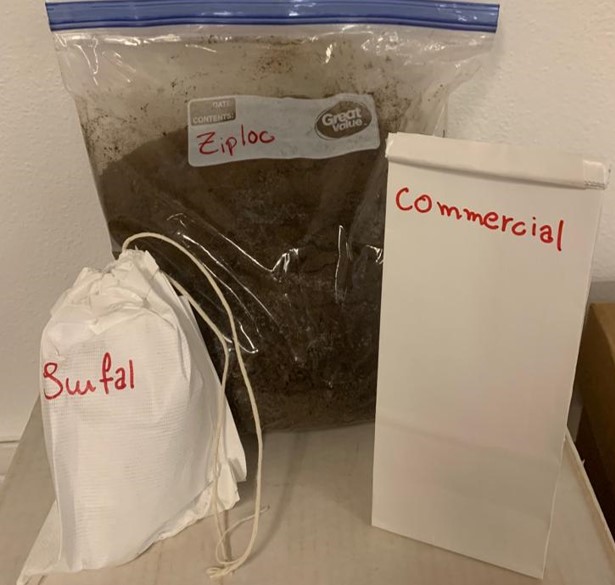
We collected a soil ground and homogenized. Placed in three types of bags Ziploc, Commercial (resin lined paper that is closed) and SWFAL bag (breathable material). Placed samples in a mini-van (Field) and brought a group onto campus (Office). With both sets of samples we had temperature loggers collecting hourly data. Every three days we collected four samples from each location determined moisture content and ran a full spectrum soil analysis including CO2 burst. The soil we used had a OM of 1.1% and soil pH of 6.1
Now let’s back up. Why was the KSU data not surprising. Well for those certified and honorary nitrogen ninjas we understand that the N-cycle processes of mineralization, immobilization, and nitrification are biological reactions which are significantly impacted by soil moisture and soil temperature. But the short and quick version is that the microbes that convert organic N to mineral N (NH4) and convert NH4 to NO3 like warm conditions with good soil moisture. So, when you pull soil samples, hopefully there is some moisture in the soil and then you place it in a bag and seal it. This creates an effective greenhouse environment where moisture cannot escape and is the perfect place for microbes to microbial things. Therefore, you expect the organic cycle and nitrogen cycle to move and move quickly through the processes of mineralization, ammonification, and nitrification.
Back to the data.
First, we have the average daily temperatures from the sitting vehicle and the lab. On days 2-5 the average temp of the van was over 100°, after that the temps dropped. One thing to remember is the temp of the van is an average of a wide-ranging highs and lows between morning and midday while the office temperature being stable throughout the entire day.


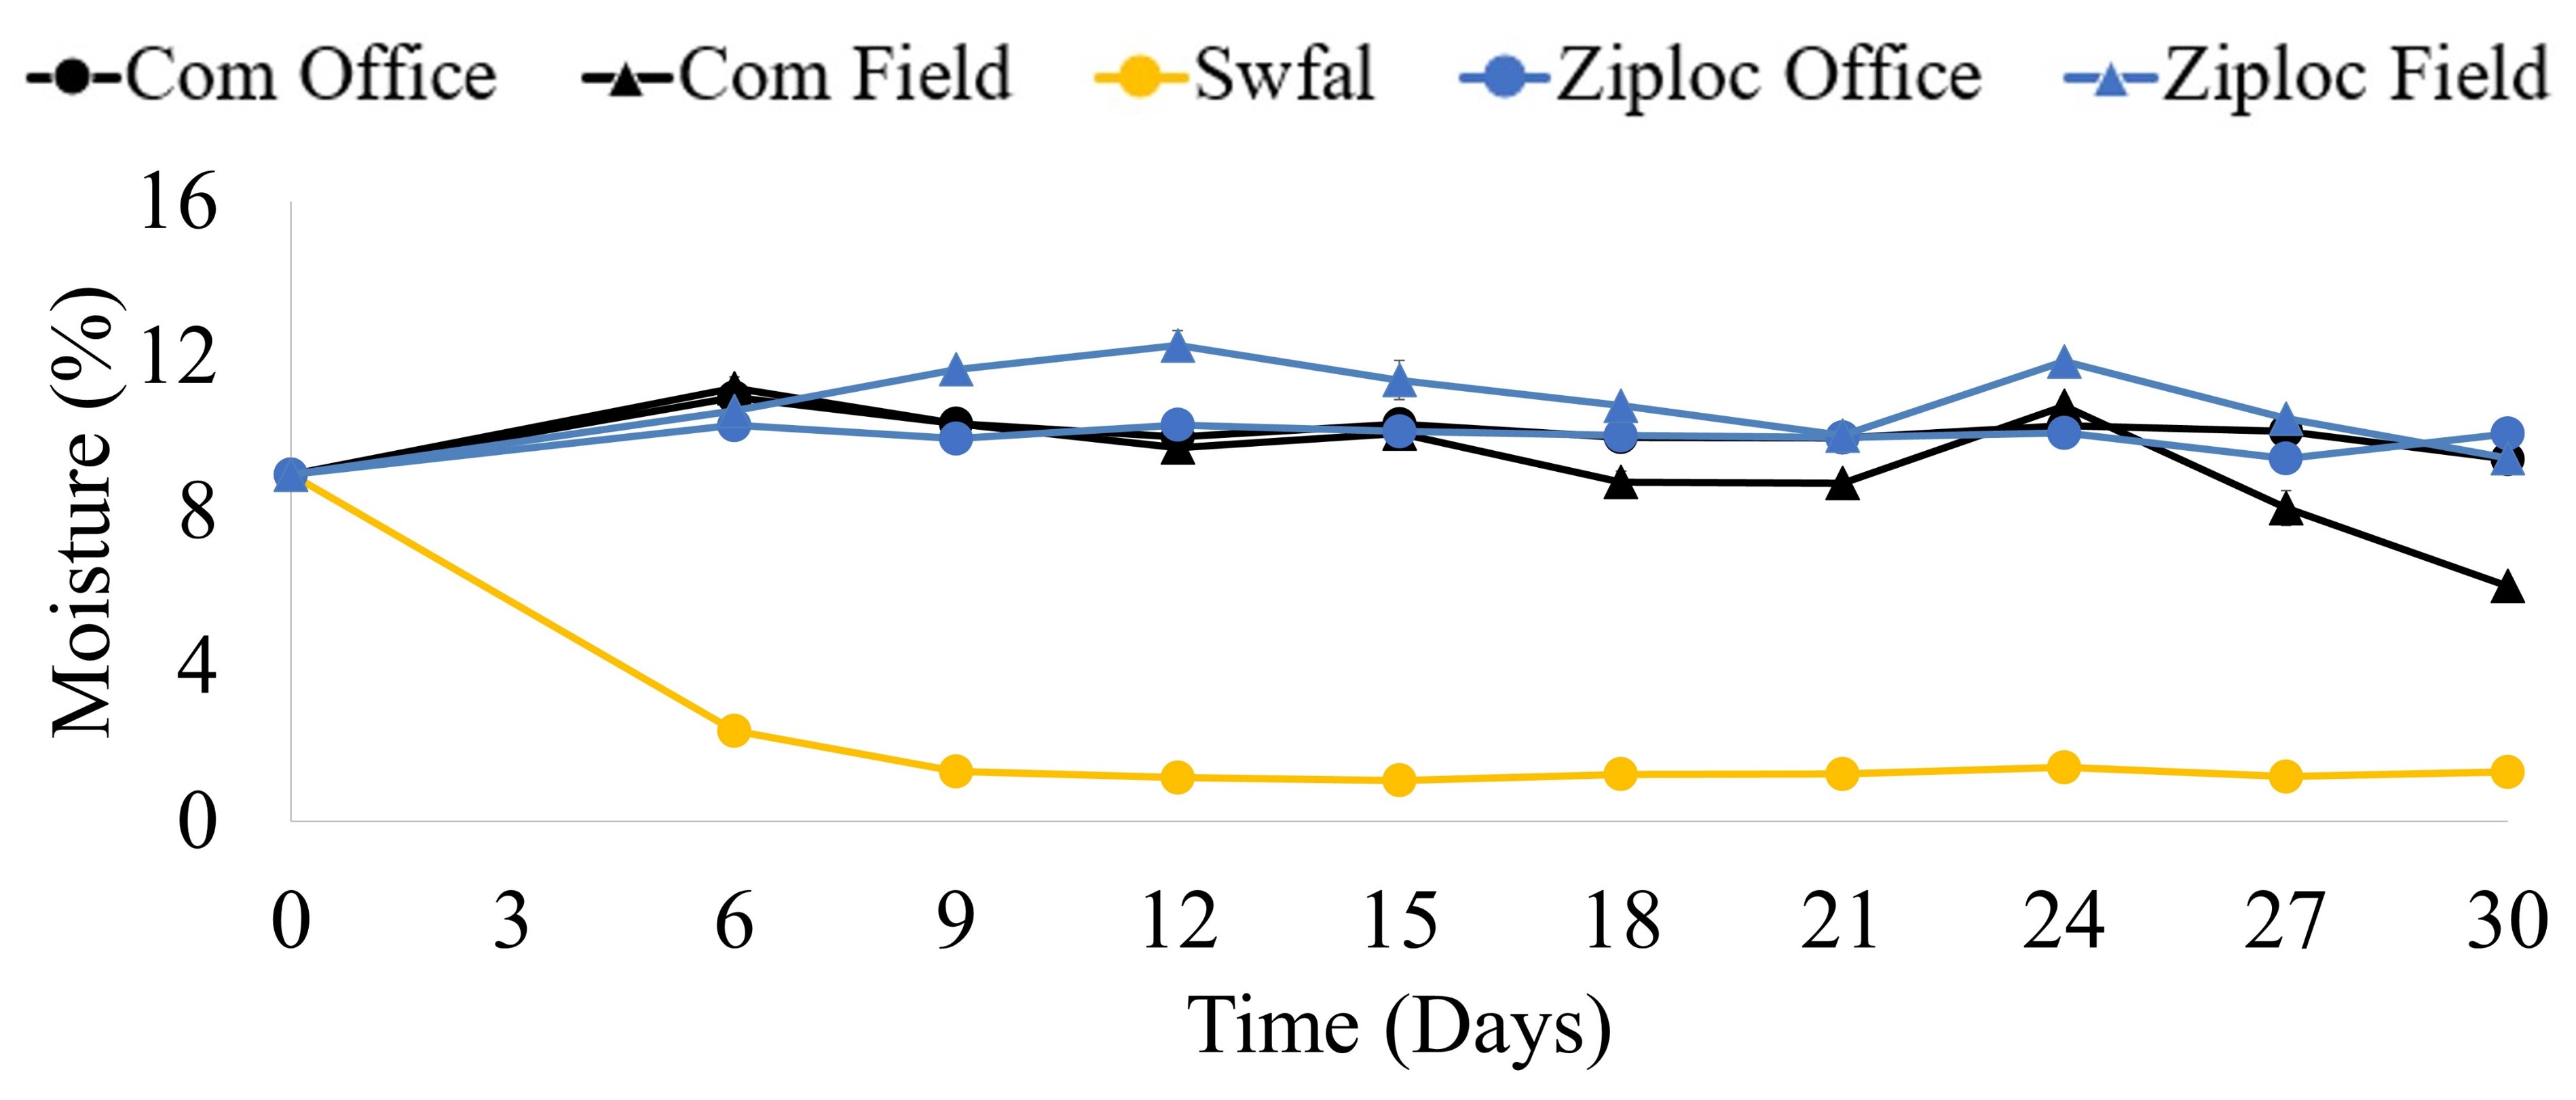
What is the most interesting and revealing data may be the soil moisture of the samples. Unfortunately, day 3 samples went straight to the oven, but you can see by day 6 the SFWAL bags (yellow line) had dried significantly while it wasn’t until day 27 did the Commercial bags in the van (Black line w/ triangle) show signs of drying. It’s also important to note that while there are two lines (Field and Office) for the Commercial bags and Ziploc bags, but only one for the SWFAL bags. That is because for all variables measured there was never a significant difference between the SWFAL Field value and the SWFAL Office value.

We are going to start off with the variable that changed the most, NO3-N. This is also the form of N that is measured in most soil test. With a starting point of 3.4 lbs. N ac-1 (based on a six inch soil sample depth) by day 6 the Field samples had jumped to 15.6 lbs. The office samples had much slower increase in NO3 with it taking 9 days to reach 10 lbs. You can also see that the error bars start showing up in the samples after about two weeks. The bars show the range in the sample results of a treatment. The interesting thing we saw was that the location within the van was significant. We set each replication of samples in a different spot in the van, the front seat, middle seat, and rear. The thermometers set with each replications showed that each area of the van had slightly differing temperature, which in turn affected the samples.

Ammonium (NH4-N), which is only reported by a few labs is also impacted by the storage location and bag type, however not to the sample level as NO3-N. Effectively the SWFAL bags and all samples taken to the office maintained consistent NH4 levels. The Com bag and Ziplocs left in the van however saw a significant increase in NH4 over time, basically a 2 lb per day increase.

Of the other measured parameters such as potassium, sulfur, and CO2 burst data were effected. These will be discussed more in depth in a peer reviewed publication and factsheet.
Take Home’s from the Work
While the majority of the nutrients were relatively un affected by the bag type or storage those that are more heavily influenced by organic matter and biological activity where, this includes many of the soil health parameters. The use of SWFAL soil bags resulted in data that was not impacted by storage or time. While most clients of the OSU lab use these bags, more than one samples been brought into the county via a sealed Ziploc baggie. However the majority of the soil samples collected are placed into the resin lined paper bags and sealed. This data set is also important to those who use laboratories that run the Haney test which includes measures of NO3, NH4, Organic N, CO2 respiration and H2O extracted Organic C. It is critical that when using these type of bags that the samples be brought into climate controlled facilities as soon as possible. Its good to remember when looking at the data that the soil we used had a OM of 1.1%, initial NO3 of 3.4 lbs. and NH4 of 14 lbs. A soil with a higher OM% could have even greater change. Another viable is if the soil sample depth is greater than 6”. If your sample depth is 8” then the value is 33% higher.
Questions or comments feel free to reach out via email or social media.
Brian Arnall, Precision Nutrient Management b.arnall@okstate.edu
Grain Sorghum, 2023 edition
As I sit in my office writing this I am seeing the chances for Stillwater to get a good rain today slowly dwindle away. Last night we had a 75% chance of 0.56. Its now 3pm we have received 0.01 and have a 60% chance of getting an additional 0.10. And as this is how 2023 has gone, but we are still better off than so many west and north of us.
No some of the zeroed out wheat ground and winter fallow ground has seen its first moisture in 100+ days. Planters and drilling are rolling and or ready to roll. So I wanted to throw out a few thoughts and re-share an older blog.
In August of last year I was talking about how the extended drought was impacting organic matter and nitrogen cycling “Nitrogen cycle hiccups and a lot of drying“. Wish I could say things have changed since then but we all now otherwise. While we have moisture to plant and germ our H2O fuel tank is far from full. Its going to take significant rainfall to rebuild the soil profile, not to mention the ponds. And I can not forget how last year we had great rains in May and were going pineapple by the end of July. I had N response studies all over the state in sorghum, at every trial nitrogen was not a limiting factor.
By this point if you know me or have every read anything I have written in the past you should know what is coming. My recommendation for pre-plant N is 0.0 lbs. Go ahead and put a starter down where you have low P or pH that’s out of range, and Fe and/or Zn in the calcareous soils where needed, but that’s it. We are continually adding to the research data base that says sorghum responds exceptionally well to in-season nitrogen applications in some cases nearly all the way to boot stage. I believe we are close to determining/explaining why the crop does so well but not ready to share that work just yet.
I just do not have the trust in the what rains may come to spend money on a fertilization pass that has been proven to be less valuable. Get the seed in the ground and crop up, put out some N-Rich strips. Let the weather play out for a month or so and see 1) Do I have soil moisture to get me through harvest or am I living day by day on a hope and a prayer? 2) is my N-Rich strip showing?
For Question 1) if your living day to day is further investment in the crop warranted? If you have soil moisture and rain in the forecast, its time to rock and roll. For question 2) which I hope you take my advice on doing. If the N-Rich is showing up 30 days into the you can use some rough yield goal estimations and apply 1 lb N per bushel or go get access to a GreenSeeker sensor (available through OSU extension offices) and use OSU’s online calculator SBNRC. If the strips not showing up then you need to consider that a month into the crops growth the soil has supplied 100% of the crops N need. Depending on if you want to push yield or save N adjust your rec accordingly. I would say reducing planned N rate by 40-50 lbs would a legitimate option. There are more and more agronomist utilizing N strips in wheat and sorghum so you could check around.
Final thoughts.
The more I do research on N timing and N management the more I am finding that there are some great benefits to limiting early N availability to the crop. To the point were I am finding and increasing value of an early season N stress on crop performance and grain yield.
Now for rehashed research. Much like wheat, sorghum can and probably should wait for N.
Can Grain Sorghum Wait on Nitrogen? One more year of data.
Original Posting 4.7.2022
Michaela Smith, Ph.D. candidate under advisement of B. Arnall
Brian Arnall, Precision Nutrient Management Specialist
The impressive ability of sorghum to recover from significant N stress with late applied nitrogen was originally reported in the blog “Can grain sorghum wait on nitrogen”. This projected was replicated again in 2021 and these are the results. During the 2021 growing season, frequency of rainfall events and amounts were similar to the 2020 growing season. Figure 1. shows the application dates and rainfall events.


Statistically there was no significant difference in grain yield from the pre-plant (0) and any application up to the 56 day application. This data matches up quite well the yield results from 2020.

Looking and the current soil moisture conditions (Figure 3.) and fertilizer price I think this data supports the recommendation to get the seed in the ground and see how the situation plays out. If there are decent rains at and shortly after planting then there is time to apply nitrogen with little risk of yield loss. If fact the weather during late May and early June provide some of the best chances to getting the fertilizer rained in (Figure 4) . If the weather doesn’t cooperate and provide us the much needed rains, then by waiting to apply we are not left with a lot of Expensive nitrogen setting out in the field of a failed crop.
Final Thoughts Heading into the 2021 Sorghum Planting Season.
– Make sure you have a soil sample, knowing P and K will be critical.
– No need to front load N fertilizer, especially if soil moisture is short.
– Utilize in-furrow P if soil pH and or soil test P is low.
– If you skip pre-plant N APPLY N-RICH STRIPS!!!!
– If you apply pre-plant N consider applying 50% of the expected N or less.
– If you are applying any level of pre-plant N, Create Zero-N Strips.


For more information or questions contact
Brian Arnall b.arnall@okstate.edu 405.744.1722
Special thanks to EDC Ag Products Co LLC for suppling NH4NO3 used in the delayed N project.
Original Post March 22, 2022.
Data for this post available in thesis Impact of delayed nitrogen application in grain sorghum
Smith, Michaela Lynn (2021-05). Available at https://shareok.org/discover
Grain sorghum producers in Oklahoma are challenged greatly by their environment and sporadic rainfall patterns, which diminish as the season progresses. These uncontrollable variables influence timing of nitrogen (N) application and nitrogen use efficiency. Using rainfall events as an incorporation method forces producers to apply before the event regardless of its intensity or delay application until field conditions are acceptable while anxiously waiting for another rainfall event. When deciding to delay N application it’s important to know the effects on physiological development and grain yield.

Trial structure and breakdown
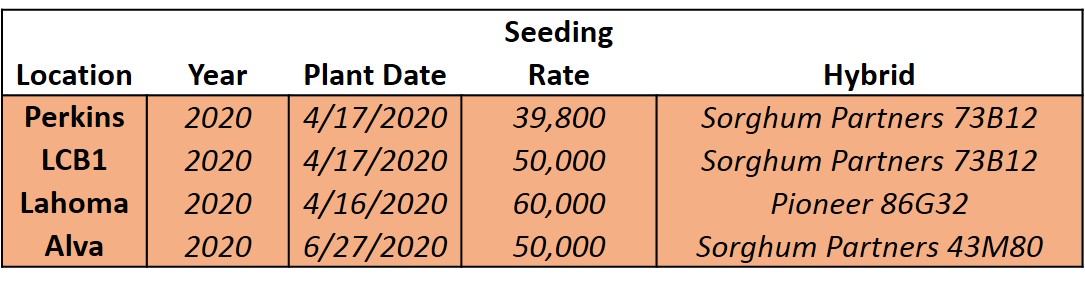
This study was conducted over the 2020 growing season consisting four locations, including one double cropping system following wheat. Ten in-season applications were made using ammonium nitrate (AN) as the N source at a rate of 90 lbs. ac. Using AN as the N source reduced the risk of nitrogen loss through the process of volatilization as the goal of the research was to test the plant not the fertilizer. A pre-plant treatment served as the standard check, while in-season applications were initiated at 21 Days After Planting (DAP) and applications made sequentially at 7-day intervals. A non-fertilized check was included to the study to confirm locations were responsive to N fertilized applications Hybrid, plant date, and seeding rate can be found in Table 1.
Physiological Response to Application Timing
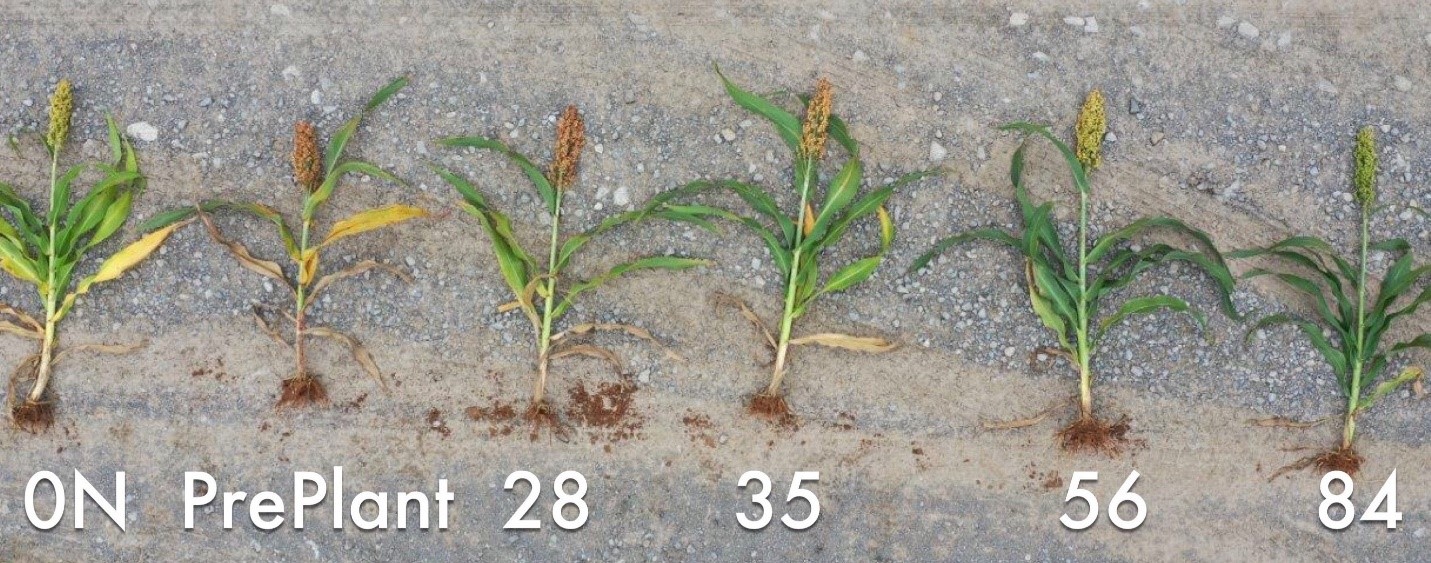
Two of the four locations demonstrated an effect to physiological development and maturity with the delay of nitrogen application. A delay in heading by a one to two-week period was observed at Perkins and Lahoma for applications made after May 21st (Table 2.). This delay in heading contributed to similar delay in maturity and potential harvest date. At Perkins decreased plant height was observed in the pre-plant plot and was associated with the onset of late season nitrogen deficiency (Figure 2). While this response was unexpected, the impact of nitrogen deficiency experienced early in the crop growth on the root and shoot growth has been well documented in many species. As a plant experiences nitrogen limitations growth changes from above ground to the below ground parts (roots) in an attempt to alleviate nitrogen stress. This increase in root growth could contribute to a more efficient uptake of nitrogen and decrease loss. In contrast to Figure 2, pre-plant application is shorter than compared to later season applications, this could be a result of inadequate N uptake thus leading to N loss by leaching, whereas later applications had increased root growth for efficient N interception and uptake.

Yield Response to Application Timing
Response of N was observed at all locations (Figure 3), while the delay of nitrogen varied in its effects across all locations. Grain yield from each N application was compared back to the pre-plant application to evaluate the effects of timing. All four locations responded positively to N fertilizer. At both LCB and Lahoma grain yield was maintained with applications made as late as 42 to 63 DAP respectively before any negative trend in grain yield was observed. Perkins was the only locations to have a statistically significant increase in grain yield due to delayed N applications. At this site, which is a sandy loam, waiting until 42 DAP resulted in a 15 bushel increase over the pre-plant plot. Now Alva which was double crop showed that rainfall is key. At this site, none of the in-season treatments made it up the level of the pre-plant. The reason for this will be discussed further below.

Influence of Rainfall
The loss in grain yield at Perkins in the pre-plant application could likely be reflective of nitrogen loss due to leaching. Pre-plant applications have been well documented in the aspect loss as a result of crop requirement and early physiological development. Long term mesonet rainfall data depicts a decline in the probability of rainfall with the progression of the growing season across all locations. In early season the probability of 0.5 inches of rainfall ranges from 8 to 10% respectively for LCB, Lahoma, and Perkins, and dramatically decline to percentages at low as 5% in mid-July during grain filling period. For Alva rainfall probability is substantially lower as its season was initiated during the drier months, which depicted a probability of 6% for 0.5 inches of rainfall, and 4.5% for 1 inch for early season rainfall crucial for pre-plant incorporation and crop establishment. These probabilities drop considerably compared to regular season as the months progress onward, mid to late August probability for 0.5 inches ranges from 0.8 to 11.5%, while for a 1 inch is 0 to 6.9%. Past weather data provided by the mesonet illustrates how later in the season rainfall and its amount is variable, suggesting that in a double crop scenario delayed application is not recommended while it is in regular season crop due to the increased chance of rainfall probability.
Summary
The purpose of this study was to evaluate the impacts of delayed nitrogen application in grain sorghum. In order to develop an accurate conclusion additional site years are required, although current data could suggest delaying nitrogen application for full season grain sorghum is possible without a detrimental loss in grain yield. This means producers have time to evaluate the crop and market to determine if more inputs are needed and economical, while allowing implementation of technologies such as the N-Rich Strip and SBNRC.
If you have any questions for comments please reach out.
Brian Arnall
b.arnall@okstate.edu
405.744.1722
Acknowledgement of EDC Ag Products Co LLC for support of this project.
In-season N application methods for Sorghum
Raedan Sharry, Ph.D. candidate under advisement of B. Arnall
Brian Arnall, Precision Nutrient Management Specialist
The data about to be reported is from the study we have fondly named “Burn Baby Burn”, you will see why soon enough.

Grain Sorghum production continues to be an important component of many growers crop rotations in the Great Plains. However, for many growers who focus primarily on small grains production, equipment restraints may impose limits on in season nitrogen (N) management. When producers are able to delay the application until in-season it helps to ensure that N is available to the crop at the time of increased uptake during the reproductive stages of the crops life. Producers often have access to equipment and technologies that may be used to take advantage of improved N application timing, but may worry about the negative effects that nitrogen can have if the fertilizer is inadvertently applied to plant material. An experiment was initiated in Central Oklahoma to evaluate the yield response of grain sorghum to in-season nitrogen application methods.
Trials were placed at Lake Carl Blackwell near Stillwater, Perkins and Chickasha Oklahoma and included 9 in-season fertilization methods and a 0 nitrogen control. Treatments are listed in Table 1 below.
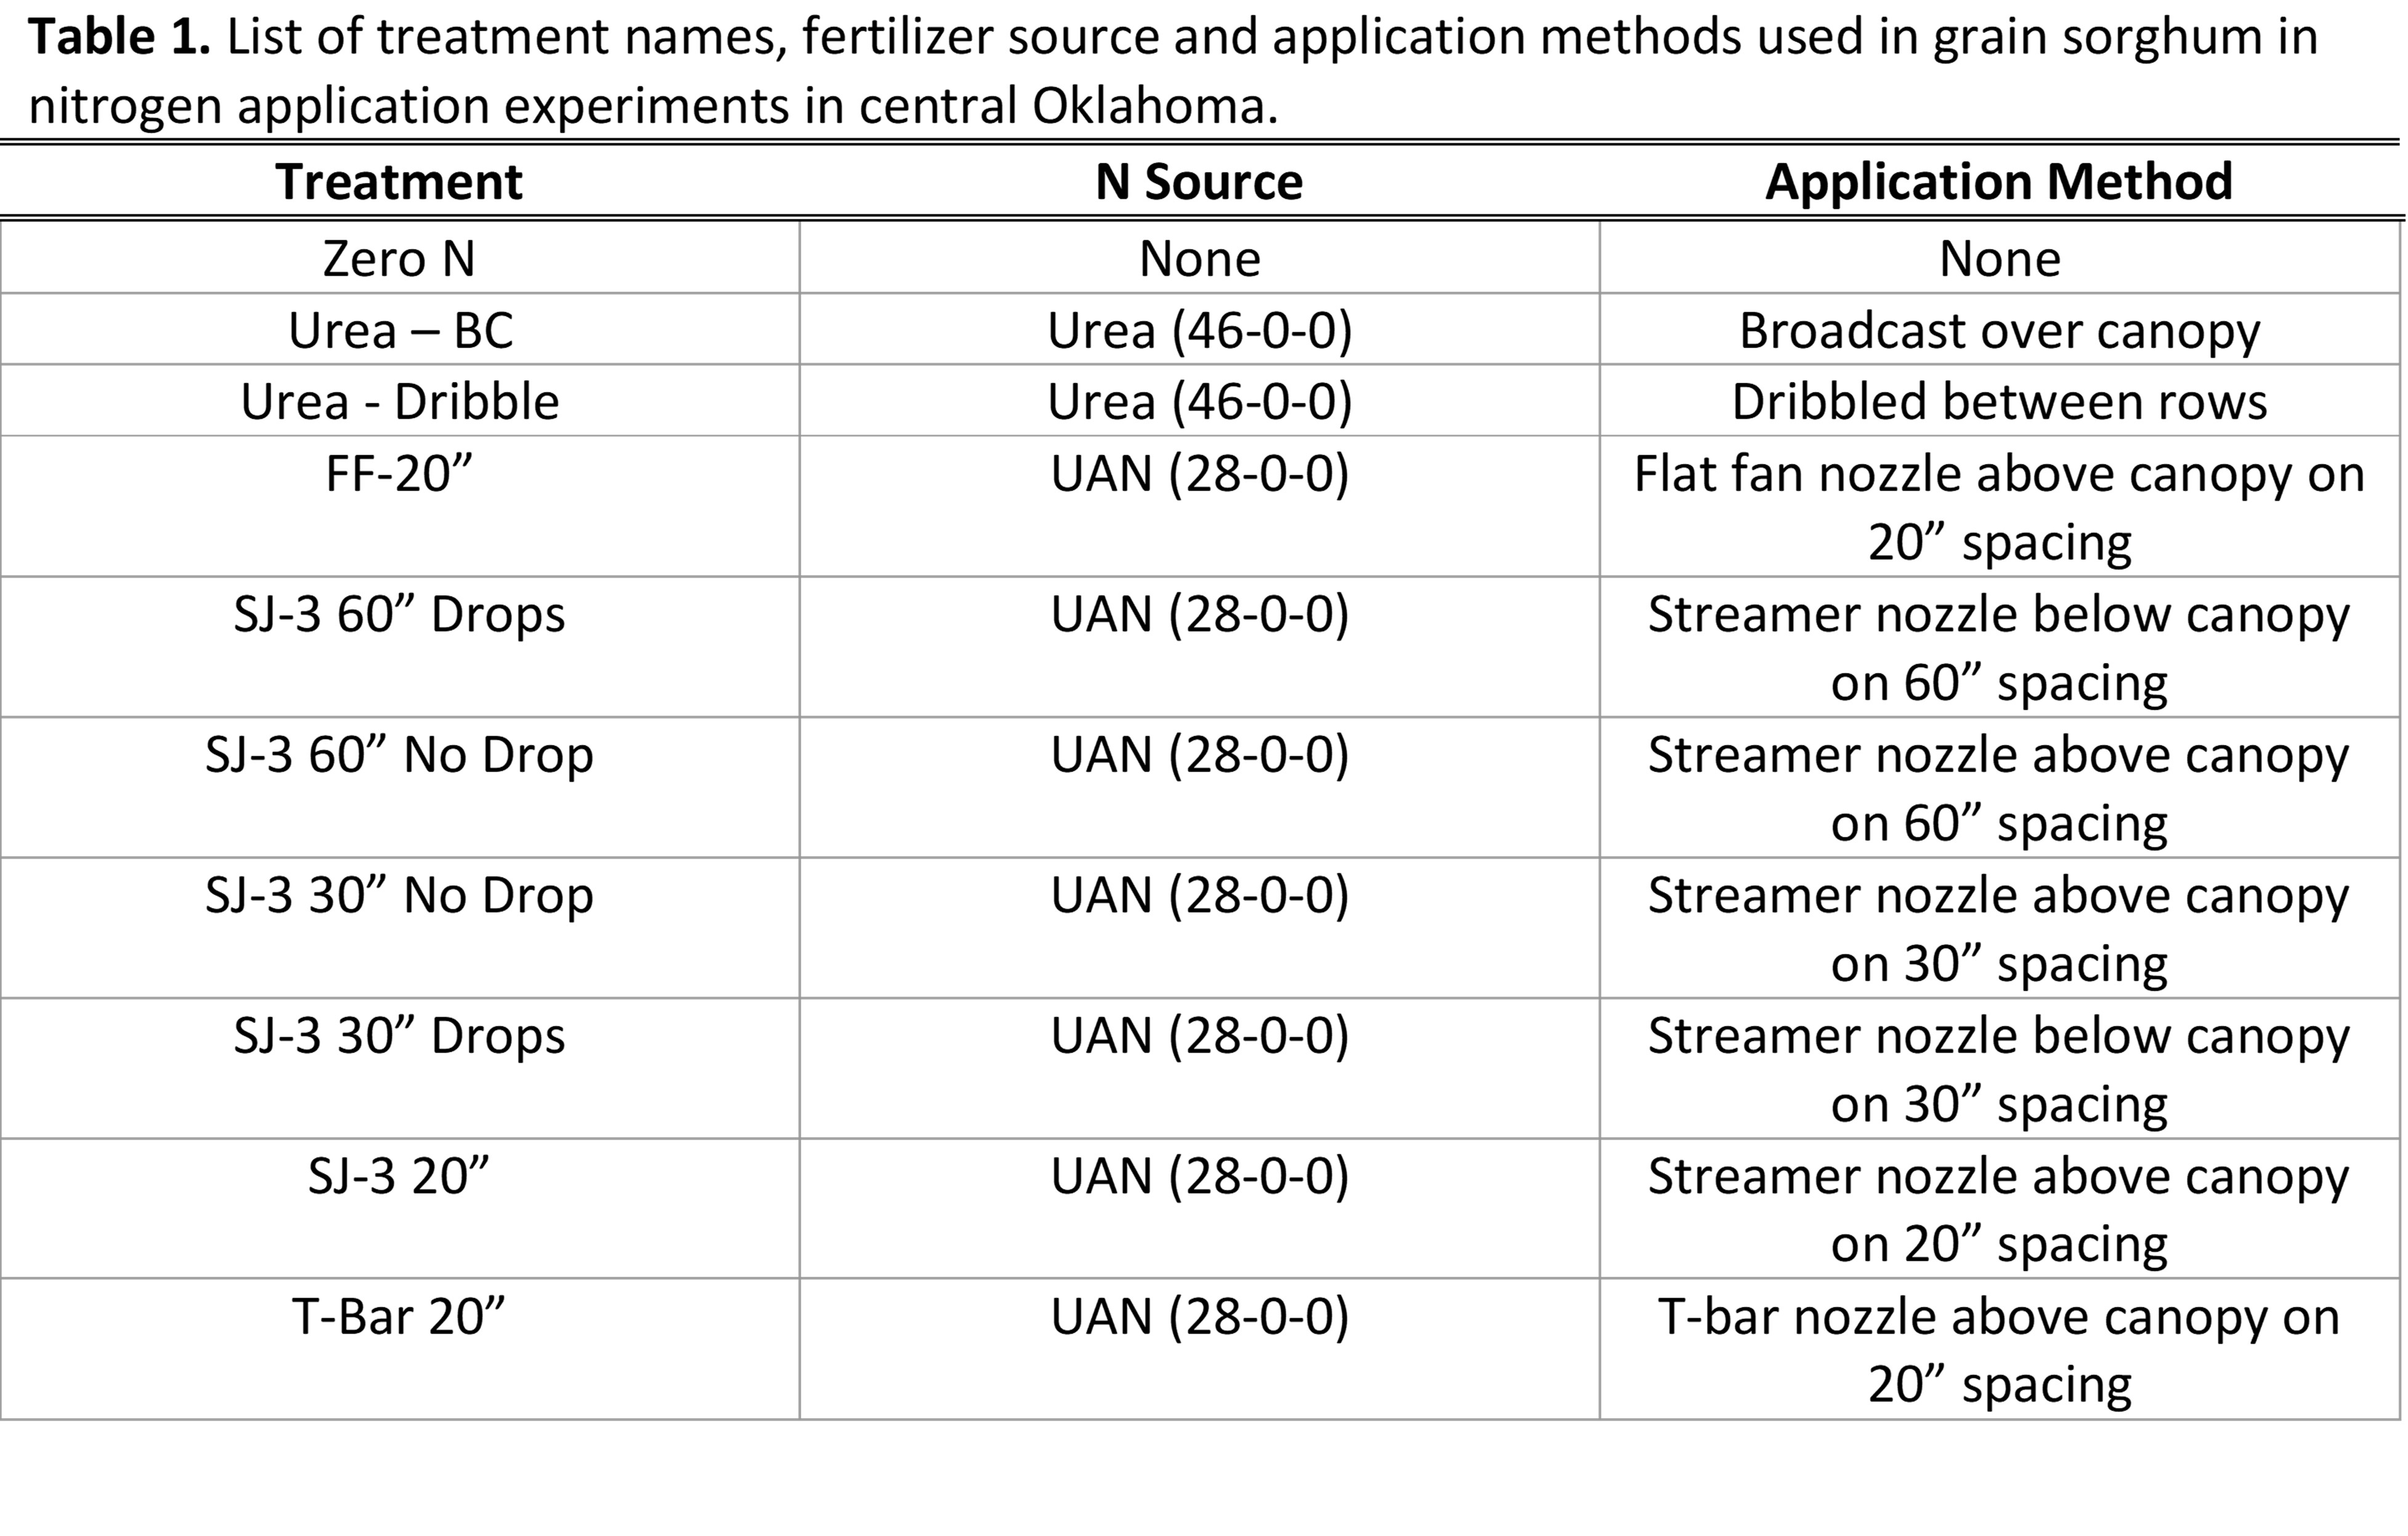
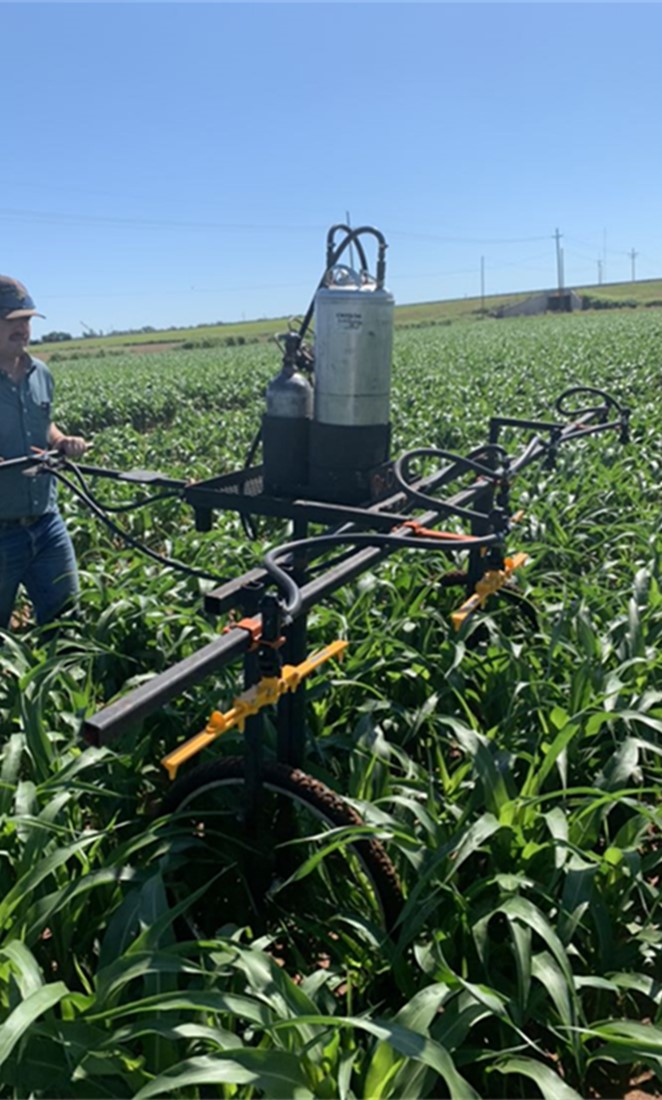
In total 120 lbs of N was applied to all treatments receiving in-season applications. 60 lbs was applied at planting to all treatments including the “Zero N Control”. The remaining 60 lbs. of N was applied according to application method in-season. The urea was applied by hand and the liquid treatments a push cart with adjustable boom height (Figure 1) was used to apply the UAN. Applications were made mid day at V8 growth stage. The temperature at the time of all applications was about 90 F and humidity below 75%. Nozzle position for 30″ and 60″ was set for between rows.
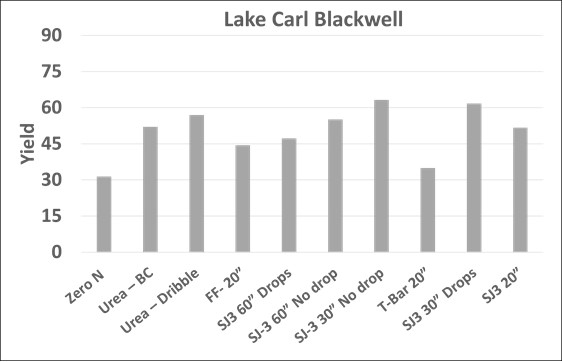
At two of the three locations (Stillwater and Perkins) the addition of 60 lbs. of N in-season increased yield above the control treatment. At the Stillwater (Lake Carl Blackwell) location there were no statistical differences (α=0.05) between in-season fertilized treatments except the T-Bar 20” treatment (Figure 2). The Perkins location (Figure 3) provided a similar result in which again there was no statistical difference between fertilized treatments, excluding the T-Bar 20” treatment.

The Chickasha location differed in that additional in-season nitrogen did not improve yield (Figure 4). While we want a response to applied N, in the case it allows use to solely evaluate the impact of burn associated with N application. The T-bar 20” treatment statistically negatively impacted grain yield and the FlatFan-20″ did at α=0.10, which means we are only 90% confident the yield lose was due to treatment. This response has been consistent across all three locations, on average decreasing yield approximately 21 bu/ac relative to the individual site grain yield average.

Even though it was mentioned for Chickasha, it is also important to note that while it was not statistically significant (α=0.05) the FF- 20” treatment (Flat Fan nozzles above canopy on 20” spacing) trended towards decreasing yields at all 3 locations and is likely detrimental to crop performance. At all locations substantial damage to leaf material was observed, similar to that pictured in Figure 5 below. Several of the treatments damaged leaf material on the plant through burn injury, but most were not negatively impactful on grain yield in the 2021 growing season. Grain sorghum yield did not benefit from moving the application point below the canopy using drop attachments, nor did adjusting nozzle spacing from 30 to 60”. Source was not a significant factor impacting grain yield regardless of it application method.

The observations from this study show that many of the in-season nitrogen application methods that are available to growers will not negatively impact yield. This however does not apply to tools such as the T-Bar. Similar tools that concentrate large amounts of N to leaf material are also likely to produce similar results. It is important to note that the T-bar was used on 20” spacings and not tested otherwise. Moving the spacing of the T-bar may lead to different results.
Growers who are looking to move N applications in their grain sorghum crop to in-season to capture the benefits associated will likely be able to with equipment that is already available to them. While leaf damage may be observed under sub-optimal application methods, damage is unlikely to contribute to significant yield loss. However, growers should keep in mind that environmental conditions may have a significant impact on the results seen from these types of application as growers should always look to limit stress to the plant when possible.
We of course will be putting out a second year of this study and will share the results when we can.
For more information or questions contact
Brian Arnall b.arnall@okstate.edu 405.744.1722
Can Grain Sorghum Wait on Nitrogen? One more year of data.
Michaela Smith, Ph.D. candidate under advisement of B. Arnall
Brian Arnall, Precision Nutrient Management Specialist
The impressive ability of sorghum to recover from significant N stress with late applied nitrogen was originally reported in the blog “Can grain sorghum wait on nitrogen”. This projected was replicated again in 2021 and these are the results. During the 2021 growing season, frequency of rainfall events and amounts were similar to the 2020 growing season. Figure 1. shows the application dates and rainfall events.
Statistically there was no significant difference in grain yield from the pre-plant (0) and any application up to the 56 day application. This data matches up quite well the yield results from 2020.
Looking and the current soil moisture conditions (Figure 3.) and fertilizer price I think this data supports the recommendation to get the seed in the ground and see how the situation plays out. If there are decent rains at and shortly after planting then there is time to apply nitrogen with little risk of yield loss. If fact the weather during late May and early June provide some of the best chances to getting the fertilizer rained in (Figure 4) . If the weather doesn’t cooperate and provide us the much needed rains, then by waiting to apply we are not left with a lot of Expensive nitrogen setting out in the field of a failed crop.
Final Thoughts Heading into the 2021 Sorghum Planting Season.
– Make sure you have a soil sample, knowing P and K will be critical.
– No need to front load N fertilizer, especially if soil moisture is short.
– Utilize in-furrow P if soil pH and or soil test P is low.
– If you skip pre-plant N APPLY N-RICH STRIPS!!!!
– If you apply pre-plant N consider applying 50% of the expected N or less.
– If you are applying any level of pre-plant N, Create Zero-N Strips.
For more information or questions contact
Brian Arnall b.arnall@okstate.edu 405.744.1722
Special thanks to EDC Ag Products Co LLC for suppling NH4NO3 used in the delayed N project.
Original Post March 22, 2022.
Data for this post available in thesis Impact of delayed nitrogen application in grain sorghum
Smith, Michaela Lynn (2021-05). Available at https://shareok.org/discover
Grain sorghum producers in Oklahoma are challenged greatly by their environment and sporadic rainfall patterns, which diminish as the season progresses. These uncontrollable variables influence timing of nitrogen (N) application and nitrogen use efficiency. Using rainfall events as an incorporation method forces producers to apply before the event regardless of its intensity or delay application until field conditions are acceptable while anxiously waiting for another rainfall event. When deciding to delay N application it’s important to know the effects on physiological development and grain yield.
Trial structure and breakdown
This study was conducted over the 2020 growing season consisting four locations, including one double cropping system following wheat. Ten in-season applications were made using ammonium nitrate (AN) as the N source at a rate of 90 lbs. ac. Using AN as the N source reduced the risk of nitrogen loss through the process of volatilization as the goal of the research was to test the plant not the fertilizer. A pre-plant treatment served as the standard check, while in-season applications were initiated at 21 Days After Planting (DAP) and applications made sequentially at 7-day intervals. A non-fertilized check was included to the study to confirm locations were responsive to N fertilized applications Hybrid, plant date, and seeding rate can be found in Table 1.
Physiological Response to Application Timing
Two of the four locations demonstrated an effect to physiological development and maturity with the delay of nitrogen application. A delay in heading by a one to two-week period was observed at Perkins and Lahoma for applications made after May 21st (Table 2.). This delay in heading contributed to similar delay in maturity and potential harvest date. At Perkins decreased plant height was observed in the pre-plant plot and was associated with the onset of late season nitrogen deficiency (Figure 2). While this response was unexpected, the impact of nitrogen deficiency experienced early in the crop growth on the root and shoot growth has been well documented in many species. As a plant experiences nitrogen limitations growth changes from above ground to the below ground parts (roots) in an attempt to alleviate nitrogen stress. This increase in root growth could contribute to a more efficient uptake of nitrogen and decrease loss. In contrast to Figure 2, pre-plant application is shorter than compared to later season applications, this could be a result of inadequate N uptake thus leading to N loss by leaching, whereas later applications had increased root growth for efficient N interception and uptake.
Yield Response to Application Timing
Response of N was observed at all locations (Figure 3), while the delay of nitrogen varied in its effects across all locations. Grain yield from each N application was compared back to the pre-plant application to evaluate the effects of timing. All four locations responded positively to N fertilizer. At both LCB and Lahoma grain yield was maintained with applications made as late as 42 to 63 DAP respectively before any negative trend in grain yield was observed. Perkins was the only locations to have a statistically significant increase in grain yield due to delayed N applications. At this site, which is a sandy loam, waiting until 42 DAP resulted in a 15 bushel increase over the pre-plant plot. Now Alva which was double crop showed that rainfall is key. At this site, none of the in-season treatments made it up the level of the pre-plant. The reason for this will be discussed further below.
Influence of Rainfall
The loss in grain yield at Perkins in the pre-plant application could likely be reflective of nitrogen loss due to leaching. Pre-plant applications have been well documented in the aspect loss as a result of crop requirement and early physiological development. Long term mesonet rainfall data depicts a decline in the probability of rainfall with the progression of the growing season across all locations. In early season the probability of 0.5 inches of rainfall ranges from 8 to 10% respectively for LCB, Lahoma, and Perkins, and dramatically decline to percentages at low as 5% in mid-July during grain filling period. For Alva rainfall probability is substantially lower as its season was initiated during the drier months, which depicted a probability of 6% for 0.5 inches of rainfall, and 4.5% for 1 inch for early season rainfall crucial for pre-plant incorporation and crop establishment. These probabilities drop considerably compared to regular season as the months progress onward, mid to late August probability for 0.5 inches ranges from 0.8 to 11.5%, while for a 1 inch is 0 to 6.9%. Past weather data provided by the mesonet illustrates how later in the season rainfall and its amount is variable, suggesting that in a double crop scenario delayed application is not recommended while it is in regular season crop due to the increased chance of rainfall probability.
Summary
The purpose of this study was to evaluate the impacts of delayed nitrogen application in grain sorghum. In order to develop an accurate conclusion additional site years are required, although current data could suggest delaying nitrogen application for full season grain sorghum is possible without a detrimental loss in grain yield. This means producers have time to evaluate the crop and market to determine if more inputs are needed and economical, while allowing implementation of technologies such as the N-Rich Strip and SBNRC.
If you have any questions for comments please reach out.
Brian Arnall
b.arnall@okstate.edu
405.744.1722
Acknowledgement of EDC Ag Products Co LLC for support of this project.

Utilizing N fixing biologicals.
In the past couple years significant efforts have been made to produce N fixing microorganisms that can be utilized in an agriculture system. The atmosphere is 78% N2 and prokaryotic microorganisms such as the bacteria species Azotobacter, Bacillus, Clostridium, and Klebsiella take that N2 gas and turn it into plant available NH4. These organisms have been around providing nitrogen for plants, for as long as there has been plants. In agriculture we have heavily utilized their relationship with legumes however have struggled bringing them into other realms of production. Naturally they tend to be found in areas that are very low levels of nitrogen. For example, prokaryotes were found in the un-fertilized check of the 130-year-old Magruder Plots but are not found any other treatment that receives fertilizer organic or commercial.

Now there are several products marketed as containing N fixing microorganisms suited for use in today’s corn, sorghum, and wheat production. While I have an active research program evaluating the use of such materials in Oklahoma, this blog will not address what works or how well. This blog will touch upon my thoughts on how to utilize a technology such as this if you pull the trigger to implement.
So there is one key to getting a ROI on products that create plant available nitrogen, and it’s a really simple key.
Under Apply Nitrogen
If you apply enough or more N than the crops needs, then there is ZERO value in a product that creates more N. For example, applying one of these products in your 250-bushel yield goal corn after you’ve already laid down 300 lbs of N preplant. Unless you lose it all to leaching, your probability of seeing a ROI on your biological investment is pretty poor. I have a hard time understanding the thought process behind paying for a N fixing product and not lowering your fertilizer rate. I can see one of two reasons. 1) You believe you historically under apply N and are losing yield because of such 2) Are in an environment which has a high potential of late season N losses, and you are unable to make recovery applications.
So what to do if using a N Fixer? I do not have the confidence yet to say, “Apply X product, it will produce Y lbs of N, so cut your rate by Y lbs”. That uncertainty is one of the greatest challenges, not knowing will I get 10 lbs or 40 lbs? If I did, then I would just subtract that off my planned rate. Side note, as someone who has been doing on farm N rate studies for a decade plus, I would have to add that most were likely over applying by that much and could cut back anyways. For me the use of the N Fixers should force your hand into utilizing in-season N applications, regardless the crop. So that you can better predict or determine impact of the product.
This is where the use of a refence strip (N-Rich or Zero N) is the golden ticket. We need a way to quickly evaluate the amount of N the crop has access to. The N-Rich method works best when preplant N is drawn way back. I would add that reduced pre-plant is a great scenario for N Fixers. The N-Rich in comparison to the rest of the field will provide you guidance towards your in-season goals. If the N-Fixers are doing a great job the N-Rich will not be showing up any time soon and you can make your N rate adjustments accordingly. If you are a Pre-plant or die kind of farmer, then I say you need to pull back the reins on the preplant rate but give the N Fixers some room to add value and add in your Zero N strips. These will again let you observe what is happening in the soil apart from your fertilizer. If it is getting on the late side of in-season N and you cannot find your zero, might be a good time to walk away and hang up the fertilizer applicator keys. I have lots of blogs and pubs on the use of reference strip so send me a note if you want to dive further into these approaches.
Feel free to reach out with questions or comments. B.arnall@okstate.edu
Related Blogs
Its dry and nitrogen cost a lot, what now?
The title says a lot about the primary question I am receiving right now. And the latest long range “forecast” does not make me feel any better about the current situation. But it is what it is and many great plains wheat farmers are having to make a decision.
The current situation in the wheat belt is that we are dry to depth, when the 32 inch PAW is on short supply and this comes from a combination of no rain and above average temperatures.


Fertilizer prices are holding fairly strong, at expensive, and the wheat crop currently seems to be going in reverse. So what is a wheat farmer to do? If we are looking on the bright side the lack of moisture in the surface will help reducing any potential losses through urea volatilization. It does not make the potential for loss zero though. If I am bound and determined to fertilize now, I would be very selective of the source and method of application. The biggest driver, tillage and residue amounts.
- Conventional Till / No residue (plenty of bare soil showing) and small wheat-
- UAN via Streamer nozzles
- Why: With UAN (urea ammonium nitrate) you have a liquid N source that will get onto and into the soil and readily available nitrate. Streaming on will help concentrate the fertilizer and potential reduce any urea volatilization if any dews were to occur. Urea would sit until dissolved and lead to potential losses if the first moisture was heavy dew and not a incorporating rainfall.
- UAN via Streamer nozzles
- No-till / high residue (no bare soil showing)-
- Dry Urea
- Why: If Our residue is dry when the urea is spread the wind will help push it below the residue surface providing protection until a good rain. If UAN is applied to this dry or even slightly damp residue and not washed off with a rainfall in a week or so the amount of N tied up in that residue will likely be significant.
- Dry Urea
- The big wheat (very little bare soil, lots of wheat tissue.
- Urea or UAN Streamer
- Why not Flat fan. At least with the current status the wheat is not growing and bigger wheat has increasing levels of tip die back. So while UAN sprayed on actively growing wheat can be absorbed foliarly, stressed wheat can not do it as well. Plus the UAN that hits dead or damaged tissue will not make it into the plant. The UAN applied via flat fan will need incorporation via rain in a couple days.
- Urea or UAN Streamer
You may have caught in the paragraph above I said, “If I was bound and determined”. If I had the option I am not pulling the trigger until after I have received some good moisture. I fully expect and have already seen rigs running before every decent chance of rain. Unfortunately many of those chances have not panned out and that will remain my concern moving forward. I want to make sure we have some water in the tank before investing in the system.
But now we increase the risk/fear by waiting and the question I get is what if we don’t get good rains or don’t get good incorporating rains. The short answer is, if we don’t get rains the N application is the least of our concerns. If we approach March 15th and we have not had the rains needed to put a little water in the tank and incorporate the N then we are not likely looking at a bumper crop which will need N. What survives in that scenario will be living off deep soil water, and where there is deep soil water there is a good chance of deep N. The shallow soils will be so stressed that nutrient demand will be very little.
Now lets talk waiting and applying N. How late before we just say we are done. To answer I am going to draw from a data set I talk about a lot, the delayed N work by Dr. Souza. This study was started in the fall of 2016 and concluded with the 2020 wheat harvest. In all, twelve trials were established and achieved maturity. This study was designed to evaluate the recovery of winter wheat grain yield and protein after the crop was N stressed. Treatments included an untreated check, pre-plant application and ten in-season treatments. The application of in-season treatments was initiated when N deficiency was confirmed and treatments were applied in progressive order every seven growing days to the point of 63 growing days after visual deficiency (DAVD). A growing degree days is any day that the average daily temperature is at or above 40⁰ F. Ammonium nitrate (NH4NO3) was applied at a rate of 90 lbs N ac-1 for all treatments.
With this data we can answer two questions, first at what point did we lose yield compared to pre-plant and second how late could we apply and still increase yield above the check. So comparing to the pre lets us know how long could we wait with losing yield. Across the trials we lost yield three times by waiting too long, at LCB2017b that was 4/19, Lahoma18 it was around 3/30, and then Newkirk2020 we lost yield by waiting until 4/6. This data is why I am pretty comfortable waiting until mid March when and if needed. Now if we look at the check, that will tell us if things start improving late can we get still get a yield bump with added N. Newkirk 2020 was the only time and place we could increase yield above the zero after the 4/14 additions.


Take Home Message
My recommendation is that if you are not required to take delivery or needing to cover a lot of acres, i.e. time limited, I would not get in a hurry to apply N on this wheat crop. I think if we combine weather by market this a good time to wait and see. Once we get a rain and have some soil moisture it will be time to run the rigs. The crop currently does not need a lot of N so why spend the $. If things don’t improve by mid to late march, consider the wheat a cover and look towards a summer crop with the hopes of rains in April. If you need to take the crop to yield, then you can wait a while longer and still get a return on the N, with hopes the price could come down a bit.
Finally, While I don’t suggest running fertilizer in front of the first chance of rain, I would make sure I had an N-Rich strip on each and every single field. Strips can go out well past green up and serve a great purpose. The N-Rich strip will help you determine if the crop is able to mine any soil N or if the N tank is dry.
Feel free to reach out with questions or comments.
Brian Arnall Precision Nutrient Management Specialist.
b.arnall@okstate.edu
Special thanks to EDC Ag Products Co LLC for suppling NH4NO3 used in the delayed N project.
Relevant past blogs for your reading enjoyment.
The Easy Button for Nitrogen…….
Brian Arnall, Precision Nutrient Management Extension Specialist.
The basics for nitrogen (N) fertilizer rate determination can be described in a mechanistic approach by the Stanford Equation NFert = ( NCrop – NSoil ) / Neff. This equations states that the N fertilizer rate is equal to the amount of nitrogen taken up by the crop minus the amount of nitrogen supply by the soil, divided by the efficiency of the nitrogen fertilizer used. I outline the importance of this equation in the blog “Components of a variable rate nitrogen recommendations“.

There are nitrogen “Easy Buttons” which utilizes averages collected over diverse environments to create accurate N rate recommendations. The best example of this is the yield goal rules of thumb such as wheats 2.0 lbs N per yield goal bushel minus soil test nitrate. Yield goals are generally calculated as the average of the best 3 out of 5 years, or the 5-year average times 20%. Also, the 2.0 lbs of N is more than what is in a bushel as it also adds in an efficiency factor or a 0.5 lbs per bushel cushion. This method and others like it provide an accurate N rate with slight probability of yield loss. However, the rec is often highly imprecise. Meaning that if I apply the method to 100 fields the average will be spot on, however if I look at the performance of the recommendation on a single field, I will likely be disappointed.

When it comes to nitrogen recommendations the Easy button method will use components which help ensure that the rate prescribed will maximize yield 90-95% of the time. For example, take the data presented in Figure 2. Over fifteen years of the long-term winter wheat fertility study near Lahoma, Oklahoma the average pounds of N per bushel to reach economic optimum nitrogen rate (EONR) was 1.6, however if 2.0 of N was applied per bushel yield would have been maximized 13 out of the 15 years. While 2.0 lbs. of N per bushel would have been quite accurate for maximizing yield, it would be highly imprecise as over the 15 years optimum pounds of N per bushel ranged from 0.0 to 3.2.

The trick to improving your N rate recommendation closer to a precise and accurate system is to obtain representative site-specific values for the Stanford Equation NFert = (NCrop – NSoil) / Neff.
Looking at the 15-year long-term data above the yields range from a low of 27 to a high of 88 bushels. Of those 15 years, I personally planted multiple years, usually sometime in October, and many of those years while sowing I could have guessed a range of 55-60 bushel, which just happened to be just above the 15-year average. It was not until February and March when the yield potential really started to express itself. Why, well there is a lot of weather between Oct to March, a lot of environmental positive and negative impacts on that final grain yield. This is the best timing to go out with approaches, models, or techniques to estimate yield potential for N rate recs.
While I am a big fan of soil testing, pre-plant soil samples for N are just a snap shot in time. But the While I am a big fan of soil testing, pre-plant soil samples for N are just a snapshot in time, but the nitrogen cycle Figure 3, will roar on after the soil sample is collected. Organic matter (OM) is the central component of this cycle and drives availability of NH4 and NO3 in the system. For each 1% OM in the top 6″ of the soil there is approximately 1000 lbs of organically bound N. The amount of N going into and out of OM pool is driven by C:N ratio of residues, soil temperature and soil moisture. While we very well what the mechanisms of the cycle are and can model the reactions quite well. Our inability to predict long term weather patterns is the greatest factor limiting our ability to predict future availability of NSoil.

This is where the reader should be asking “how can we get better site specific data” and I begin the discussion on why I have been promoting the of the Sensor Based Nitrogen Rate Calculator (SBNRC) and N-Rich strip method.
Lets talk about how the approach follows Stanford’s mechanistic approach to N management. First the Yield Potential component of the SBNRC which is related to NCrop. In effect researchers have built models over the past two decades that can correlate the NDVI collected from a sensor, such as the GreenSeeker, with the crops biomass and chlorophyll content. If given the number of days the crop has been growing it is possible to use the NDVI collected from the crop as a tool to predict final grain yield. The closer the wheat gets to hollow stem, or the corn gets to tassel, the better the prediction. One reason is that we have allowed more “environmental influence” to happen. Dr. Bill Raun, a founder of the SBNRC concept kept great discussion and data sets on his NUE.OKSTATE.edu website. On the “NUE Website on YP” he provides information on how yield prediction work while on the “NUE Website YP Library” he has not listed every algorithm created, and the math behind them, but also a recipe book for how anyone can create their own algorithm. While there are a lot post sensing stresses that can bring down final grain yield, the models that have been built and continually improved, do quite a good job on predicting final grain yield in-season. Resulting a much more site specific value for NCrop. The blog”Sensing the N-Rich Strip and Using the SBNRC” goes into a further discussion of using the online SBNRC.
That now leaves NSoil, which I will argue is at least as important as NCrop. As weather so greatly influences the nitrogen cycle it would be nice to have a weather station on every field paired with a 0-4 ft soil description which could be incorporated into a model. Given those might be out of reach we have found the the use of a reference strip, high N or low N, really provides an site specific estimate the of nitrogen the crop has access to. If the high N reference (N-Rich) strip is showing up that means the remainder of the field is N deficient. This may be due to losses or lack of mineralization, either way more N is needed. If the N-Rich strip is not evident then the crop is finding enough N outside of the reference strip to support its current growth. This could be that residual N or mineralization is high, or it could mean that crop growth and therefore N demand is low. Having the N check strip in each field allows for a season long evaluation. We can use NDVI to characterize how big or little of a response we have to N. We call this the Response Index (RI). An RI of 1.8 means that we could increase yield by 80% if we add adequate N, if the RI is 1.05 then we are looking at a potential increase of 5%. I have a previous blog which goes into the application of the reference strip. “Nitrogen Rich Strips, a Reminder“
Finally we combine the two, YP and RI. By predicting the yield of the area out side the N-Rich strip we can determine environmental yield potential, YP0. Basically what can the field yield if nothing is added. We multiple YP0 by the RI to get the yield potential with added N, YPN. Then its as simple as N rate = (YPN – YP0 ) x N needed per bushel. So for example if YP0 is 40 bushel RI =2, then YPN is 80 bushel. I need to fertilize the additional 40 bushels of wheat and I can use the 2.0 N per bushel can come up with a top-dress rate of 80 lbs N per acre. We are now incorporating site specific in-season NCrop and NSoil data.
And just a reminder for those of you new to my blog, I have a lot of research documenting that it is not only OK, but often best if we wait on N application in wheat and other crops. Value of In-Season N blog.
Every step we take towards the easy button is often a step towards site specific imprecision due to the use of generalized terms or models. Depending on your goals this very well could be acceptable for your operation, but with nitrogen prices as volatile as they are, should we not be considering pushing the easy button to the side, for now. Let’s add a bit of site-specific data so that we can take advantage of the N the system may be giving us, or the yield we did not expect. Let the N-Rich Strip be that first step.
Relevant Peer Review Publications.
If you have any questions please feel free to contact me @ b.arnall@okstate.edu
Nitrogen Source: What’s “cheap” now may be lost later
Raedan Sharry, Ph.D. Student, Precision Nutrient Management
Brian Arnall, Extension Specialist, Precision Nutrient Management
Note, this blog is focused on grain only winter wheat production.
Crop producers looking to increase profits often consider how to reduce costs without sacrificing yield and/or quality. This applies to essentially all production functions including nitrogen application. Winter wheat growers in the southern Great Plains have a wide number of options available to them when considering nitrogen source and application technique. At the time of writing (08/27/2021) fertilizer prices obtained from the Two Rivers Farmers Cooperative are as follows ($/unit): UAN (28-0-0) $0.62, NH3 (82-0-0) $0.45, and Urea (46-0-0) $0.62. These price levels equate to approximately a 57% increase in urea cost, 65% increase in UAN28, and a 65% increase in NH
Application Timing
Winter wheat producers in the southern plains have historically applied nitrogen (N) fertilizer prior to planting, often utilizing anhydrous ammonia for application due to its generally lower price point per unit of N relative to other sources. However, research at Oklahoma State shows that if the total N application is delayed until approximately feekes 5 to feekes 7 stages (jointing) yields were increased 23% of the time while grain protein was increased 68% of the time. By delaying N application to later in the growing season N is more likely to be available when the crop requires by avoiding conditions conducive to losses. Further reading on delaying nitrogen application can be found here (https://osunpk.com/2020/09/10/value-of-in-season-application-for-grain-only-wheat-production/)
A study located a Perkins, OK observing yield and protein response provides an example of an expected response to delayed N. In this study 3 N fertilizer rates (180, 90 and 45/45 split) across 5 different timings (Pre, 30, 60, 90, and 120 days after planting) where investigated. Grain yield was maximized by the 180 lb. rate applied 60 days after planting, while protein was maximized at the 120 days after planting timing. This same trend continues across all N rate levels as the later N applications whether at 60 or 90 increased yield relative to the pre while the 120 days after planting application maximized protein level regardless of rate level. However, maturity of the 120 day application treatment was severely delayed. This experiment shows the ability to sustain yield while decreasing N rate if N application is pushed to later in the season to avoid conditions that lead to N losses as displayed by the 90 lbs. at 90 days after planting treatment compared to the 180 lb. pre-plant rate.

Application Cost
Application costs are directly related to choice of source utilized. For instance; anhydrous ammonia application is predicated on the use of a pulled implement such as a low disturbance applicator for in-season application or a tillage implement for pre-season application. This is compared to other sources such as urea or ammonium nitrate which may be broadcast, or UAN that can be applied using a sprayer. The relationship between source and cost of application is inherently related to the application efficiency of the equipment used. Table 2 below provides a rough idea of cost associated with different application methods. (Information Retrieved from Iowa State). Fuel cost assumed at $2.60/gal. Labor cost assumed to be $15.00/hr.
| Implement | Operating Efficiency | Fuel cost/ac | Labor Cost/ac | Operating cost/ac |
| 90’ SP Sprayer | ~78 ac/hr | $0.34 | $0.19 | $0.53 |
| 60’ Dry Spreader | ~30 ac/hr | $0.39 | $0.50 | $0.89 |
| 35’ Sweep Plow | ~21 ac/hr | $1.43 | $0.71 | $2.14 |
In many operations across the southern plains efficiency has become a key factor in decisions such as input selection and equipment purchases. This has come in response to the need to cover more acres with less labor. With that in mind and looking back to table 2 it is easy to see that a self-propelled sprayer is likely able to cover more acres than other equipment options. This most likely should be considered when considering options for N management in the wheat crop.
Summary
With wheat sowing quickly approaching for many and field preparation nearing completion it is important to consider your nitrogen management options. Delayed N application allows for flexibility in management plan and depending on source utilized may increase application efficiency over pre-plant applications requiring a tillage implement. As fertilizer prices continue to remain high it is also important to consider the likely increase in N use efficiency due to applying N closer to when N requirement is peaking. Controlling cost while continuing to maximize output is imperative to sustainable profitability in crop production.
Any Question or Comments please feel free to reach out me.
Brian Arnall b.arnall@okstate.edu

