Home » Guest Author (Page 2)
Category Archives: Guest Author

PRE-EMERGENT RESIDUAL HERBICIDE ACTIVITY ON SOYBEANS, 2025
Liberty Galvin, Weed Science Specialist
Karina Beneton, Weed Science Graduate Student.
Objective
Determine the duration of residual weed control in soybean systems following the application of Preemergent (PRE) herbicides when applied alone and in tank-mix combination.
Why we are doing the research
PRE herbicides offer an effective means of suppressing early-season weed emergence, thereby minimizing competition during the critical early growth stage. However, evolving herbicide resistance and the need for longer-lasting weed suppression underscore the importance of evaluating multiple modes of action and their residual properties alone and tank-mixed.
Field application experimental design and methods
Field experiments were conducted in 2022, 2023, and 2024 growing seasons in Bixby, Lane, and Ft. Cobb FRSU Research Stations across Oklahoma. Each herbicide (listed in Table 1) was tested individually, in 2-way combinations, 3-way mixtures, and finally as 4-way combinations that included all active ingredients listed at the label rate.

Soybeans were planted at rates between 116,000 and 139,000 seeds/acre from late May to early June, depending on the year and location. The variety used belongs to the indeterminate mid- maturity group IV, with traits conferring tolerance to glyphosate (group 9 mode of action), glufosinate (group 10), and dicamba (group 4). Not all soybean varieties have metribuzin tolerance. Please read the herbicide label and consult your seed dealer for acquiring tolerant varieties. Row spacing was 76 cm at Bixby and Lane, and 91 cm at Fort Cobb. PRE treatments were applied immediately after planting at each experimental location.
POST applications consisted of a tank-mix of dicamba (XtendiMax VG® – 22 floz/acre), glyphosate (Roundup PowerMax 3®- 30 floz/acre), S-metolachlor (Dual II Magnum® – 16 floz/acre), and potassium carbonate (Sentris® – 18 floz/acre). Applications were made on different dates, mostly after the first 3 weeks following PRE treatments. These timings were based on visual weed control ratings, particularly for herbicides applied alone or in 2-way combinations, which showed less than 80% control at those early evaluation dates. The need for POST applications also depended on the species present at each site, with most fields being dominated by pigweed, as illustrated in the figure below.
Results
Tank-mixed PRE herbicide combinations generally provided superior residual control compared to a single mode of action application (Shown in Figure 1). Timely post-emergent (POST) herbicide applications helped sustain high levels of weed suppression, particularly as the effectiveness of residual PRE declined.

Residual control of tank-mixed PRE
Some herbicides applied alone or in simple 2-way mixes, such as sulfentrazone + chloransulam- methyl and pyroxasulfone + chloransulam-methyl required POST applications within 20 to 29 days after PRE, indicating moderate residual control.
In contrast, 2-way combinations containing metribuzin, such as sulfentrazone + metribuzin and pyroxasulfone + metribuzin, extended control up to 50 days after PRE in some cases, highlighting metribuzin’s importance even in less complex formulations.
Furthermore, 3-way and 4-way combinations including metribuzin provided the longest-lasting control, delaying POST applications up to 51–55 days after PRE.
Injury of specific weeds
Palmer amaranth (Amaranthus palmeri) control in Bixby was consistently high (≥90%) at 2 weeks after PRE in 2022 and 2024 across all treatments. At 4 WAPRE, treatments containing metribuzin alone or in combination maintained strong control (90% or greater).
Texas millet (i.e., panicum; Urochloa texana) and large crabgrass (Digitaria sanguinalis) were effectively managed with most treatments delivering over 90% control early in the season and maintaining performance throughout. In 2024, control remained generally effective, though pyroxasulfone alone showed a temporary lack of control for Texas millet, and single applications declined in effectiveness against large crabgrass later in the season. These reductions were likely due to continuous emergence and the natural decline in residual herbicide activity due to weather. The most consistent late-season control for both species came from 3- and 4-way herbicide combinations.
Morningglory (Ipomoea purpurea) control reached full effectiveness (100%) only when POST herbicides were applied, across all years and locations. Their late emergence beyond the residual window of PRE herbicides reinforces the importance of sequential herbicide applications for season-long control.
Take home messages:
- Incorporating PRE and POST herbicides slows the rate of herbicide resistance
- Tank mixing with *different modes of action* ensures greater weed control by having activity on multiple metabolic pathways within the plant.
- Tank mixing with PRE herbicides could reduce the number of POST applications required, and
- Provides POST application flexibility due to residual of PRE application
For additional information, please contact Liberty Galvin at 405-334-7676 | LBGALVIN@OKSTATE.EDU or your Area Agronomist extension specialist.
Management of soybean inoculum
Josh Lofton, Cropping Systems Specialist
Brian Arnall, Precision Nutrient Management Specialist
Soybean, a legume, can form a symbiotic relationship with Bradyrhizobium japonicum (Kirchner, Buchanan) and create their N to supplement crop demands. However, this relationship depends upon these beneficial microorganisms’ presence and persistence in the soil. This specific strain of microorganisms is not native to Oklahoma and thus must be supplemented using inoculum as a seed treatment. However, the use of inoculums alone does not guarantee a successful relationship. Handling, storage, soil conditions, and other factors can impact the ability of these microorganisms to do their job.
Soybean nitrogen demand is high, with most reports indicating that soybeans need 4.5 to 5.0 pounds of nitrogen per bushel of grain yield. This means that a 30-bushel crop requires between 135 and 150 pounds of nitrogen per acre (in comparison, corn and wheat need only 0.8 or1.6 pounds, respectively). This relationship has been shown to supply an equivalent of 89 lbs of N to the soil. In the previous example, these bacteria could fulfill 50-90% of nitrogen demand, reducing input costs significantly.
However, the bacteria associated with soybean inoculum are living organisms. Therefore, the conditions they experience before being applied to the seed and after treatment (including both before and following planting) can significantly impact their relationship with the soybean plant and, thus, their ability to provide N to the plant. By introducing a high concentration of bacteria near the seed and emerging root, this symbiotic relationship is more likely to be established quickly.
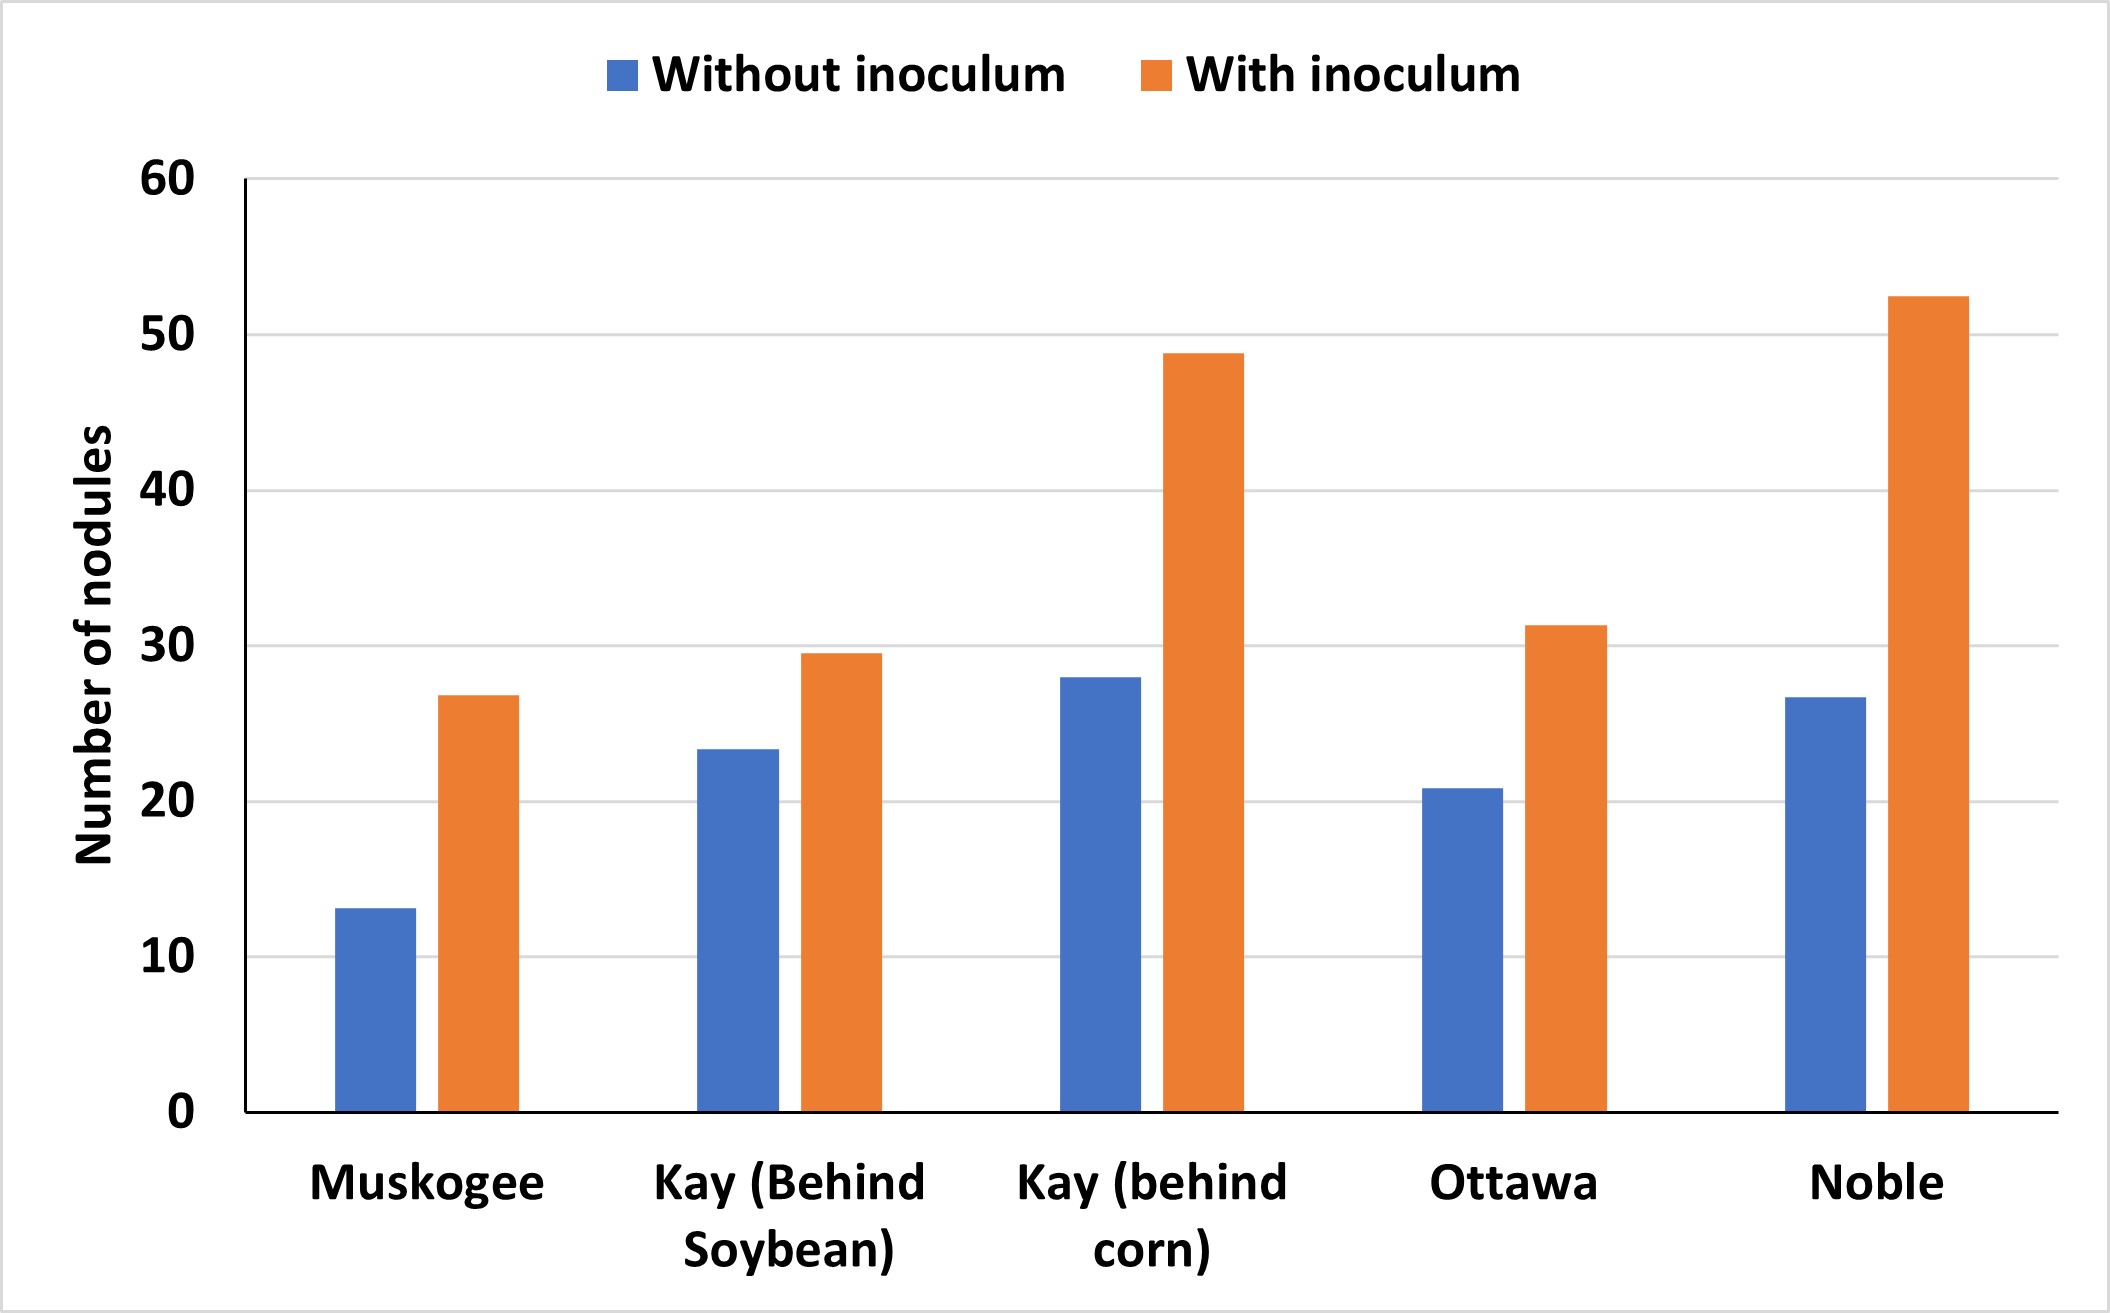
The importance of using inoculum is often debated in Oklahoma, particularly given the fluctuating prices of commodities and inputs. A recent assessment of various soybean-producing areas throughout the state revealed that most fields experienced advantages from incorporating soybean inoculation (Figure 1).
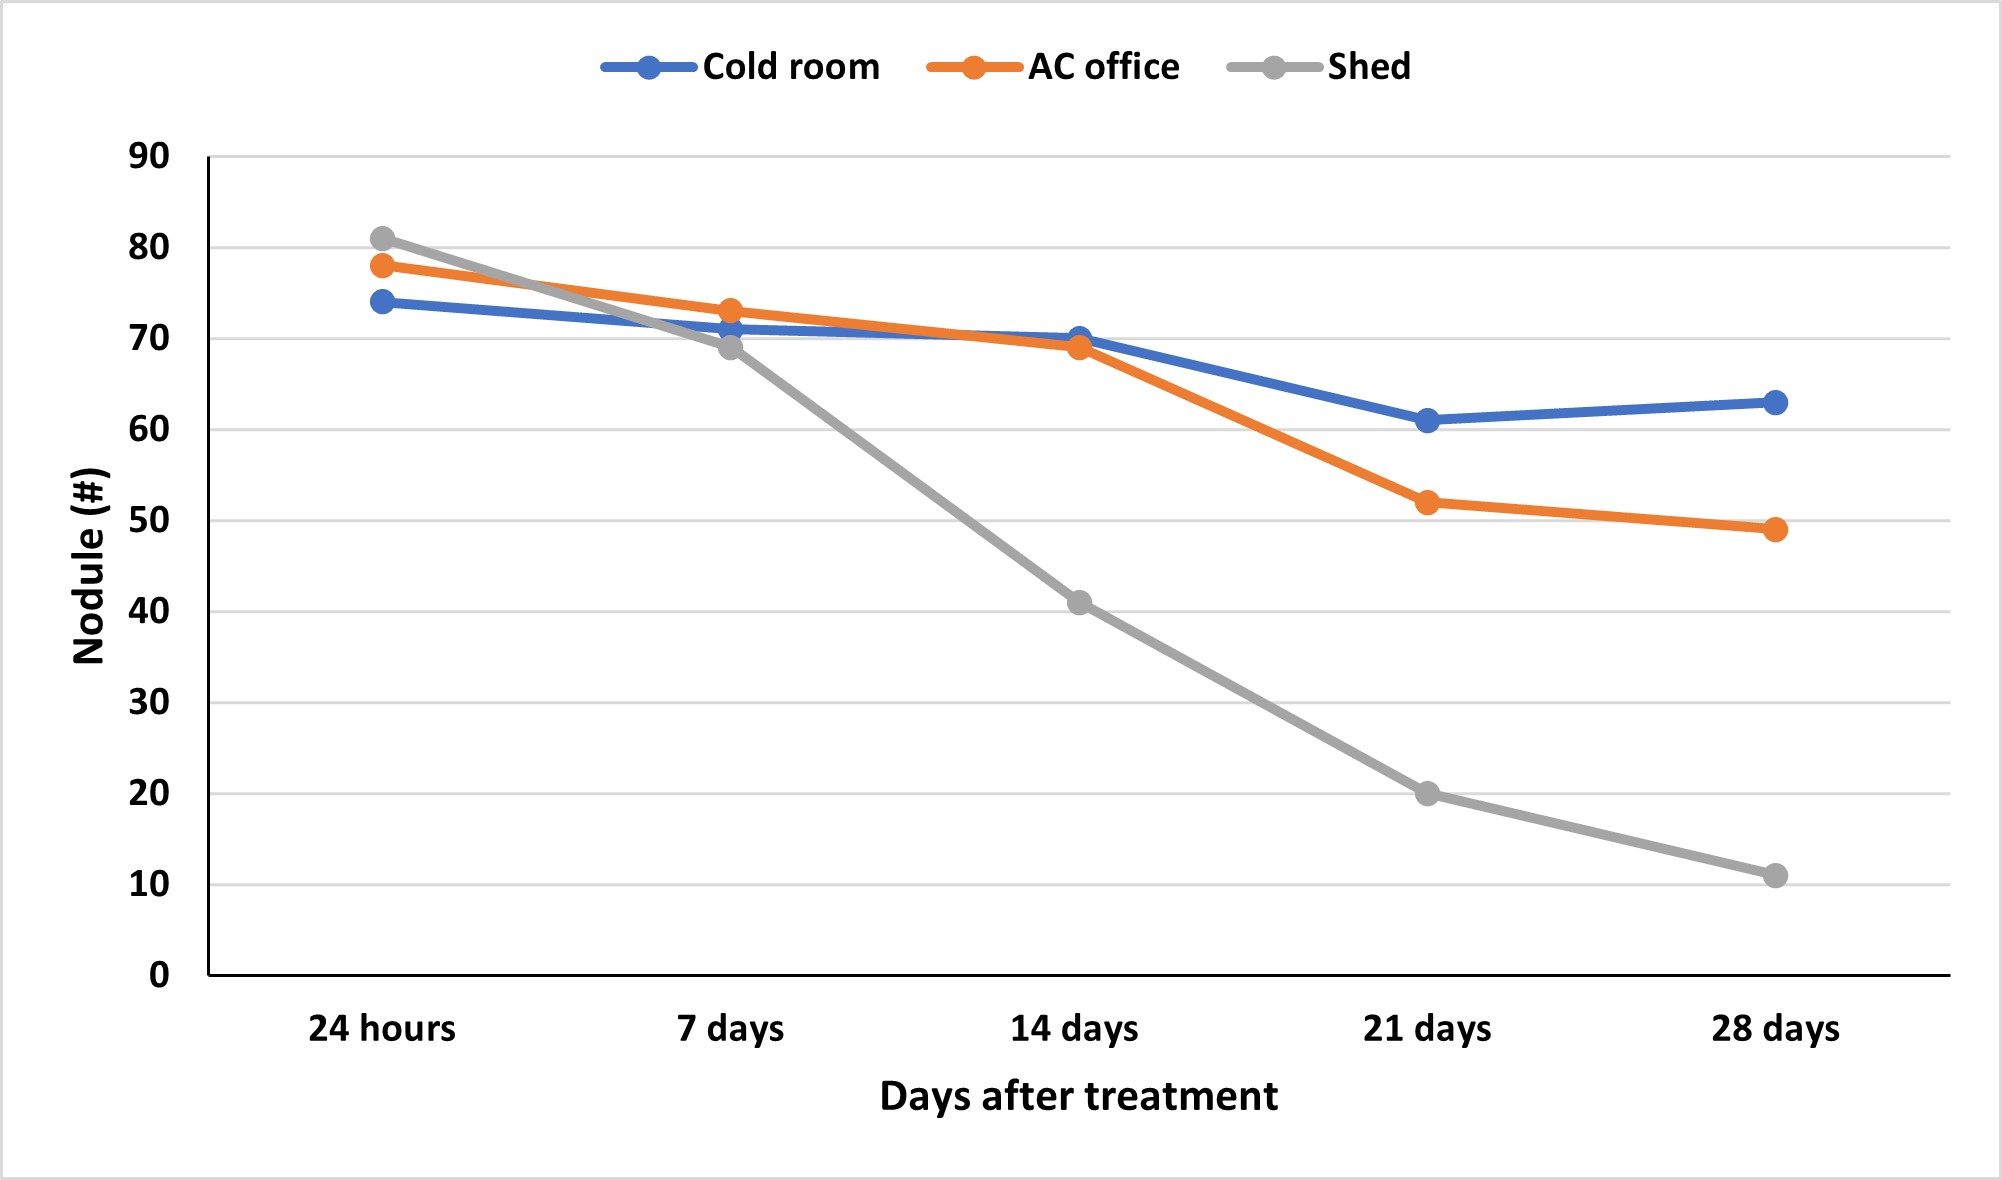
These benefits can be seen when the inoculum maintains viability until it is planted. It is always recommended that the bacteria be stored in a cool, dark environment before application on the seed. These conditions help preserve the survival of these bacteria outside of the host relationship. An evaluation of soybean inoculant after being stored short-term in different conditions found that in as little as 14 days, viability can decrease when kept in non-climate-controlled conditions (Figure 2). Additionally, viability was further reduced at 21 days when stored at room temperature compared to a refrigerated system
However, conditions colder than this, such as the use of a freezer, can compromise survival as well. Storing inoculum in the freezer forms ice crystals within the living cells and damages the cell membranes, making the microorganisms less likely to be alive upon rethawing. Additional chemicals can be added to increase the viability of long-term storage and sub-freezing temperatures. From an application standpoint, a new product should be purchased if additional storage is needed beyond short-term storage.
An additional question frequently arises: “How often should I inoculate my soybean?” As mentioned, these bacteria are not native to Oklahoma. As a result, they are not well adapted to survive in our environment and must outcompete native populations in the soil. Additionally, periods of hot and dry conditions appear to reduce the bacteria’s ability to survive without a host, the soybean roots. These are conditions we often observe in Oklahoma systems. Therefore, inoculation should be applied with every soybean planting to ensure a sufficient population of these bacteria. These bacteria promote root nodulation and nitrogen fixation in the soil.
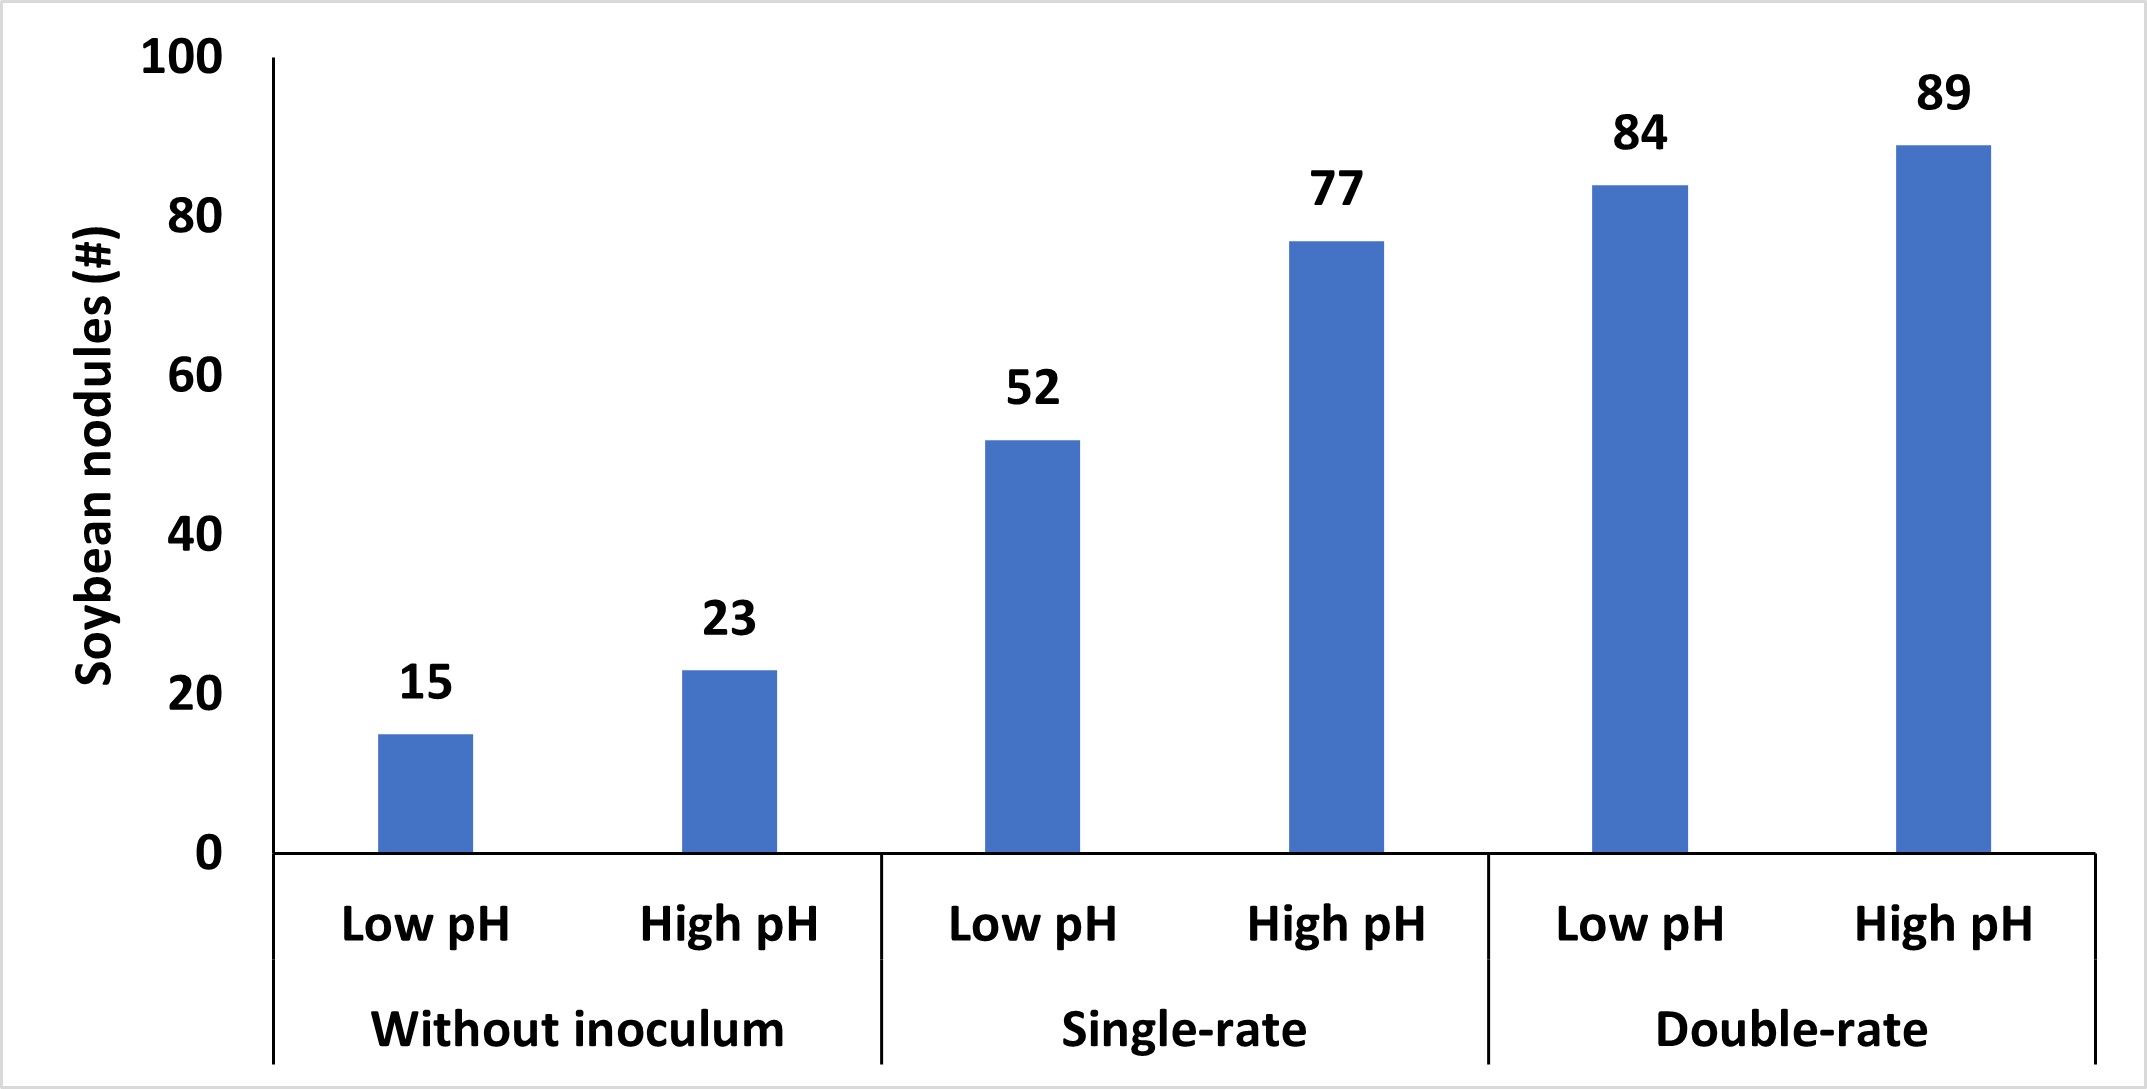
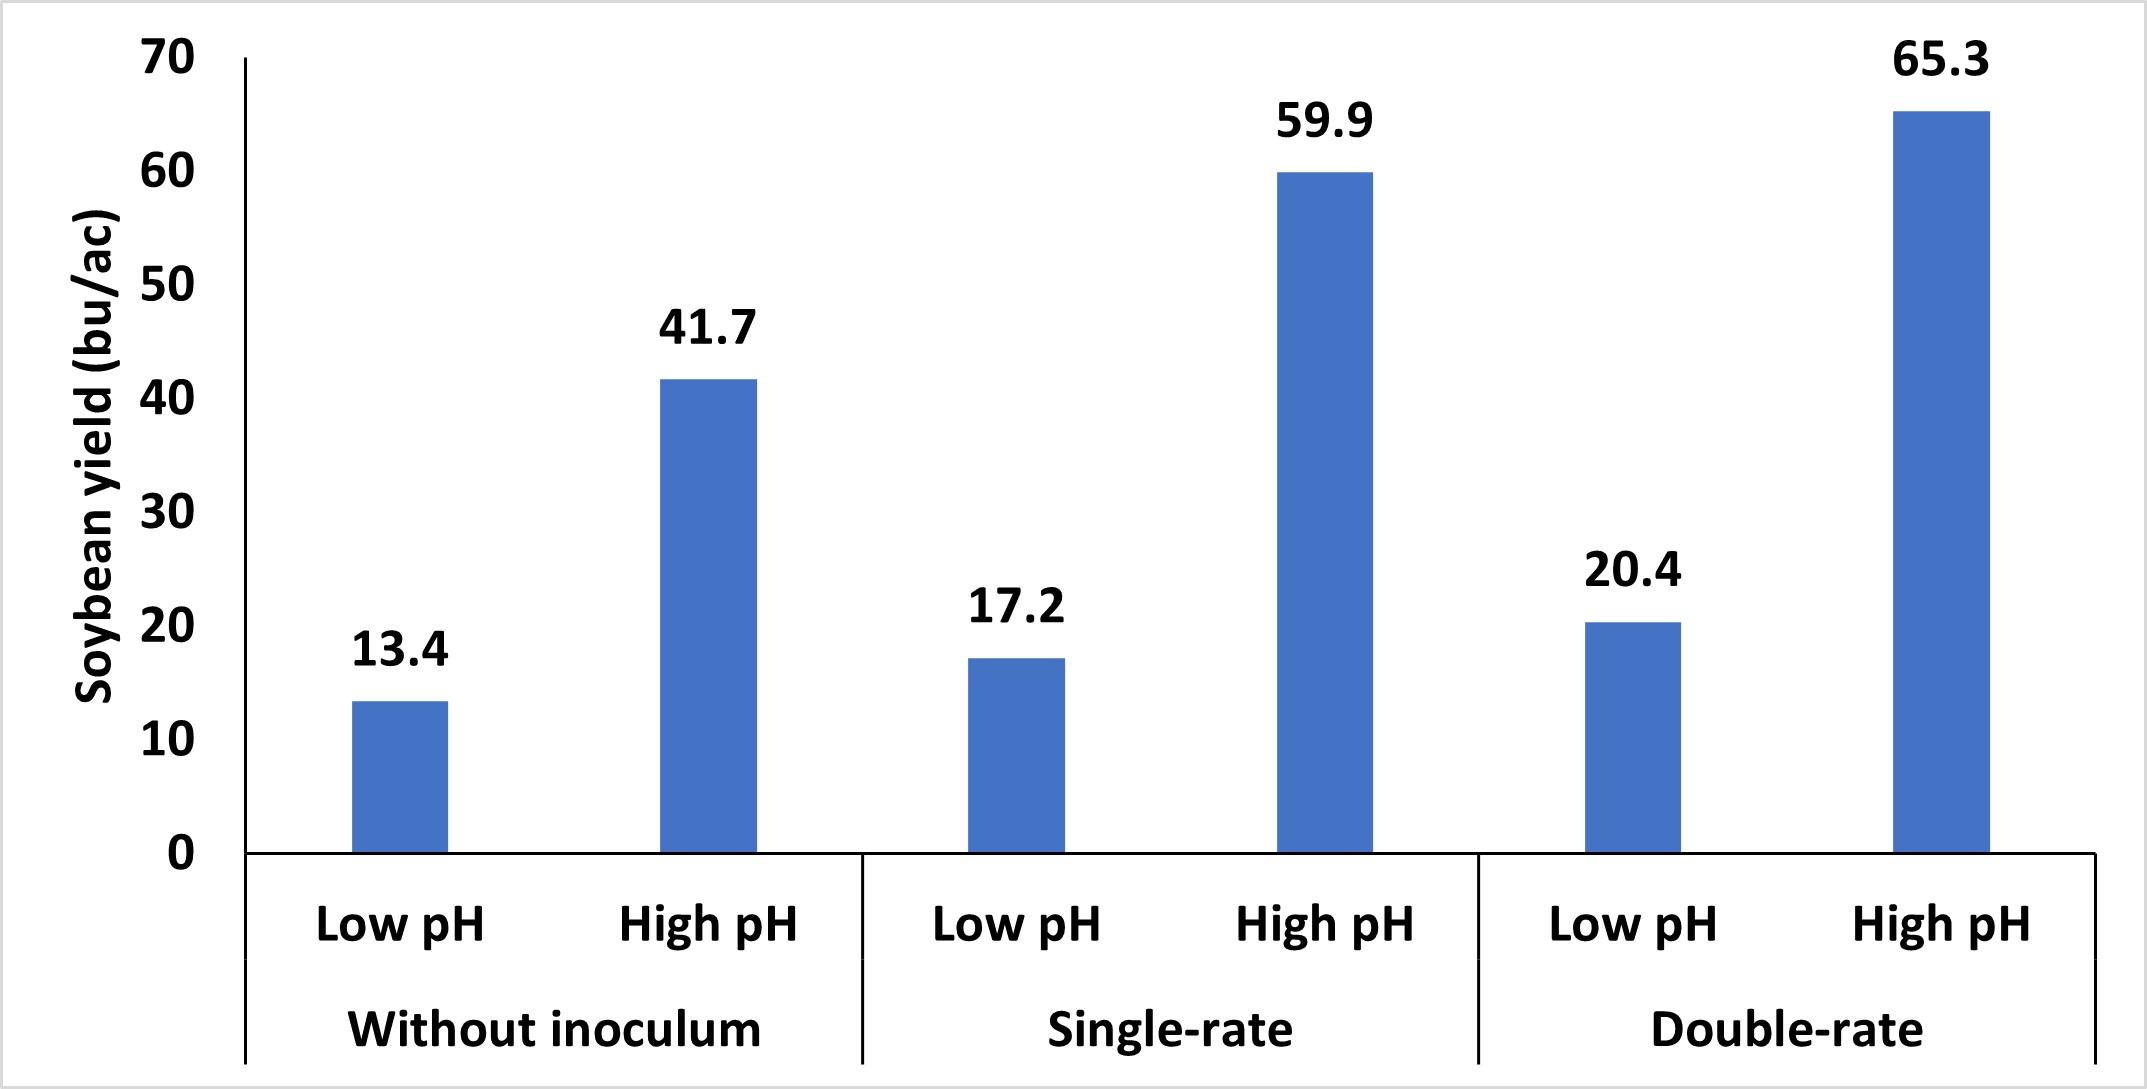
Other soil conditions, such as excessively dry or wet soils, high or low pH, and residual nutrients, can also impact the persistence of these microorganisms. Of these, soil pH has the biggest impact on the survival of these bacteria. High pH is less of a concern to Oklahoma production systems; however, soil with lower pH should be remediated. Like many bacterial systems, these bacteria optimally function at a pH range that closely resembles the ideal pH range for most crops. Lowering the soil pH below a critical threshold reduces the viability of the bacteria, hampers N-fixation processes, and diminishes the capacity of both the bacteria and soybean plants to form and maintain this relationship. While applying inoculum to soybean seeds in these adverse soil conditions can provide some advantages (Figure 3), but it often doesn’t increase yields. Therefore, inoculation with corresponding adjustments to soil pH represents the best approach.
While using inoculum is not a new concept, it is important to highlight the benefits it can provide when utilized correctly. The potential to reduce N input costs is attractive, but the effectiveness depends on proper handling, storage, and soil conditions until it can intercept the host. To maximize benefits, inoculum should be stored in a cool, dark environment and utilized in a timely manner. If there is doubt that there are not enough bacteria, an inoculum should be added. Oklahoma’s climate, particularly hot and dry conditions, can limit bacteria survival, reinforcing the need to treat the inoculum until it is in the ground carefully. Additionally, considering the soil environment is important to sustain the population of bacteria until it can inoculate its host. Emphasis on these small details can have a large impact on the plant’s ability to fix nitrogen and optimize productivity throughout the growing season.
TAKE HOMES
* Soybean requires more lbs of N per bushel than most grain crops.
* Soybeans symbiotic relationship with rhizobia can provide the majority of this nitrogen.
* Soybean rhizobia is not native to Oklahoma soils so should be added to first year soybean fields.
* Inoculum should be treated with care to insure proper nodulation.
* Due to Oklahoma’s climate and existing soil conditions rhizobia may not persist from year to year.
Any questions or comments feel free to contact Dr. Lofton or myself
josh.lofton@okstate.edu
b.arnall@okstate.edu
Appreciation of the Oklahoma Soybean Board for their support of this project.
In-Furrow Placement of Urea Products with Wheat Seed
Its that time of year I always get the question of “How much urea can I put in the furrow?”. My answer is always two fold first, I wouldn’t recommend it, its a risky venture. Even though I know some do it. Second, my research shows very little is any value from N in furrow. I like P but N just doesn’t show me any return. So for me the process is high risk, with little or no potential for return. But with blog I turn to our purple friend up north to share what their research has sown.
Brian
Guest Authors Kansas State University
Lucas Haag, Agronomist-in-Charge, Southwest Research-Extension Center, Tribune lhaag@ksu.edu
Alan Schlegel, retired
Dorivar Ruiz Diaz, Nutrient Management Specialist ruizdiaz@ksu.edu
To save time and cost, some wheat producers may be thinking about adding a little extra nitrogen (N) as urea or UAN to their phosphorus fertilizer through the drill with the seed. This would either be in addition to, or instead of, any preplant N applications.
While a minimum preplant N application of 20 to 40 lbs N per acre is often desirable, especially in no till production systems, there are risk involved when placing urea containing fertilizers in direct seed contact. Traditionally, we have suggested that no urea or UAN solution be placed in contact with the seed. With the continued adoption of air-seeders a common question we receive from producers is can urea, or enhanced urea products be placed in-furrow.
Methods of early-season nitrogen applications
If the starter fertilizer can’t be “spiked” with urea to add extra N, how can the necessary 20 to 40 pounds of N be applied? Subsurface banding (knifing) of N as either anhydrous ammonia, liquid UAN, or dry product will result in the greatest N use efficiency by the wheat crop. This is especially true for no-till wheat production.
If knifed N applications are not used, the next best application method would be surface banding (dribbling) of UAN solution in streams on 15- to 18-inch centers. Broadcasting urea, ammonium nitrate, or UAN applications are not generally as efficient as subsurface banding, but they are often the best choice due to equipment, logistics, or weed management considerations. Broadcast applications of N will have the most consistent performance if followed by light incorporation, precipitation, or irrigation.
Direct seed placement of nitrogen
When placing starter fertilizer in direct contact with wheat seed, producers should use the following guidelines:

The problem with placing urea-containing fertilizer with the seed is that urea is initially converted to ammonia and may be toxic to plant roots if the wheat seed is placed in direct contact with the fertilizer. Producers may hear of someone who has placed urea in direct seed contact and seemed to have no problems, but there are also many cases where urea-containing N fertilizers has injured the developing seedling and reduced or delayed emergence significantly. The risk of injury is greater in drier soils, at higher soil pH levels, and at higher N rates. High soil pH favors a higher concentration of ammonia as compared to ammonium as urea hydrolyzes. There is significant risk associated with placing urea-containing fertilizers in direct seed contact.
The chart below shows how soil texture affected the level of wheat germination when urea-N was applied with the seed in a K-State greenhouse study. The wheat was well watered in this study, but urea-N placed with the seed still reduced germination, especially in the sandy soil. The readings shown below were taken after 10 days. With the high rates of urea used in this study, it is possible that more damage to the seedlings would occur with time as the urea continues to hydrolyze into ammonia.

Field studies have also shown reduced wheat stands due to in-furrow placement of urea. Across 5 site years in western Kansas the placement of urea in-furrow has resulted in decreased stands at spring greenup compared to the control (Figure 2).

The stand reduction becomes especially noticeable at higher rate of N. One of the challenges of understanding the risk of seedling injury is that the magnitude of injury varies by field conditions an years. In some years very little reduction may be evident, even at higher rates of N, while in other years, stand reductions (and their associated impact on yield) is very evident. As an example at Tribune in 2017, reduction in stand caused by urea placement with seed, and their effect on yield were quite evident (Figures 3 and 4).

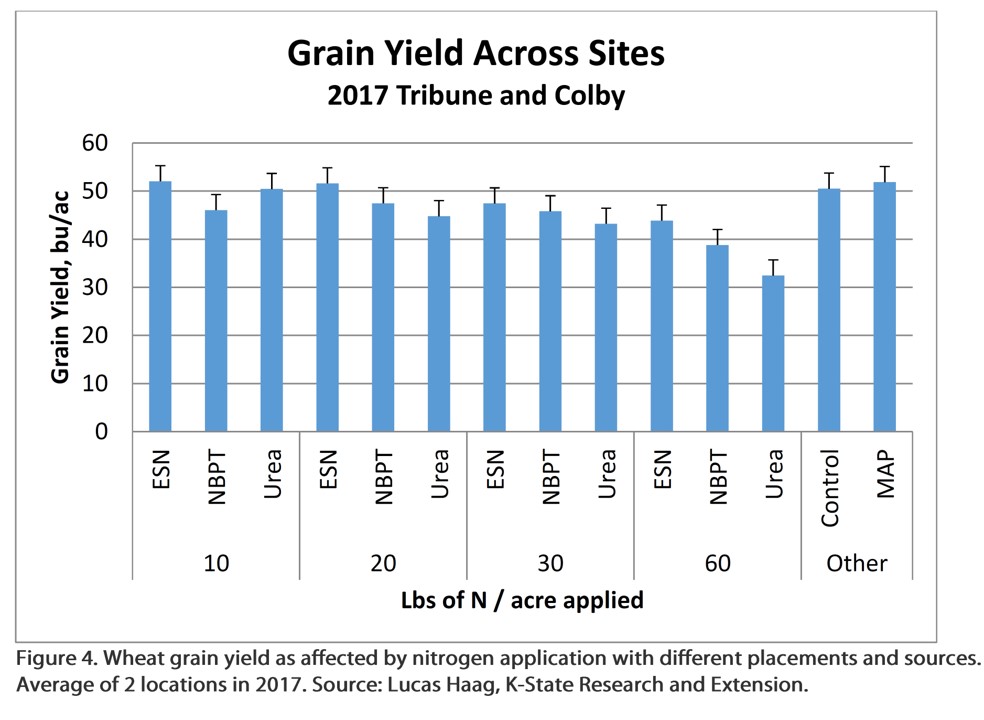
Stands were reduced 32 and 63% compared to the control when 30 and 60 lbs of N as urea were applied in-furrow (Figure 3). This resuled in yield reductions of 14 and 40%, respectively (Figure 4).
If you’d like to apply extra N directly in the seed furrow, one option is to use a controlled-release form of N, such as ESN. As shown in figure 4, at N application rates of 30 lbs/ac and less, where ESN-N was applied in-furrow, wheat yields were essentially the same as where the N was applied pre-plant, and higher compared to the same amount of N applied as urea. At the highest rate of application in the study, 60 lbs/ac, even ESN resulted in stand and grain yield reductions.
Also, air seeders that place the starter fertilizer and seed in a band an inch or two wide, or side band the fertilizer relative to the seed, provide some margin of safety because the concentration of the fertilizer and seed is lower in these diffuse bands. In this scenario, adding a little extra urea containing N fertilizers to the starter less likely to injure the seed – but it is still a risk.
Here is a great video by Dr. Haag.
Chinch bugs are active!
Both Josh Lofton and myself have been talking a lot about the magnitude of chinch bugs we’ve seen this year and the devastation they are having on the crops, both false and true chinch bugs. They have marched through sorghum and now are being found in corn fields. They seen especially bad in failed wheat fields. And in my fields anywhere I had a crabgrass. We are also hearing and seeing a significant increase in blister beetles and stink bugs in soybeans. As a soil scientist all I can recommend is to scout Often, and contact an entomologist or trusted advisor. Kansas State just put out and E-update yesterday with this article from Jeff Whitworth I wanted to share.

Chinch bugs are active in Kansas
Guest Author Jeff Whitworth, Extension Entomologist jwhitwor@ksu.edu
Chinch bugs have historically been a problem in Kansas–in lawns, golf courses, turf farms, etc. But in agriculture, they are mainly a problem in sorghum. However, they can also affect corn and occasionally wheat. Since they are true bugs, chinch bugs may attack any grass where they insert their mouthparts into the plants and suck out the juice. This often has little to no effect on the plant unless there are large numbers of bugs and/or the plants are growing under less-than-ideal conditions so that they are already stressed. Chinch bug feeding simply adds to this stress.
Sampling for chinch bugs the week of July 4 indicated that 95% of the chinch bug population in north central Kansas were adults (Figure 1). Adults don’t feed as much as nymphs but are more concerned with mating, oviposition, etc. This means the majority of feeding in crops (sorghum, corn, etc.) is still to come after the nymphs hatch (Figure 2).
Treating for chinch bugs needs to be accomplished using as much carrier (water) as practical to ensure the insecticide gets good coverage on the plants, including the base of the plants (sprays directed at the base of the plants will help). Nymphs produced now will most likely become adults in 3-4 weeks, then mate and start the process all over again for another generation, which will then move to fall-planted wheat, then on to overwintering sites. They overwinter in bunch grasses then move to wheat in the spring to deposit eggs and start all over again.


Original link https://eupdate.agronomy.ksu.edu/article_new/chinch-bugs-are-active-in-kansas-553-4
To Subscribe to KSU E-update. https://eupdate.agronomy.ksu.edu/index_new_prep.php

Soil sample handling practices can affect soil nitrate test accuracy
From Guest Authors,
Bryan Rutter, PhD student and Soil Testing Lab Manager, Kansas State University
Dr. Dorivar Ruiz Diaz, Soil Fertility Specialist, Kansas State University
The accuracy of a soil test is limited, in part, by the quality of the tested sample. For this reason, strong emphasis is placed on ensuring representative samples are collected in the field. However, these samples must also be handled properly after they have been collected.
Soils are home to a diverse population of microorganisms, many of which help decompose crop residue and cycle nutrients in soils. This nutrient cycling is crucial for crop production, but can skew soil test results if it continues in soil samples after they have been collected.
Microorganisms drive the soil nitrogen cycle
The nitrogen (N) cycle in soils is particularly complex and is strongly influenced by microbial activity and, therefore, temperature and soil moisture conditions. Bacteria and fungi consume organic material and use carbon as an energy source. During this process, N contained in the organic matter undergoes several transformations, ultimately converting it to ammonia. This conversion from organic-N to inorganic-N (NH4+, ammonium) is called “mineralization.” Plants can then take up the ammonium (NH4+), or converted to nitrate (NO3–) by certain bacteria through a process known as “nitrification”.
The microbial activity requires moisture and heat, and the processes described above happen more quickly in warm, wet soils than in cold, dry soils. Microbial activity does not stop just because a sample has been collected and put in a bag. This activity continues as long as the environmental conditions are favorable. As a result, soil tests for plant-available N have the potential to change substantially if samples are not handled properly. This is an important consideration for growers because these soil test results are used to determine the profile-N credit and, ultimately, adjust N fertilizer recommendations.
Research study on soil sample storage
A recent study at the K-State Soil Testing Lab illustrates what can happen if sample submission is delayed. For this study, soil was collected from the Agronomy North Farm (Manhattan, KS) and thoroughly mixed/sieved to homogenize the material. This soil was then placed into sample bags, which were randomly assigned to different combinations of storage temperature and duration. One set of samples was kept in a refrigerator while the other set was kept in a cargo box in a truck bed. To monitor changes in soil test levels over time, three sample bags were removed from the refrigerator and truck box every two days (48 hours) and tested in the lab.
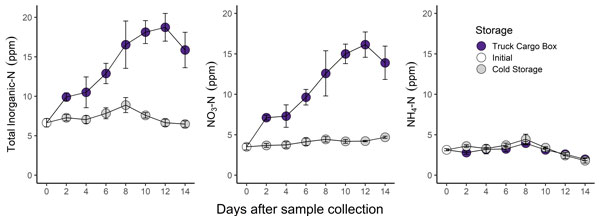
Figure 1. Change in soil test nitrogen parameters over a 14-day storage period. Samples stored in an unrefrigerated cargo box are indicated by purple points. Samples stored in a refrigerator (38F) are indicated by grey points. Graphs by Bryan Rutter, K-State Research and Extension.
Take home points from the K-State Soil Testing Lab study:
- Mineralization and nitrification led to more than a 3x increase in soil test nitrate in the undried and unrefrigerated “Truck Cargo Box” samples (purple points in Figure 1).
- Soil test nitrogen did not change substantially in refrigerated samples.
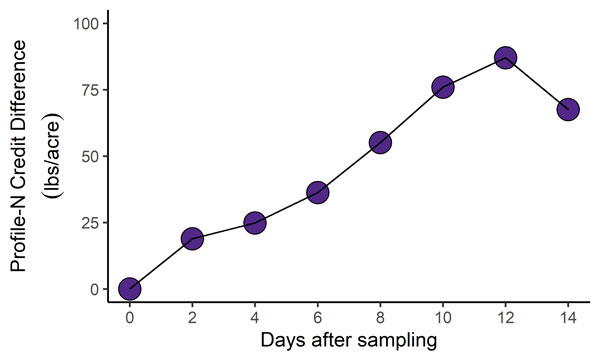
- Profile-N credits calculated from soil test N results were nearly 100 lbs of N/acre higher for the unrefrigerated samples (Figure 2).
- Improper handling and storage of soil samples can dramatically reduce soil test accuracy and may lead to under or overfertilizing crops.
K-State Soil Testing Lab Recommendations
- Submit soil samples to the lab as soon as possible, ideally on the same day they were collected.
- If same-day submission is not possible, samples should be air-dried or placed in a refrigerator set at 40 degrees F or less.
Please see the accompanying article “The challenge of collecting a representative soil sample” for guidance on field soil sampling practices.
For detailed instructions on submitting soil samples to the K-State Soil Testing Lab, please see the accompanying article “Fall soil sampling: Sample collection and submission to K-State Soil Testing Lab”.
For detailed information on how N credits are calculated please see the MF-2586 fact sheet: “Soil Test Interpretations and Fertilizers Recommendations”.
Bryan Rutter, PhD student and Soil Testing Lab Manager
rutter@ksu.edu
Dorivar Ruiz Diaz, Soil Fertility Specialist
ruizdiaz@ksu.edu
The original article can be found on the KSU Agronomy E-update site
https://eupdate.agronomy.ksu.edu/article_new/soil-sample-handling-practices-can-affect-soil-nitrate-test-accuracy-511-4
Pre-plant Irrigation
Sumit Sharma, Irrigation Management Extension Specialist.
Jason Warren, Soil and Water Conservation Extension Specialist.
Pre plant-irrigation is a common practice in Western Oklahoma to recharge soil profile before growing season starts. Pre-plant irrigation is useful when the irrigation capacity is not enough to meet peak ET demand. It can also be important to germinate and provide for optimum emergence of the crop. As such, pre-plant irrigation is not useful when the soil profile is already wet, or soil profile is not deep enough to store moisture, or if planting dates are flexible and can wait until rains can recharge soil profile. Pre-plant irrigation becomes an important consideration if the previous crop had extensive rooting systems, which depleted moisture from deep in the profile. The crops in western Oklahoma especially in the Oklahoma Panhandle depend on stored water in the profile to meet ET demand during peak growth period, especially when well capacities are limited. Deep profiles and excellent water holding capacities of soil found in the region make the storage of a considerable amount of moisture possible. While pre-plant irrigation to recharge the whole profile (which can be 6 feet deep) may not be possible or advised, producers can still use certain tools to assess the stored water in the profile and make decisions on pre-plant irrigation.
A soil push probe (Figure 1) can provide a crude estimate of the moisture in a soil profile. For example, if an average person can push the probe to 2 feet, this means that the first 2 feet of the profile has moisture stored in it. The profile beyond 2 feet is considered too dry to push the probe through. This method does not provide the amount of water stored in the profile. For accurate measurements of soil moisture, soil samples could be collected, weighed, dried and weighed again to determine the water content in the soil. An alternative is to install moisture sensors, however this is usually not practical due to potential damage during planting, although some probes that can be permanently buried are becoming available. On average a clay loam soil in western Oklahoma can hold up to 2 inches of plant available water per foot. The approximate water holding capacity of your soil can be found on the websoilsurvey. Your county extension or NRCS personnel should be able to help you navigate this website if necessary. When the water holding capacity of your soil is known, the use of a push probe can provide a preliminary estimate of soil water content. Probing should be done at multiple locations in the field on both bare and covered (with crop residue) spots. The presence of crop residue reduces evaporation and increases infiltration so the first thing you will notice is that it is generally easier to push the probe into the surface where the ground is covered by residue. If the soil water content is near full the probe will be easy to push into the soil and it may even have mud on its tip when you pull it out. In this case you can estimate that the water content to the depth of penetration is near field capacity and that the current water content is equal to the water holding capacity. For example, if you can push the probe 2 ft into a soil with a water holding capacity of 2 inches/ft then we expect to have 4 inches of plant available water. In contrast if it takes some effort to push the rod 2 ft the estimated water content may be reduced.

When pre-irrigation is applied it can be useful to assess the increase in the depth to which the probe can be pushed into the soil after the irrigation event. For example, if 1 inch of irrigation is applied to the soil in the example above, we may expect that after this irrigation event we can push the rode 2.5 ft. However, in some case we may be able to push the rod 3 ft. The reason being that although we could not push the rod beyond 2 ft before the irrigation event, the soil below this depth was not completely dry. Therefore, the 1 inch of water was able to move to a depth of 3 ft. This is useful information, telling us that the soil below the depth we can push the rod contains some water and that each inch we apply may drain a foot into the profile. Generally, we expect the rooting depth of most crops to be able to extract water from at least 4 ft. Although it is certainly possible to extract water from below this depth, we generally don’t want to pre water our soils to full beyond 4 ft. When we fill the profile with pre water, we are increasing success of the following crop by providing the stored moisture that can offset deficits that may occur in the growing season. However, we are reducing our opportunity to capture and utilize spring rainfall. We must consider this when applying pre-irrigation, because if it is followed by rainfall in excess of ET our irrigation efficiency is greatly reduced by the drainage or runoff that can occur.
In-furrow fertilizers for wheat
From Guest Author, Dr. Dorivar Ruiz Diaz, Nutrient Management Specialist, Kansas State University
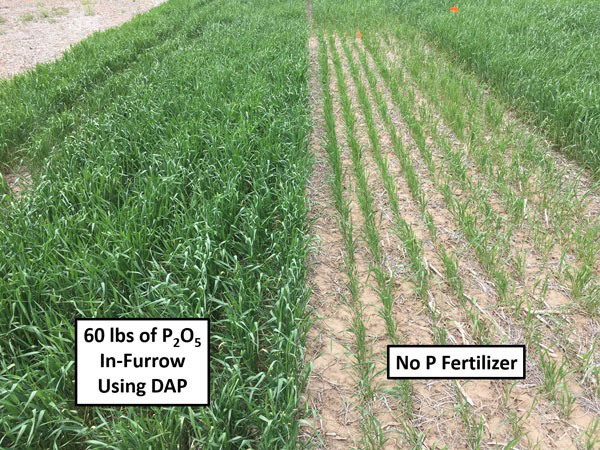
Wheat is considered a highly responsive crop to band-applied fertilizers, particularly phosphorus (P). Application of P as starter fertilizer can be an effective method for part or all the P needs. Wheat plants typically show a significant increase in fall tillers (Figure 1) and better root development with the use of starter fertilizer (P and N). Winterkill can also be reduced with the use of starter fertilizers, particularly in low P testing soils.
In-furrow fertilizer application
Phosphorus fertilizer application can be done through the drill with the seed. In-furrow fertilizer can be applied, depending on the soil test and recommended application rate, either in addition to or instead of, any pre-plant P applications. The use of dry fertilizer sources with air seeders is a very popular and practical option. However, other P sources (including liquid) are agronomically equivalent and decisions should be based on cost and adaptability for each operation.
When applying fertilizer with the seed, rates should be limited to avoid potential toxicity to the seedling. When placing fertilizer in direct contact with wheat seed, producers should use the guidelines in Table 1.
Table 1. Suggested maximum rates of fertilizer to apply directly with the wheat seed
| Pounds N + K2O (No urea containing fertilizers) | ||
| Row spacing (inches) | Medium-to-fine soil textures | Course textures or dry soils |
| 15 | 16 | 11 |
| 10 | 24 | 17 |
| 6-8 | 30 | 21 |
Air seeders that place the starter fertilizer and seed in a 1- to 2-inch band, rather than a narrow seed slot, provide some margin of safety because the concentration of the fertilizer and seed is lower in these diffuse bands. In this scenario, adding a little extra N fertilizer to the starter is less likely to injure the seed – but it is still a risk.
What about blending dry 18-46-0 (DAP) or 11-52-0 (MAP) directly with the seed in the hopper? Will the N in these products hurt the seed?
The N in these fertilizer products is in the ammonium-N form (NH4+), not the urea-N form, and is much less likely to injure the wheat seed, even though it is in direct seed contact. As for rates, guidelines provided in the table above should be used. If DAP or MAP is mixed with the seed, the mixture can safely be left in the seed hopper overnight without injuring the seed or gumming up the works. However, it is important to keep the wheat mixed with MAP or DAP in a lower relative humidity. A humidity greater than 70% will result in the fertilizer taking up moisture and will cause gumming or caking within the mixture.
How long can you allow this mixture of seed and fertilizer to set together without seeing any negative effects to crop establishment and yield?
The effects of leaving DAP fertilizer left mixed with wheat seed for various amounts of time is shown in Figure 2. Little to no negative effect was observed (up to 12 days in the K-State study).

Although the wheat response to these in-furrow fertilizer products is primarily from the P, the small amount of N that is present in DAP, MAP, or 10-34-0 may also be important in some cases. If no pre-plant N was applied, and the soil has little or no carryover N from the previous crop, the N from these fertilizer products could benefit the wheat.
Dorivar Ruiz Diaz, Nutrient Management Specialist
ruizdiaz@ksu.edu
Chris Weber, former Graduate Research Assistant, Soil Fertility
Sorghum: Late season management and pests emerging
Josh Lofton- Cropping System Specialist
Tom Royer- Extension entomologist/IPM coordinator
Full-season sorghum across the state is reaching maturity, while late-season and double-crop sorghum are at various stages of early reproductive growth. In the last several weeks, insect pressure has been a major issue throughout the state. Therefore, growers will be left with several management decisions in the next several weeks.
Harvest management for sorghum:
Sorghum harvest aids or desiccants have been periodically used in sorghum throughout Oklahoma. Several reasons exist for growers to use these practices; however, two primary reasons include drying down the vegetative portion of the sorghum plant or managing late-season weeds present in field. Most years in the southern Great Plains, as with this one, there is very little need to rapidly dry-down the primary sorghum stem and first tillers. Higher temperatures, higher winds, and lower humidity will often result in the plant drying at a similar rate to the grain. Since desiccants have little impact on dry-down of the grain, this can result in rapid stem dry-down potentially leading to lodging issues. However, later tillers could still be maturing and take much longer to finish grain and dry-down. Growers have to decide if it is worth waiting for these later tillers prior to harvest. Often, the presence of wildlife and the risk of lodging will result in growers harvesting closer to when the main stem matures. Growers can use desiccants to rapidly dry-down these later tillers, which terminates the tillers. Some grain in these may be harvestable, depending on how close the grain was to black-layer.
The second reason for using desiccants is to help manage late-season weeds in the sorghum crop. Grassy weeds, especially Johnsongrass, are the primary weeds of concern. Currently, few in-season options are available to help control grasses in sorghum. The problem with Johnsongrass is that resources developed can be stored over winter in rhizomes for the successive year’s plants. Using late-season desiccation treatments can limit the transfer of these resources to the storage portions Johnsongrass. Further information regarding using harvest aids in grain sorghum can be found in PSS-2183 (Using Harvest Aids in Grain Sorghum Production | Oklahoma State University (okstate.edu)).
Sorghum pests emerging:
In recent weeks discussion has focused on armyworms and their impact not only on lawns but crops. While these can still be a major issue on crops, especially those that are still vegetative. Most of the impact will be in those crops planted late, without a large amount of vegetative growth. While these are still a major concern, other pests are around. Stinkbugs have been present in sorghum for several years, but they are not normally at high populations, or are not widespread enough to cause major issues. However, we experienced an increased number of calls regarding stinkbugs this year. The particle stinkbug of interest is rice stinkbug. The question becomes, “When do growers need to think about treating for stinkbugs in sorghum?” The best fit for Oklahoma sorghum growers for a treatment threshold for rice stinkbug is to sample 30 emerged heads, and treat when the average number is 0.5 to 1 stinkbug per head. Research based damage thresholds numbers are per acre, not numbers per plant. Therefore, the 0.5 per head threshold is for higher plant populations, and the 1 per head is for lower plant populations. A number of products are available for control of panicle feeding bugs in sorghum.
Nitrogen rate and timing for a forage wheat crop. Year 1 Results.
Written by
Mr. Bronc Finch, PhD. Student, Precision Nutrient Management.
Dr. Brian Arnall, Precision Nutrient Management Extension Specialist.
In cooperation with Dr. James Rogers, Noble Research Institute.
With the amount of wheat acreage in Oklahoma being utilized for grazing cattle, and much of that land grazed completely instead of harvested for grain, many questions have arose regarding the management of grazed cropland. A major question in the management of a graze-out wheat crop pertains to fertilizer management strategies. A study developed in co-operation with the Noble Research Institute is attempting to answer these questions among others. In 2019 the trial was established at three locations: near Lake Carl Blackwell in Stillwater, OSU South Central Research Station in Chickasha, and Noble Research Dupy farm in Gene Aurty, Oklahoma. Each of these three sites were setup with three nitrogen (N) treatments in Gallagher winter wheat, with 2 pre-plant applications of 60 and 120 pounds per acre, and a 60 pound pre-plant and 60 pound top-dress application. Grazing simulation harvests were taken at two times with the top-dress N being applied after regrowth was noticed following the winter season. The Dupy location was planted late and therefore only had a single harvest at the end of the season. Rising plate meter measurement were collected at feekes 7.5 and represented in the graphs below as Mid-season. The Chickasha location revealed unexpectedly high residual soil N levels, which resulted in no differences in dry matter biomass for the first harvest, which was delayed until early march due to excessive rains. The second harvest at Chickasha did show treatment differences with a 0.4 ton difference between the 60 and 120 lbs preplant N rates and increase of 0.8 ton increase over the 120 lb pre-plant when the additional 60 lbs of N was delayed. LCB had a timely first harvest in December resulting in the 120 lb N application outperforming the 60lb N applications by ≥0.33 tons. The second harvest further showed how the split application of N proves beneficial for biomass production. As the split application increased yields by 1.7 and 2.6 tons over the 120 lb and 60 lb preplant applications, respectively. The Dupy location revealed no significant difference in dry matter biomass yield between N treatments at the time of the rising plate meter measurements or for the final cutting.
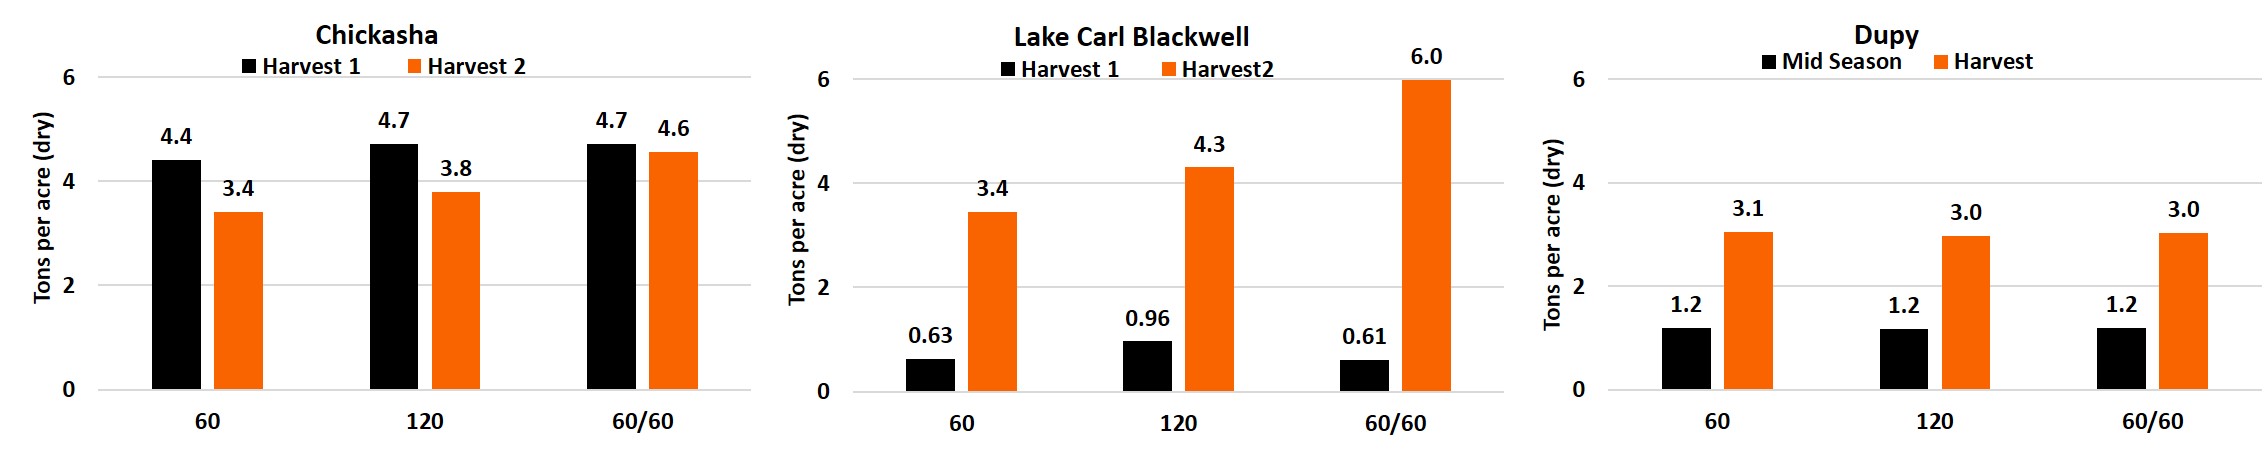
Figure 1. Dry matter harvest results for each of the harvest dates from the graze out wheat trials from the Chickasha, Lake Carl Blackwell, and Dupy locations for three fertilizer treatments. 60: 60 lbs of nitrogen applied preplant, 120: 120 lbs of nitrogen applied preplant, 60/60: Split application 60 lbs of nitrogen preplant and 60 lbs applied top-dress. Dupy only had one harvest date, the Mid-season yield is estimated via rise-plate measurements taken at Feekes 7.5.
The Chickasha and Lake Carl Blackwell (LCB) locations produced an increase in total yield with both the increase of applied N and the split application of N. The 60 lb increase in applied N at preplant, 60 lbs vs 120 lbs, produced a 0.7 and 1.2 ton increase in total dry matter harvested at Chickasha and LCB, respectively. As expected an increase in N increased the yield of wheat biomass for grazing production. The top-dress application, which was made as a late season post Feekes 6 (hollow stem), produced more biomass for graze-out wheat production. The split application of 60 lbs of N preplant and 60 lbs of N top-dress increased dry matter by .8 and 1.3 tons over 120 lbs applied preplant at Chickasha and LCB, respectively. Chickasha yielded higher biomass production than the LCB location due to increased residual N.

Figure 2. Total dry matter harvest results for the graze out wheat trials from the Chickasha, Lake Carl Blackwell (LCB), and Dupy locations for three fertilizer treatments. 60: 60 lbs of nitrogen applied preplant, 120: 120 lbs of nitrogen applied preplant, 60/60: Split application 60 lbs of nitrogen preplant and 60 lbs applied top-dress.
For the following discussion remember that protein is determined by N concentration, so that a increase in N uptake is the same as an increase in protein. Evaluation of the N uptake (% N in the biomass x amount of biomass harvested) over the season revealed treatment effects at all locations, which was not seen from biomass yield. Chickasha and LCB revealed a 20% or greater increase in N uptake with the 120 lb application over the 60 lb application of N at pre-plant. The late season top-dress application yielded a 3, 27, and 27 percent increase in uptake for Chickasha, LCB, and Dupy locations, respectively, over the 120 lb pre-plant application. Although, these results are expected from these results, there are a few things we did not expect. The 120 lb N application did not increase the N uptake above that of the 60 lb application. However, the split application of N resulted in an additional >40 lbs uptake, aka increased protein.
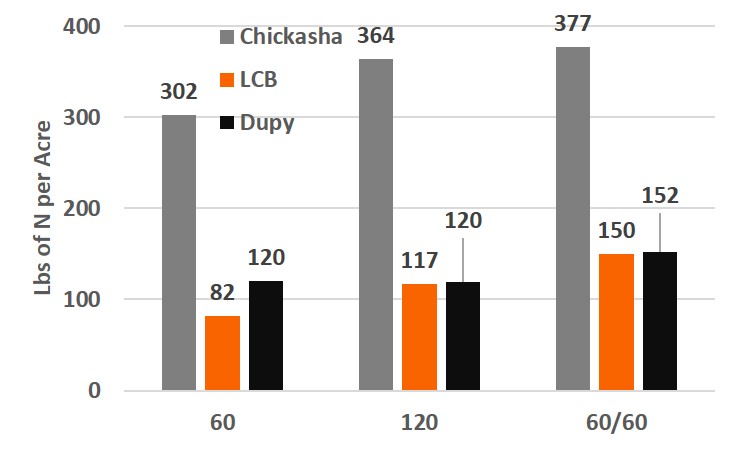
Figure 3. Total nitrogen uptake results for the graze out wheat trials from the Chickasha, Lake Carl Blackwell, and Dupy locations for three fertilizer treatments. 60: 60 lbs of nitrogen applied preplant, 120: 120 lbs of nitrogen applied preplant, 60/60: Split application 60 lbs of nitrogen preplant and 60 lbs applied top-dress.
This study also includes summer forages with and without additional fertilizer. The study will be continued for multiple years on the same locations to evaluate the impact of management on production and soil characteristics. But one surprising note has already been made, in all three locations a greatly delay top-dress still increased N-uptake. In two location it significantly increase yield and protein. This data is falling in line with the grain only data (How late can you wait) showing that an application of N at Feekes 6 (Hollow stem) and even shortly after can provide positive return on investments.
For any questions for comments please contact
Brian Arnall
b.arnall@okstate.edu
405-744-1722
Watch Forage Nitrate Closely on Certain Crops
Nitrate is one of the major nitrogen (N) forms utilized by plants. Excessive nitrate accumulation can occur when the uptake of nitrate exceeds its utilization in plants for protein synthesis due to factors such as over N fertilization and stressful weather conditions. It can be toxic to livestock when too much nitrate is accumulated in the forage crops. Sorghum and millet have been noted as having a high potential for accumulating nitrate. Producers should watch their forage nitrate closely to avoid cattle fatality and to better manage their hay crop since we have seen many high nitrate forage samples every year. Normally, drought stress, cloudy weather and other climatic conditions will enhance nitrate accumulation in the plant. In addition, forage planted in failed wheat fields with high soil residual nitrogen unused by wheat can result in high forage nitrate problem too.

Figure 1. Summary of our laboratory nitrate test results in the past on two major warm season forage crops.
It is considered potentially toxic for all cattle when nitrate in the forage is greater than 10,000 ppm. Producers should avoid grazing or feeding with high nitrate hays. More detailed interpretation can be found from OSU Extension Fact PSS-2903 Nitrate Toxicity in Livestock. The most reliable way to find out nitrate in the hay is to collect a representative sample and have it tested by a laboratory. OSU Extension Fact PSS-2589 Collecting Forage Samples for Analysis highlights the proper techniques to collect forage samples. Samples can be submitted for nitrate and other forage quality analyses to the Soil, Water and Forage Analytical Laboratory in Stillwater through the local county extension office. We normally have the results ready within 24 hours form the time when sample is received by the lab. However, many samples we receive at the lab were not sampled properly. More attention should be paid on sampling standing forage, such as a haygrazer by following the right procedures:
Clip at least 20 representative plants at grazing or harvesting height from the suspected area. Cut the whole plants (include leaves and heads) into 2-3” long pieces, combine and mix well in a bucket.
Fill the cut sample into a forage bag. Use quartering to reduce the amount if there is too much sample to send to a lab.
Put the forage bag into a plastic bag will give you more accurate moisture content, but never put plastic bags inside our forage bags.
There is also a quick screening test using diphenylamine at your county extension office. This video shows how to properly use the test kit: https://www.youtube.com/watch?v=vArUP6KFQFI&feature=youtu.be
Hailin Zhang
Department of Plant and Soil Sciences
