Home » Corn
Category Archives: Corn

Corn Hybrids’ Yield Response to Limited Well Capacities in the Central High Plains
Macie McPeak: M.S in Irrigation and Water Management
Sumit Sharma : Extension Specialist for High Plains Irrigation and Water Management
Background
The Central High Plains, which include the Oklahoma Panhandle, Southwest Kansas, Southeast Colorado, and Northern Texas Panhandle, is a heavily farmed semi-arid region that depends on the Ogallala Aquifer for irrigation to ensure stable crop yields. However, the continuous decline of the Ogallala Aquifer has resulted in increased need for irrigation strategies that conserve water while maintaining crop profitability. Corn remains the most water consuming crop with highest productivity per unit of irrigation applied, and strong economic returns in the Central High Plains region. However, corn is also the most sensitive to water stress among all the existing cropping systems (including sorghum, cotton, and sunflower, soybeans and wheat). Declining water table has reduced the well capacities in many areas in the region, which cannot meet crop water demand, making it a growing challenge for corn production. Therefore, there is a need for research in irrigation strategies and agronomic choices such as drought tolerant hybrids, seeding rate, planting date, and hybrid maturity for sustainable and profitable corn production with reduced well capacities in the region. This blog discusses the yield response of different corn hybrids to limited well capacities in the Oklahoma Panhandle area of the Central High Plains.
Limited well capacities only meet partial crop water demand, which in general leads to yield declines especially in high water demanding crops such as corn. Several previous studies suggest that crop productivity does not significantly decrease as long as irrigation is maintained at approximately 75–80% of full evapotranspiration (ET) replacement (Su et al., 2022; Klocke et al., 2007; Zhao et al., 2019). However, when irrigation levels are more restricted, such as under reduced well capacities, there can be substantial yield losses and diminished economic returns. The magnitude of yield reduction varies with region, hybrids, and growth stage at which water stress occurred. For example, in the Central High Plains the corn ET demand is highest in Texas Panhandle and decreases as we move north towards Nebraska. Zhao et al. (2019) found that applying 75% ET in the Texas Panhandle produced corn yields equivalent to full irrigation, whereas reducing irrigation to 50% caused significant yield reductions. Similarly, Klocke et al. (2007) reported that limited irrigation at roughly 50% of full ET replacement in Nebraska achieved 80–90% of fully irrigated yields across multiple crop rotations. Therefore, the irrigation strategies which work in one region may not work the same way in other regions with different crop water demand and must be tested for the region-specific climatic conditions.
The current study was conducted in 2025 at the Oklahoma Panhandle Research and Extension Center in Goodwell, OK. Four Pioneer brand corn hybrids including P13777 (113 day maturity), P10625 (110 day maturity), P05810 (105 day maturity), and P14346 (114 days maturity) were planted at 22,000 and 28,000 seeds per acre. The hybrids were irrigated with a center pivot fitted with variable rate irrigation system at 200, 300, 400, and 500 GPM well capacities. The well capacities were simulated by adjusting the frequency of irrigation events.
Results & Discussion
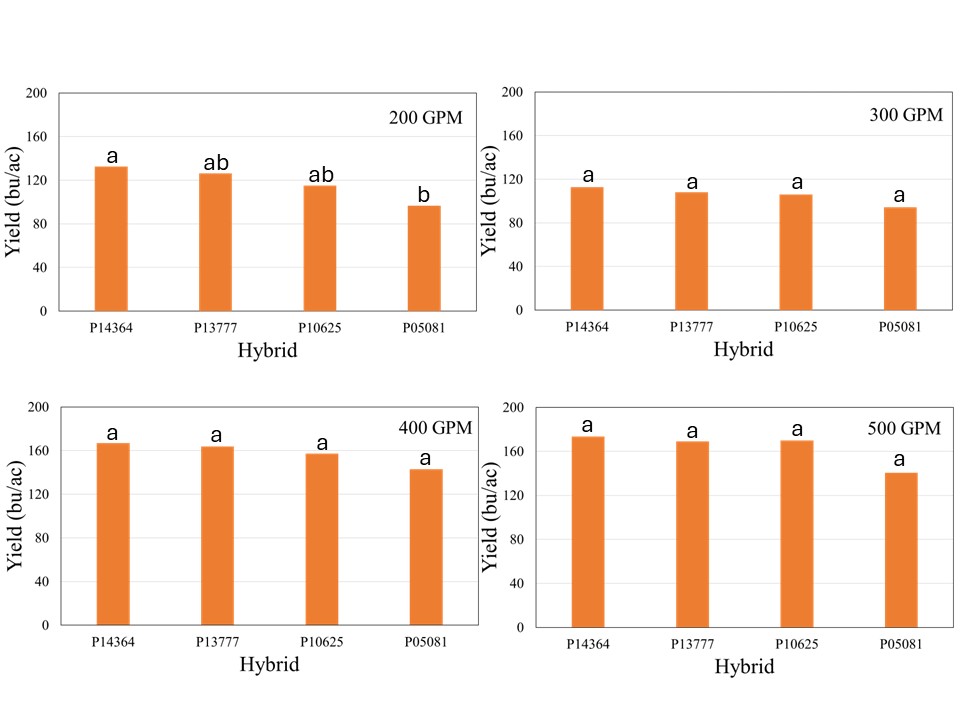
The crop received 12.1 inches of rain from planting until physiological maturity, while total rainfall from April till September was over 15 inches. Manual probing of the field showed near 4 feet soil profile at the time of planting which can hold up to 2 inches of plant available water per foot. The well capacities 200, 300, 400, and 500 GPM treatments received 7.4, 8.9, 10.8, and 12.0 inches of irrigation, respectively. The data showed no significant effect of population on corn yield across hybrids for any well capacity. However, the hybrids showed significant interaction with well capacities, which indicated that hybrid yield response varied at different capacities (Figure 1). In general, the average yield declined from longest maturity to shortest maturity hybrids irrespective of the well capacity, but was only statistically significant at for 200 GPM (Figure1). At this irrigation level, the shortest maturity hybrid P05081 yielded significantly lower yield than longest maturity hybrid P14364, while P13777 and P10625 were not different from either of these two hybrids.
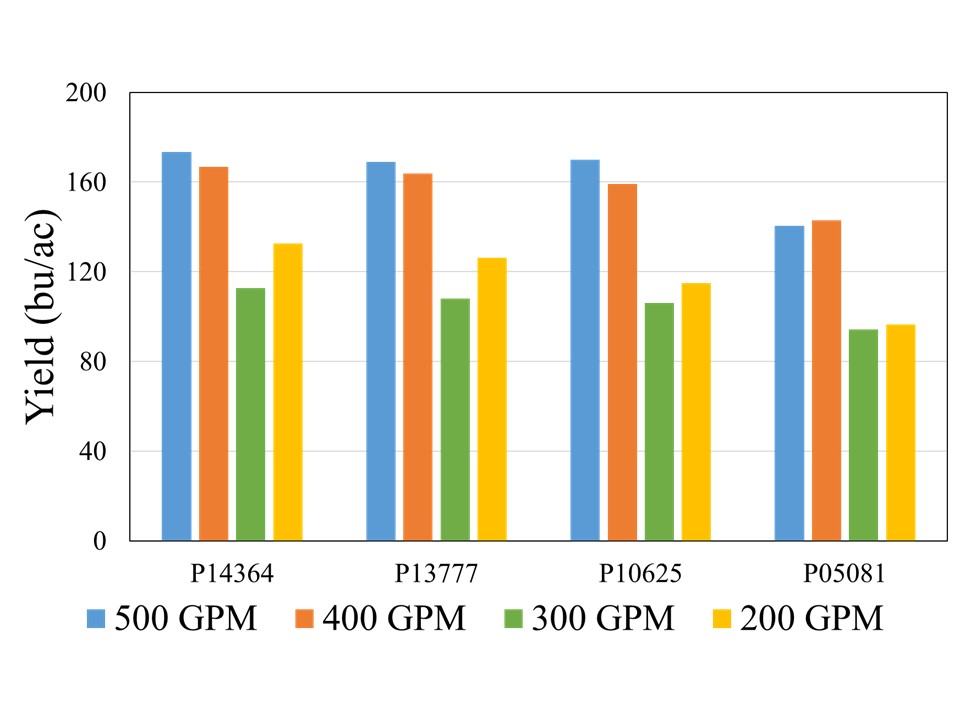
Although there was no statistical difference among the hybrids at 500, 400, and 300 GPM, when compared across well capacities, yield reductions were most pronounced at the 200 and 300 GPM irrigation levels for each individual hybrid, indicating that irrigation capacity was the primary yield limiting factor under restricted water availability (Figure 2). While the exact causes of this abrupt decline are not yet understood, as mentioned in the beginning of this blog, previous literature has suggested that severe yield decline in corn can be expected when irrigation is reduced to 60% ET replacement in the study region. Both 300 and 200 GPM well capacities met 60 and 65% crop ET demand, while 400 and 500 GPM met 71 and75% crop ET demand, respectively. More data will be needed to ascertain these threshold levels of well capacities for corn production in this region.
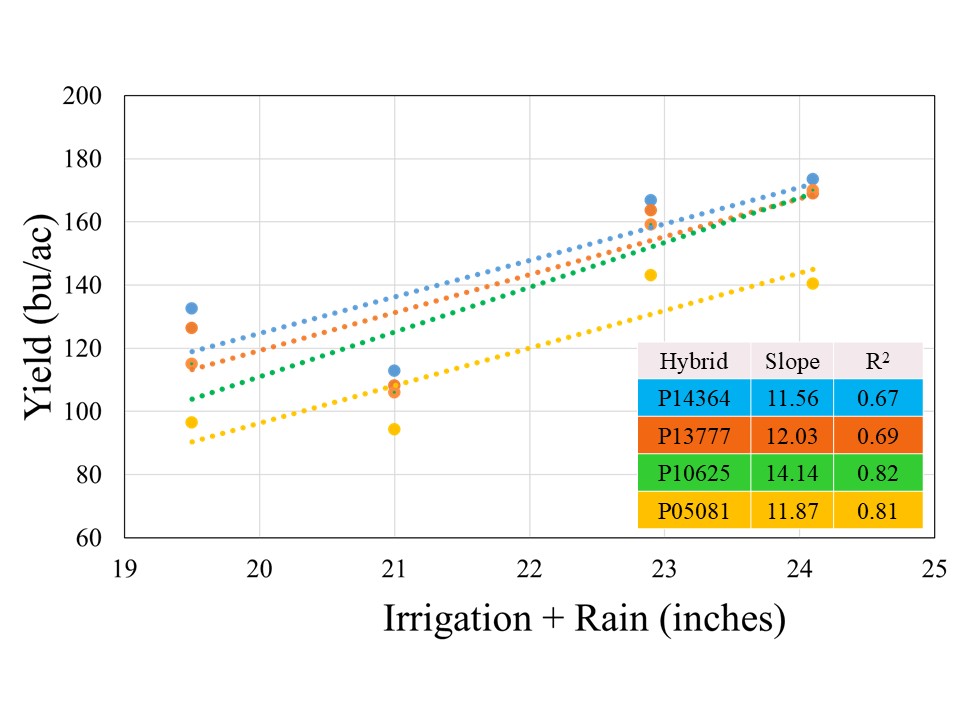
All the hybrids showed a positive yield response to Irrigation+Rain with different yield gains per inch of water applied (Figure 3). Hybrid P10625 registered highest yield gain of 14.1 bushel per inch of water applied, followed by P13777 (12.0 bu), P05081 (11.9 bu), and P14364 (11.6 bu). The stronger coefficient of regression (>80%) for two short maturity varieties indicated that irrigation was stronger yield limitation factor for these hybrids, in comparison to 114 and 113-day maturity hybrids for irrigation explained on 67 and 69% variability, respectively. This suggests that besides irrigation there might be other factors which could contribute to filling the yield gaps for given irrigation levels in longer maturity hybrids.
Planting population did not significantly affect grain yield across irrigation capacities. When pooled across the hybrids for individual planting populations, 28,000 seeding rates resulted in gain of 0.1, 2.6, 5, and 12 bushels per acre for 200, 300, 400, and 500 GPM, respectively. This indicates that higher planting populations at well capacities of 400 or above should be considered, while reducing population at 300 GPM or lower might be more cost-effective option.
Take Home
- Irrigation capacity remains the primary determinant of yield potential under limited well capacities in the Central High Plains.
- Pre-irrigation and recharging the soil profiles will be critical to support crop water demand for limited well capacities.
- Short maturity hybrids appeared to have consistently lower average yield and more vulnerable for yield losses at limited irrigation. However, one must consider that the growing conditions were more conducive for corn production in 2025 which generally favor long maturity hybrids. Therefore, long-term data will be required to assess the performance of short maturity hybrids during inclement growing seasons.
- Even though population didn’t significantly influence the grain yield. The 28,000 seeding rates overall had higher average yield at 400 and 500 GPM. Therefore, producers should consider the higher population at these well capacities or more.
- Overall, irrigation is the most important factor for yields, but there is a need for long-term agronomic data on hybrid maturity and population along with economic analysis to ascertain these findings.
Thoughts from an Agronomist- 1 Management of the Primordia
Josh Lofton, Cropping Systems Specialist
Many crop management recommendations emphasize actions that must be taken well before a crop reaches what we often call “critical growth stages.” Management this early can seem counterintuitive when the crop still looks small, healthy, or unchanged aboveground. However, much of a crop’s yield potential is determined early in the season at a level we cannot see in the field. Long before flowers, tassels, or heads (or any reproductive structure) appear, the plant is already making developmental decisions that shape its final yield potential. Understanding this “behind the scenes” process helps explain why timely, early-season management is often more effective than trying to correct problems later.
At the center of this process is the shoot apical meristem, commonly referred to as the growing point. This tissue produces leaf and reproductive primordia, which are the earliest developmental stages of future everything in the plant. These primordia form well before the corresponding plant parts are visible. Once these structures initiate—or if they fail to begin due to stress—the outcome is permanent. The plant cannot later in the season go back and recreate leaf number, leaf size, or reproductive capacity. As a result, early environmental conditions and management decisions play a disproportionate role in determining yield potential.
Corn is a good example of how early development influences final yield. By the time corn reaches the V4 growth stage, the plant only has four visible leaves with collars, yet internally it is far more advanced. Most of the total leaf primordia that will eventually form the full canopy have already begun, and the potential size of the ear is starting to be established. During this stage, the growing point is still below the soil surface and somewhat protected from some stressors but highly susceptible to others. Nitrogen deficiency, cold temperatures, moisture stress, compaction, or herbicide injury at or before V4 can reduce leaf number and limit leaf expansion. Even if growing conditions improve later, the plant cannot replace leaf primordia that were never formed, which reduces its ability to intercept sunlight and support high yields.
As corn approaches tasseling (VT), the crop enters a stage that is visually and physiologically important. Pollination, fertilization, and early kernel development occur at this time, and stress can have a critical impact on kernel set. However, by VT, the plant has already completed leaf formation, and much of the ear size potential has already been determined several growth stages earlier. Management at VT is therefore focused on protecting yield rather than creating it. Late-season nutrient applications may improve plant appearance or maintain green leaf area, but they cannot increase leaf number or rebuild ear potential lost due to early-season stress. This distinction helps explain why some late inputs show limited yield response even when the crop looks responsive.
Grain sorghum provides another clear example of why early management is emphasized. Although sorghum often grows slowly early in the season and may appear unimportant during the first few weeks after emergence, the first 30 days are among the most critical periods in its development. During this time, the growing point is actively producing leaf primordia and transitioning from vegetative growth toward reproductive development. Head size potential is primarily established during this early window, and the plant’s capacity to support tillers is influenced by early nutrient availability and moisture conditions. Stress from nitrogen deficiency, drought, weed competition, or restricted rooting during the first 30 days can reduce head size and kernel number long before visible symptoms appear.
Once sorghum reaches later vegetative and reproductive stages, much like corn at VT, management shifts from building yield potential to protecting what has already been determined. Improving conditions later in the season can help maintain plant health and grain fill, but it cannot fully compensate for early limitations imposed at the primordial level. This is why early fertility placement, timely weed control, and moisture conservation are consistently emphasized in sorghum production systems.
Across crops, a typical pattern emerges: the growth stages we observe in the field often reflect decisions the plant made weeks earlier. When agronomists stress early-season management, they are responding to plant biology rather than simply following tradition. By the time visible “critical stages” arrive, the plant has already established many of the components that define yield potential.
The key takeaway is that effective crop management must be proactive rather than reactive. Early-season decisions support the crop while it is still determining how many leaves it can produce, how large its reproductive structures can become, and how much yield it can ultimately support. Waiting until stress becomes visible often means responding after the plant has already adjusted its potential downward. Recognizing what is happening at the primordial level helps explain why management ahead of critical stages consistently delivers the greatest return, even when the crop appears small and unaffected aboveground.
For questions or comments reach out to Dr. Josh Lofton
josh.lofton@okstate.edu
Toto, I’ve a feeling we’re not in Kansas anymore. Double Cropping, Orange edition
It has been pointed out that the blog https://osunpk.com/2025/06/09/double-crop-options-after-wheat-ksu-edition/ had a significant Purple Haze. And I should have added the Oklahoma caveat. So Dr. Lofton has provided his take on DC corn in Oklahoma.
Double-crop Corn: An Oklahoma Perspective.
Dr. Josh Lofton, Cropping Systems Specialist.
Several weeks ago, a blog was published discussing double-crop options with a specific focus on Kansas. I wanted to address one part of that blog with a greater focus on Oklahoma, and that section would be the viability of double-crop corn as an option.
Double-crop farming is considered a high-risk, high-reward system to try. Establishing a crop during the hottest and often driest parts of summer can present challenges that need to be overcome. Double-crop corn faces these same challenges and, in some seasons, even more. However, it is definitely a system that can work in Oklahoma, especially farther south. If you look at that original blog post, one of the main challenges discussed is having enough heat units before the first frost. When examining historic data, like those below from NOAA, the first potential frost date for Northcentral and Northwest Oklahoma may be as early as the first 15 days of October but more often will be in the last 15 days of October. In Southwest and Central Oklahoma, this date shifts even later to the first 15 days of November. This is later than Kansas, especially northern Kansas, which has a much higher chance of experiencing an early October freeze. I do not want to downplay this risk; however, it is one of the biggest risks growers face with this system, and a later fall freeze would greatly benefit it. We have been conducting trials near Stillwater for the past five years on double-crop corn and have only failed the crop once due to an early freeze event. But in that year, both double-crop soybean and sorghum also did not perform well.

The main advantage of double-crop corn is that if you miss the early season window, it offers the best chance for the crop to reach pollination and early grain fill without the stress of the hottest and driest part of the year. Therefore, careful management is crucial to ensure this benefit isn’t lost. In Oklahoma, we have two systems that can support double-crop corn. In more central and southwest Oklahoma, especially under irrigation, farmers can plant corn soon after wheat harvest, similar to other double-crop systems. This planting window helps minimize the impact of Southern Rust, which can significantly reduce yields in some years, and may reduce the need for extensive management. This earlier planting window is often supported by irrigation, enabling the crop to endure the hotter, drier late July and early August periods. Conversely, in northern Oklahoma, planting often occurs in July to allow pollination and grain fill (usually 30-45 days after emergence) to happen in late August and early September. During this period, the chances of rainfall and cooler nighttime temperatures increase, both of which are critical for successful corn production.
Other management considerations include maturity. Based on initial testing in Oklahoma, particularly in the northern areas, we prefer to plant longer-maturity corn. Early corn varieties have a better chance of maturing before a potential early freeze but also carry a higher risk of undergoing critical reproduction stages (pollination and early grain fill) during hot, dry periods in late summer. Testing indicates that corn with a maturity of over 110 days often works well for this. However, this does not mean growers cannot plant shorter-season corn, especially if the season has generally been cooler, though the risk still exists depending on how quickly the crop can grow. Based on testing within the state, the dryland double-crop corn system typically does not require adjustments to other management practices, such as seeding rates or nitrogen application. Because of the need to coordinate leaf architecture and manage limited water resources, higher seeding rates are not recommended. Maintaining current nitrogen levels allows the crop to develop a full canopy.
The final question often comes as; how does it yield? This will depend greatly. Corn looks very good this year across that state, especially what was able to be planted earlier in the spring. However, in recent years, delaying even a couple of weeks beyond traditional planting windows has lowered yields enough that double-crop yields are often similar. We have often harvested between 50-120 bushels per acre in our plots around Stillwater with double-crop systems. So, the yield potential is still there.
In the end, Oklahoma growers know that double-crop is a risk regardless of the crop chosen. There are additional risks for double-crop corn, such as Southern Rust in the south and freeze dates in the north. This risk is increased by the presence of Corn Leaf Aphid and Corn Stunt last season, and it is not clear if these will be ongoing problems. Therefore, growers need to be careful not to expect too much or to invest too heavily in inputs that may not be recoverable if there is a loss. One silver lining is that if double-crop corn doesn’t succeed in any given year, growers can still use it as forage and recover at least some of their costs.
Any questions or concerns reach out to Dr. Lofton: josh.lofton@okstate.edu
Meet the Aster Leafhopper and Learn How to Distinguish it from the Corn Leafhopper
Ashleigh M. Faris: Extension Cropping Systems Entomologist, IPM Coordinator
Release Date June 3 2025
Last year’s corn stunt disease outbreak, caused by the corn leafhopper transmitting pathogens associated with corn stunt disease, has been on everyone’s minds. Over the past few weeks, I’ve received several calls from growers, crop consultants, and industry partners concerned about leafhoppers in corn. Fortunately, none have been corn leafhoppers, the vast majority have instead been aster leafhoppers. So far, no corn leafhoppers have been reported north of central Texas. Oklahoma did not have any reports of overwintering corn leafhoppers so if we have the insect this year it will need to migrate northward from where it currently resides. For a refresher on the corn leafhopper and corn stunt disease, check out these two previously posted OSU Pest e-Alerts: EPP-25-3and EPP-23-17.
Leafhoppers in general are insects that we have had for many years in our row and field crops. But we likely did not pay attention to them or notice them until this past year due to our heightened awareness of their existence thanks to the corn leafhopper and corn stunt disease. Below is guidance on how to distinguish between the corn leafhopper and aster leafhopper. Remember, if the corn leafhopper is detected in the state, OSU Extension will notify growers, consultants, and industry partners through Pest e-Alerts and our social media channels.
Aster Leafhopper Overview
The aster leafhopper (aka six spotted leafhopper), Macrosteles quadrilineatus, is native to North America and can be found in every U.S. state, as well as Canada. This polyphagous insect feeds on over 300 host plant species including weeds, vegetables, and cereals. Like many other leafhoppers, the aster leafhopper can be a vector of pathogens that cause disease, but corn stunt is not one of them. Instead, aster leafhoppers cause problems in traditional vegetable growing operations, as well as floral production. There is currently no concern for this insect being a vector of disease in row or field crops, including corn. Check out the OSU Pest a-Alert EPP-23-1to learn more about this insect and aster yellows disease.
Aster Leafhopper versus Corn Leafhopper
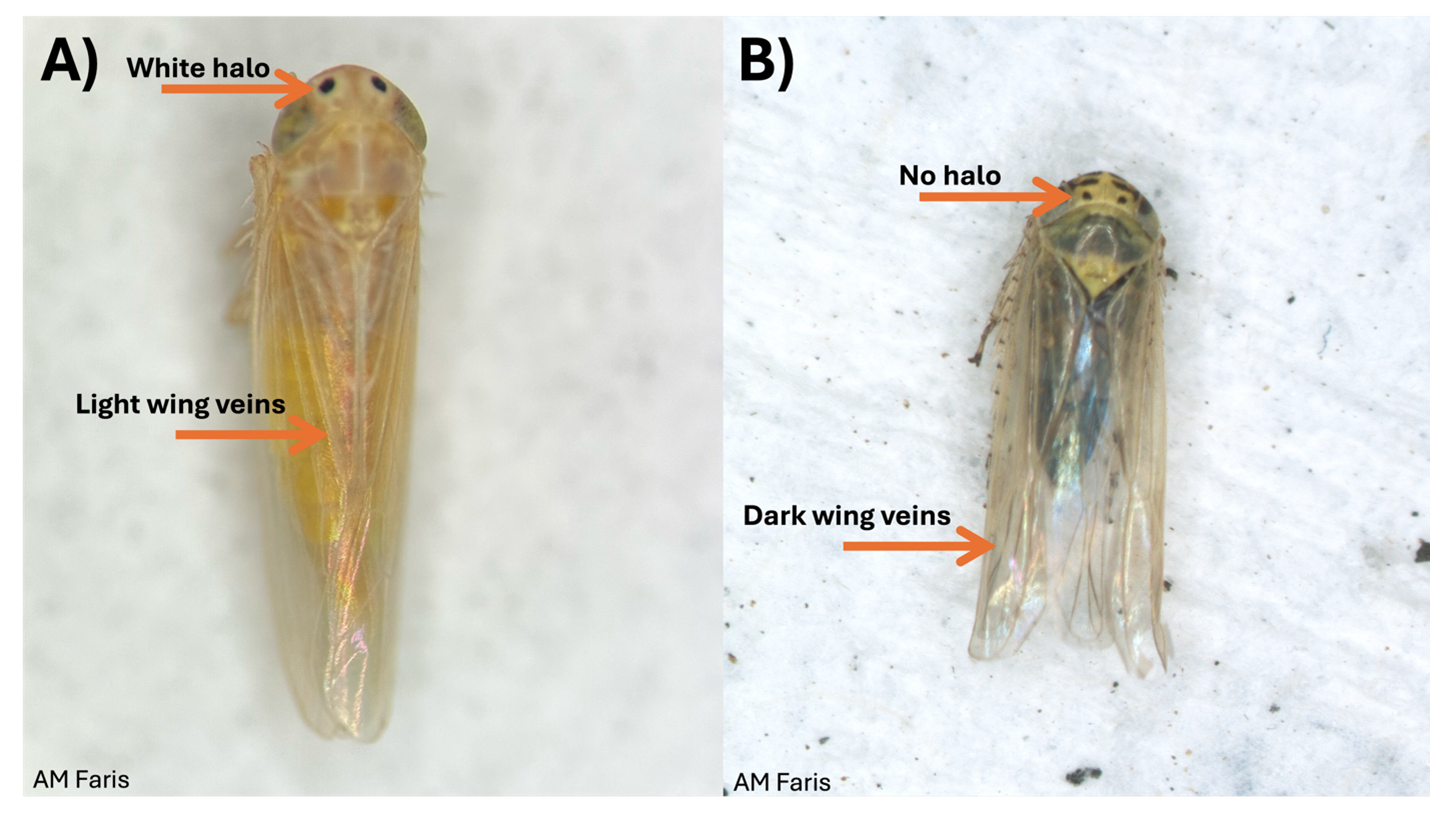
The corn leafhopper (Photo 1A) and the aster leafhopper, as well as many other leafhopper species have two black dots located between the eyes of the insect (Photo 1). Aster leafhopper adults are 0.125 inches (3 mm) long, with transparent wings that bear strong veins, and darkly colored abdomens (Photo 1B). Their dark abdomen can cause the aster leafhopper to appear grey when you see them in the field. Their long wings can also make the insect appear to have a similar appearance to the corn leafhopper (Dalbulus maidis) (Photo 1).
Characteristics that differentiate the corn leafhopper from the aster leafhopper are as follows. When viewed from above (dorsally): 1) the corn leafhopper’s dots between the eyes have a white halo around them and the aster leafhopper’s dots between eyes lack the white halo and 2) the corn leafhopper has lighter/finer wing veination than the aster leafhopper (Photo 1). When when viewed from their underside (ventrally) 3) the corn leafhopper lacks markings on their face whereas the aster leafhopper has lines/spot on the face and 4) the abdomen of the corn leafhopper lacks the dark coloration of the aster leafhopper (Photo 2).

Confirming Corn Leafhopper Identification
It is important to note that many insects will have their cuticle darken as they age. This, along with there being light and dark morphs of many insects can lend to additional confusion when distinguishing one species from another. If you believe that you have a corn leafhopper then you need to collect the insect and send it to a trained entomologist that can verify the identity of the insect under the microscope. Leafhoppers in general are fast moving insects but they can be collected in an insect net or using a handheld vacuum (see EPP-25-3). You can submit samples to the OSU Plant Disease and Insect Diagnostic Lab.
Please feel free to reach out to OSU Cropping Systems Extension Entomologist Dr. Ashleigh Faris with any questions or concerns. @ ashleigh.faris@okstate.edu

Utilizing N fixing biologicals.
In the past couple years significant efforts have been made to produce N fixing microorganisms that can be utilized in an agriculture system. The atmosphere is 78% N2 and prokaryotic microorganisms such as the bacteria species Azotobacter, Bacillus, Clostridium, and Klebsiella take that N2 gas and turn it into plant available NH4. These organisms have been around providing nitrogen for plants, for as long as there has been plants. In agriculture we have heavily utilized their relationship with legumes however have struggled bringing them into other realms of production. Naturally they tend to be found in areas that are very low levels of nitrogen. For example, prokaryotes were found in the un-fertilized check of the 130-year-old Magruder Plots but are not found any other treatment that receives fertilizer organic or commercial.

Now there are several products marketed as containing N fixing microorganisms suited for use in today’s corn, sorghum, and wheat production. While I have an active research program evaluating the use of such materials in Oklahoma, this blog will not address what works or how well. This blog will touch upon my thoughts on how to utilize a technology such as this if you pull the trigger to implement.
So there is one key to getting a ROI on products that create plant available nitrogen, and it’s a really simple key.
Under Apply Nitrogen
If you apply enough or more N than the crops needs, then there is ZERO value in a product that creates more N. For example, applying one of these products in your 250-bushel yield goal corn after you’ve already laid down 300 lbs of N preplant. Unless you lose it all to leaching, your probability of seeing a ROI on your biological investment is pretty poor. I have a hard time understanding the thought process behind paying for a N fixing product and not lowering your fertilizer rate. I can see one of two reasons. 1) You believe you historically under apply N and are losing yield because of such 2) Are in an environment which has a high potential of late season N losses, and you are unable to make recovery applications.
So what to do if using a N Fixer? I do not have the confidence yet to say, “Apply X product, it will produce Y lbs of N, so cut your rate by Y lbs”. That uncertainty is one of the greatest challenges, not knowing will I get 10 lbs or 40 lbs? If I did, then I would just subtract that off my planned rate. Side note, as someone who has been doing on farm N rate studies for a decade plus, I would have to add that most were likely over applying by that much and could cut back anyways. For me the use of the N Fixers should force your hand into utilizing in-season N applications, regardless the crop. So that you can better predict or determine impact of the product.
This is where the use of a refence strip (N-Rich or Zero N) is the golden ticket. We need a way to quickly evaluate the amount of N the crop has access to. The N-Rich method works best when preplant N is drawn way back. I would add that reduced pre-plant is a great scenario for N Fixers. The N-Rich in comparison to the rest of the field will provide you guidance towards your in-season goals. If the N-Fixers are doing a great job the N-Rich will not be showing up any time soon and you can make your N rate adjustments accordingly. If you are a Pre-plant or die kind of farmer, then I say you need to pull back the reins on the preplant rate but give the N Fixers some room to add value and add in your Zero N strips. These will again let you observe what is happening in the soil apart from your fertilizer. If it is getting on the late side of in-season N and you cannot find your zero, might be a good time to walk away and hang up the fertilizer applicator keys. I have lots of blogs and pubs on the use of reference strip so send me a note if you want to dive further into these approaches.
Feel free to reach out with questions or comments. B.arnall@okstate.edu
Related Blogs
Pre-plant Irrigation
Sumit Sharma, Irrigation Management Extension Specialist.
Jason Warren, Soil and Water Conservation Extension Specialist.
Pre plant-irrigation is a common practice in Western Oklahoma to recharge soil profile before growing season starts. Pre-plant irrigation is useful when the irrigation capacity is not enough to meet peak ET demand. It can also be important to germinate and provide for optimum emergence of the crop. As such, pre-plant irrigation is not useful when the soil profile is already wet, or soil profile is not deep enough to store moisture, or if planting dates are flexible and can wait until rains can recharge soil profile. Pre-plant irrigation becomes an important consideration if the previous crop had extensive rooting systems, which depleted moisture from deep in the profile. The crops in western Oklahoma especially in the Oklahoma Panhandle depend on stored water in the profile to meet ET demand during peak growth period, especially when well capacities are limited. Deep profiles and excellent water holding capacities of soil found in the region make the storage of a considerable amount of moisture possible. While pre-plant irrigation to recharge the whole profile (which can be 6 feet deep) may not be possible or advised, producers can still use certain tools to assess the stored water in the profile and make decisions on pre-plant irrigation.
A soil push probe (Figure 1) can provide a crude estimate of the moisture in a soil profile. For example, if an average person can push the probe to 2 feet, this means that the first 2 feet of the profile has moisture stored in it. The profile beyond 2 feet is considered too dry to push the probe through. This method does not provide the amount of water stored in the profile. For accurate measurements of soil moisture, soil samples could be collected, weighed, dried and weighed again to determine the water content in the soil. An alternative is to install moisture sensors, however this is usually not practical due to potential damage during planting, although some probes that can be permanently buried are becoming available. On average a clay loam soil in western Oklahoma can hold up to 2 inches of plant available water per foot. The approximate water holding capacity of your soil can be found on the websoilsurvey. Your county extension or NRCS personnel should be able to help you navigate this website if necessary. When the water holding capacity of your soil is known, the use of a push probe can provide a preliminary estimate of soil water content. Probing should be done at multiple locations in the field on both bare and covered (with crop residue) spots. The presence of crop residue reduces evaporation and increases infiltration so the first thing you will notice is that it is generally easier to push the probe into the surface where the ground is covered by residue. If the soil water content is near full the probe will be easy to push into the soil and it may even have mud on its tip when you pull it out. In this case you can estimate that the water content to the depth of penetration is near field capacity and that the current water content is equal to the water holding capacity. For example, if you can push the probe 2 ft into a soil with a water holding capacity of 2 inches/ft then we expect to have 4 inches of plant available water. In contrast if it takes some effort to push the rod 2 ft the estimated water content may be reduced.

When pre-irrigation is applied it can be useful to assess the increase in the depth to which the probe can be pushed into the soil after the irrigation event. For example, if 1 inch of irrigation is applied to the soil in the example above, we may expect that after this irrigation event we can push the rode 2.5 ft. However, in some case we may be able to push the rod 3 ft. The reason being that although we could not push the rod beyond 2 ft before the irrigation event, the soil below this depth was not completely dry. Therefore, the 1 inch of water was able to move to a depth of 3 ft. This is useful information, telling us that the soil below the depth we can push the rod contains some water and that each inch we apply may drain a foot into the profile. Generally, we expect the rooting depth of most crops to be able to extract water from at least 4 ft. Although it is certainly possible to extract water from below this depth, we generally don’t want to pre water our soils to full beyond 4 ft. When we fill the profile with pre water, we are increasing success of the following crop by providing the stored moisture that can offset deficits that may occur in the growing season. However, we are reducing our opportunity to capture and utilize spring rainfall. We must consider this when applying pre-irrigation, because if it is followed by rainfall in excess of ET our irrigation efficiency is greatly reduced by the drainage or runoff that can occur.
The Easy Button for Nitrogen…….
Brian Arnall, Precision Nutrient Management Extension Specialist.
The basics for nitrogen (N) fertilizer rate determination can be described in a mechanistic approach by the Stanford Equation NFert = ( NCrop – NSoil ) / Neff. This equations states that the N fertilizer rate is equal to the amount of nitrogen taken up by the crop minus the amount of nitrogen supply by the soil, divided by the efficiency of the nitrogen fertilizer used. I outline the importance of this equation in the blog “Components of a variable rate nitrogen recommendations“.

There are nitrogen “Easy Buttons” which utilizes averages collected over diverse environments to create accurate N rate recommendations. The best example of this is the yield goal rules of thumb such as wheats 2.0 lbs N per yield goal bushel minus soil test nitrate. Yield goals are generally calculated as the average of the best 3 out of 5 years, or the 5-year average times 20%. Also, the 2.0 lbs of N is more than what is in a bushel as it also adds in an efficiency factor or a 0.5 lbs per bushel cushion. This method and others like it provide an accurate N rate with slight probability of yield loss. However, the rec is often highly imprecise. Meaning that if I apply the method to 100 fields the average will be spot on, however if I look at the performance of the recommendation on a single field, I will likely be disappointed.

When it comes to nitrogen recommendations the Easy button method will use components which help ensure that the rate prescribed will maximize yield 90-95% of the time. For example, take the data presented in Figure 2. Over fifteen years of the long-term winter wheat fertility study near Lahoma, Oklahoma the average pounds of N per bushel to reach economic optimum nitrogen rate (EONR) was 1.6, however if 2.0 of N was applied per bushel yield would have been maximized 13 out of the 15 years. While 2.0 lbs. of N per bushel would have been quite accurate for maximizing yield, it would be highly imprecise as over the 15 years optimum pounds of N per bushel ranged from 0.0 to 3.2.

The trick to improving your N rate recommendation closer to a precise and accurate system is to obtain representative site-specific values for the Stanford Equation NFert = (NCrop – NSoil) / Neff.
Looking at the 15-year long-term data above the yields range from a low of 27 to a high of 88 bushels. Of those 15 years, I personally planted multiple years, usually sometime in October, and many of those years while sowing I could have guessed a range of 55-60 bushel, which just happened to be just above the 15-year average. It was not until February and March when the yield potential really started to express itself. Why, well there is a lot of weather between Oct to March, a lot of environmental positive and negative impacts on that final grain yield. This is the best timing to go out with approaches, models, or techniques to estimate yield potential for N rate recs.
While I am a big fan of soil testing, pre-plant soil samples for N are just a snap shot in time. But the While I am a big fan of soil testing, pre-plant soil samples for N are just a snapshot in time, but the nitrogen cycle Figure 3, will roar on after the soil sample is collected. Organic matter (OM) is the central component of this cycle and drives availability of NH4 and NO3 in the system. For each 1% OM in the top 6″ of the soil there is approximately 1000 lbs of organically bound N. The amount of N going into and out of OM pool is driven by C:N ratio of residues, soil temperature and soil moisture. While we very well what the mechanisms of the cycle are and can model the reactions quite well. Our inability to predict long term weather patterns is the greatest factor limiting our ability to predict future availability of NSoil.

This is where the reader should be asking “how can we get better site specific data” and I begin the discussion on why I have been promoting the of the Sensor Based Nitrogen Rate Calculator (SBNRC) and N-Rich strip method.
Lets talk about how the approach follows Stanford’s mechanistic approach to N management. First the Yield Potential component of the SBNRC which is related to NCrop. In effect researchers have built models over the past two decades that can correlate the NDVI collected from a sensor, such as the GreenSeeker, with the crops biomass and chlorophyll content. If given the number of days the crop has been growing it is possible to use the NDVI collected from the crop as a tool to predict final grain yield. The closer the wheat gets to hollow stem, or the corn gets to tassel, the better the prediction. One reason is that we have allowed more “environmental influence” to happen. Dr. Bill Raun, a founder of the SBNRC concept kept great discussion and data sets on his NUE.OKSTATE.edu website. On the “NUE Website on YP” he provides information on how yield prediction work while on the “NUE Website YP Library” he has not listed every algorithm created, and the math behind them, but also a recipe book for how anyone can create their own algorithm. While there are a lot post sensing stresses that can bring down final grain yield, the models that have been built and continually improved, do quite a good job on predicting final grain yield in-season. Resulting a much more site specific value for NCrop. The blog”Sensing the N-Rich Strip and Using the SBNRC” goes into a further discussion of using the online SBNRC.
That now leaves NSoil, which I will argue is at least as important as NCrop. As weather so greatly influences the nitrogen cycle it would be nice to have a weather station on every field paired with a 0-4 ft soil description which could be incorporated into a model. Given those might be out of reach we have found the the use of a reference strip, high N or low N, really provides an site specific estimate the of nitrogen the crop has access to. If the high N reference (N-Rich) strip is showing up that means the remainder of the field is N deficient. This may be due to losses or lack of mineralization, either way more N is needed. If the N-Rich strip is not evident then the crop is finding enough N outside of the reference strip to support its current growth. This could be that residual N or mineralization is high, or it could mean that crop growth and therefore N demand is low. Having the N check strip in each field allows for a season long evaluation. We can use NDVI to characterize how big or little of a response we have to N. We call this the Response Index (RI). An RI of 1.8 means that we could increase yield by 80% if we add adequate N, if the RI is 1.05 then we are looking at a potential increase of 5%. I have a previous blog which goes into the application of the reference strip. “Nitrogen Rich Strips, a Reminder“
Finally we combine the two, YP and RI. By predicting the yield of the area out side the N-Rich strip we can determine environmental yield potential, YP0. Basically what can the field yield if nothing is added. We multiple YP0 by the RI to get the yield potential with added N, YPN. Then its as simple as N rate = (YPN – YP0 ) x N needed per bushel. So for example if YP0 is 40 bushel RI =2, then YPN is 80 bushel. I need to fertilize the additional 40 bushels of wheat and I can use the 2.0 N per bushel can come up with a top-dress rate of 80 lbs N per acre. We are now incorporating site specific in-season NCrop and NSoil data.
And just a reminder for those of you new to my blog, I have a lot of research documenting that it is not only OK, but often best if we wait on N application in wheat and other crops. Value of In-Season N blog.
Every step we take towards the easy button is often a step towards site specific imprecision due to the use of generalized terms or models. Depending on your goals this very well could be acceptable for your operation, but with nitrogen prices as volatile as they are, should we not be considering pushing the easy button to the side, for now. Let’s add a bit of site-specific data so that we can take advantage of the N the system may be giving us, or the yield we did not expect. Let the N-Rich Strip be that first step.
Relevant Peer Review Publications.
If you have any questions please feel free to contact me @ b.arnall@okstate.edu
Recent Weather Causing Corn (and Sorghum) Injury From Pre-emerge Herbicides
With the brief window of dry ground last week my crew went at full speed planting and applying pre-emergence. Today I am sitting at home with campus closed due to the potential to severe weather with a forecast of 4-6 inches of rain for the areas I planted. Combine the recent planting activities and limited windows for pre-emergence applications, I will not be surprised if we don’t start seeing injury in some of the sorghum that was just planted before the rains. I would also add the over the years I often see bleaching in sorghum, that looks similar to zinc and/or iron deficiency, caused by atrazine injury. This typically occurs when atrazine is applied prior to a heavy rain. The atrazine is washed down slope and into the rows, the injury is almost always seen in low lying areas. The crop usually grows out of it.

Atrazine injury in sorghum. Heavy rains followed application. Pic via Rick Kochenower.
Brian A.
This article is written by Mr. Cody Daft, Field Agronomist Western Business Unit, Pioneer Hi-Bred
Have you noticed any corn leafing out underground prior to emergence? Have you seen tightly rolled leaves or plants that can’t seem to unfurl leaves and look buggy whipped? Almost all of the fields I have looked at recently have shown these symptoms in at least a portion of the field, and some fields this has been very widespread. The common denominator in all the fields I have viewed has been the herbicides applied were a metolachlor (Dual/Cinch type products) and the weather (cooler than normal, wetter than normal). Similar issues can be noted in grain sorghum to some extent.
The recent wet weather and water-logged soils have increased the possibility of corn injury from many popular soil applied herbicides. Corn growing in wet soils is not able to metabolize (degrade) herbicides as rapidly as corn growing in drier conditions. Plant absorption of herbicides occurs by diffusion. What this means is that the herbicide diffuses from locations of high concentration (application site on the soil) to low concentration (plant roots). The diffusion process continues regardless of how rapidly the corn is growing. In corn that is not growing rapidly (cool, wet conditions) corn plants can take up doses of herbicide high enough to show damage and a few differences in symptomology.
The unfortunate aspect of wet soil conditions is that additional stress is put on the plant not only to metabolize herbicide residues, but also to ward off diseases and insects. These additional stresses can impact a corn plant’s ability to metabolize herbicide.
The most common type of herbicide injury observed under these conditions is associated with chloroacetamide herbicides. These herbicides are used for control of grass and small seeded broadleaf weeds, and are seedling root and shoot inhibitors.
These products include the soil-applied grass herbicides such as:
- Dual/Cinch/Medal II
- Degree/Harness
- Microtech/Lasso
- Frontier/Outlook
- Define/Axiom
- And other atrazine premixes like Lumax (a premix of mesotrione (Callisto), s-metolachlor (Dual II Magnum), atrazine and a safener benoxacor).
What About The Injury Symptoms?
Before corn emergence:
- Stunting of shoots that result in abnormal seedlings that do not emerge from soil.
- Corkscrewing symptoms similar to cold/chilling injury.
- Corn plants and grassy weeds may leaf out underground and leaves may not properly unfurl.
After corn emergence:
- Buggy whipping – leaves may not unfurl properly.

Figure . Buggy-whipping symptom from carryover of PPO herbicides to corn.via https://www.pioneer.com/home/site/us/agronomy/library/herbicide-carryover/
What About Safeners?
Products like DUAL II Magnum herbicide contain the safener benoxacor which has been shown to enhance S- Metolachlor metabolism in corn. This enhanced metabolism can reduce the potential of S- Metolachlor injury to corn seedlings when grown under unfavorable weather conditions such as cool temperature or water stress. However, a safener is not the silver bullet, and slow plant growth may still have trouble metabolizing the herbicide even with a safener…but it does help the severity of damage/symptoms.
Will The Plants Recover?
Plants that have leafed out underground or show corkscrewed mesocotyl symptoms are likely to not recover or even emerge from below the soil. Larger plants that are already emerged that show tightly rolled leaves and are buggy whipped will most likely recover once the field sees drier conditions and we have warm weather and sun light to assist in better plant growth.
More Information Discussing Corn Injury From Pre-emerge Herbicides Here:
Cody Daft
Pioneer Hi-Bred
cody.daft@pioneer.com
Poly versus Ortho another year of data from Iowa
Guest Author, Dr. Jake Vossenkemper; OkState Grad and Agronomy Lead, Liquid Grow Fertilizer
Updated Research Comparing Ortho/Poly-Phosphate Ratios for In-Furrow Seed Safe Starter Fertilizers. Last years post Link
Article Summary
- Ortho-phosphates are 100% plant available, but a high percentage of poly-phosphates in starter fertilizers convert to ortho-phosphate within just two days of application.
- This quick conversion from poly- to ortho-phosphate suggests expensive “high” ortho starter fertilizers are not likely to result in increased corn yields compared to seed-safe fluid starters containing a higher percentage of poly-phosphate.
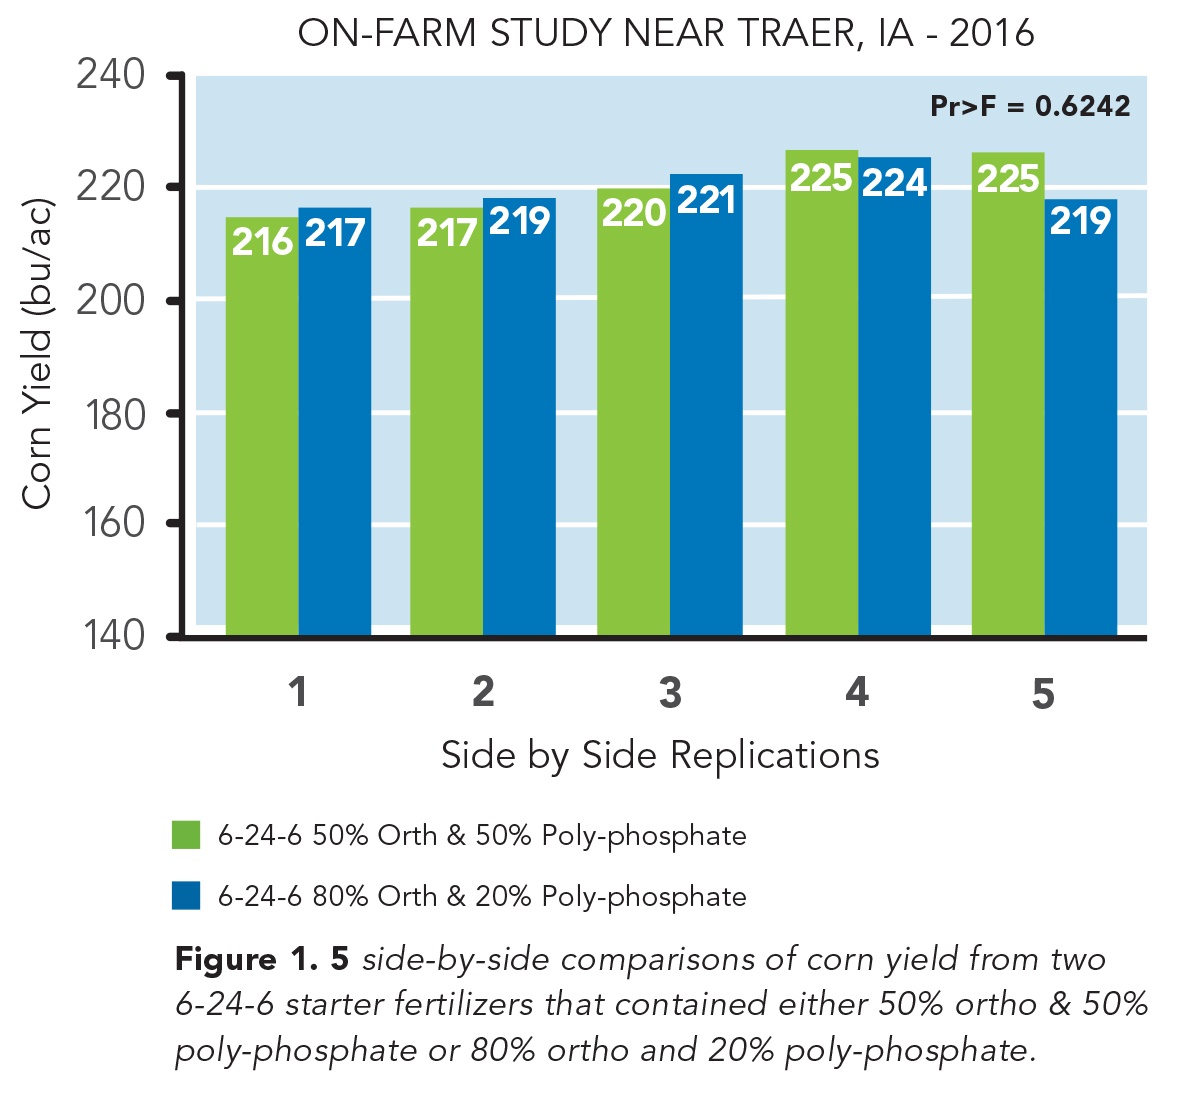
- On-farm field studies conducted near Traer, IA in the 2016 and 2017 growing season found no statistical difference (Pr > 0.05) in corn yield between conventional and high ortho-phosphate starters in either year.
- High ortho starters cost more per acer than 50/50 ortho:poly starters, but do not increase corn grain yields.
Polyphosphates Rapidly Convert to Plant available Orthophosphates
Given polyphosphates are not immediately plant available and orthophosphates are immediately plant available, this gives the promoters of “high” orthophosphate starters ample opportunity to muddy the waters. Nevertheless, the facts are, polyphosphates are rather rapidly hydrolyzed (converted to) into orthophosphates once applied to soils, and this hydrolysis process generally takes just 48 hours or so to complete.
In September of 2015, we posted a blog discussing some of the more technical reasons why the ratio of ortho to polyphosphates in starter fertilizers should have no impact on corn yields. For those that are interested in the more technical details, we encourage you to follow this link to the September 2015 blog post.
While we was relatively certain that the ratio of ortho to polyphosphates in liquid starters should have no effect on corn yields, we decided to “test” this idea with on-farm field trials located near Traer, IA in the 2016 and 2017 growing seasons.
How the Field Trial Was Conducted
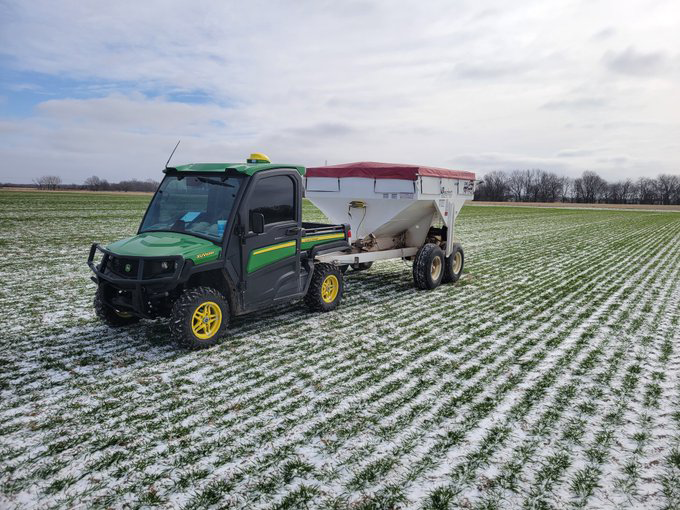
In these field trials, we used two starters applied in-furrow at 6 gal/ac. Each starter had an NPK nutrient analysis of 6-24-6. The only difference between these two starters was the ratio of ortho to polyphosphates. One of these starters contained 80% orthophosphate and the other contained just 50% orthophosphate. With the remainder of the phosphorus source in each of these two starters being polyphosphate. Each plot was planted with a 24-row planter (Picture 1) and was nearly 2400 ft long. In both the 2016 and 2017 growing seasons the experimental design used was a randomized complete block with 4 or 5 replications.

Field Trial Results
Averaged over the side-by-side replications there was less than 1 bu/ac difference in corn grain yield between the high ortho and low ortho polyphosphate starters in both the 2016 and 2017 growing seasons. In addition to finding no differences in grain yield between these two starters, the high ortho starters generally cost about $1 more per/gal (so the $6/ac difference in price at a 6 gal/ac rate) than the low ortho starters. So the more expensive high ortho starter clearly did not “pay” its way in our multi-year field trials.
More Trials Planned for 2018
While our findings agree with other research-comparing ortho and polyphosphate starter fertilizers (Frazen and Gerwing. 1997), we want to be absolutely certain that our fertilizer offerings are the most economically viable products on the market. Therefore, we have decided to run this same field trial at one location in northern, IL in 2018, and at one location in central, IA in 2018. Stay tuned for those research results next fall.
References
Franzen D. and J. Gerwing. 2007. Effectiveness of using low rates of plant nutrients. North Central regional research publication No. 341. http://www.extension.umn.edu/agriculture/nutrient-management/fertilizer-management/docs/Feb-97-1.pdf (accessed 8 of Sept 2015).
A big Thank You to Dr. Vossenkemper for sharing this article with us.
The original article and his contact can be found at Link
Time to re-post an old post. Sorghum injuries from Pre-Emerge Herbicides
Based on a few recent text messages and emails I think it is time to revisit an older post about Corn and Sorghum injuries from pre-plant herbicides.
Direct link to the original post Recent Weather Causing Corn (and Sorghum) Injury From Pre-emerge Herbicides
Sorghum with likely atrazine injury. Image courtesy Jana Slaughter
