Home » Posts tagged 'sustainability'
Tag Archives: sustainability

The Mechanics of Soil Fertility: Use of Sugar in Field Crops
Jolee Derrick, Precision Nutrient Management Ph. D. Student
Grace Williams, Soil Microbiology Ph. D. Candidate
Brian Arnall, Precision Nutrient Management Specialist
Recently, there has been increased interest in adding sugar to spray tank mixes, whether for post-emergence weed control or foliar nutrient applications. While there is limited work on impact of sugar inclusion in herbicide applications, some papers have posed potential enhancement (Devine and Hall, 1990). But since this is coming from a soil science group, we will only focus on soil impact. Following up the last blog, unlike humic substances, which represent more complex and relatively stable carbon forms, sugar is a highly labile carbon source. This rapid utilization of simple carbon sources is well documented to stimulate microbial activity and growth (Kuzyakov and Blagodatskaya, 2015). The general idea of utilizing sugar applications is that sugar has the capacity to improve spray performance, stimulate biological activity, increase organic matter mineralization, and ultimately result in improved yields.
Sugar additions can influence soil processes differently depending on system conditions. In systems with higher residual nitrogen and organic matter, responses may differ from those observed in Oklahoma production environments, where soils are typically lower in organic matter and microbial activity can occur for much of the year. Understanding how sugar functions in these systems requires a basic discussion of carbon dynamics. Sugar itself is almost entirely carbon and is readily consumed by microbes. It’s a simple molecule, which allows it to dissolve easily in water and be quickly utilized in the soil system. Crop residues, like wheat straw, are also carbon-rich but much more complex. They contain cellulose, hemicellulose, and lignin which are long carbon chains that take time to break down because microbes need specialized enzymes to access them.
For the sake of simplicity, we can group carbon into two key pools: labile carbon and particulate organic matter (POM). Labile carbon includes easily decomposed materials, which include the previously mentioned simple sugars that microbes can metabolize rapidly. These pools differ in turnover time and microbial accessibility, with labile carbon driving short-term microbial responses (Cotrufo et al. 2013). POM breaks down more slowly and serves as a longer-term nitrogen source through residue breakdown.
Soil microorganisms require both carbon and nitrogen to grow and maintain biomass, typically at a ratio of approximately 24 parts carbon to 1 part nitrogen. When readily available carbon is abundant, but nitrogen is limited, microbes increase their nitrogen demand and begin scavenging nitrogen from the surrounding soil. This process, better known as nitrogen immobilization, temporarily reduces nitrogen availability to crops. Additions of readily available carbon sources have consistently been shown to increase microbial nitrogen immobilization in soil systems (Recous et al. 1990).
In systems where sufficient nitrogen is present, microbial populations can expand rapidly. Fast-growing microbial species may dominate, continuing to immobilize nitrogen within their biomass. Eventually, when nitrogen becomes limiting, microbial populations decline to levels the system can support. This boom-and-bust cycle can disrupt nitrogen availability during critical stages of crop growth. These rapid shifts in microbial population and activity following carbon inputs are commonly observed in soil systems receiving easily decomposable substrates (Blagodatskaya and Kuzyakov, 2008).
This dynamic becomes especially relevant when considering residue management practices common in Oklahoma. Under no-till or limited-tillage systems, the crop residues have wide carbon-to-nitrogen (C:N) ratios, creating conditions where nitrogen immobilization can occur during the growing season.
Table 1 provides approximate C:N ratios for several crops commonly grown in Oklahoma. When additional carbon is introduced into these systems without accompanying nitrogen, the likelihood of microbial immobilization increases. While immobilization is not bad, it does create a question mark as Oklahoma’s variable climate means the following release of nutrients will be unpredictable.
Table 1. Table depicting the range of C:N ratios for residues of commonly utilized crops in Oklahoma. Ratios were obtained from Brady, N. C., & Weil, R. R. (2017). The Nature and Properties of Soils (15th ed.)

Now consider conventional tillage systems. In Oklahoma, no-till systems typically contain 2 to 3 percent organic matter, which is relatively high given our climate and extended periods of microbial activity. Conventional tillage systems often fall between 0.75 and 2.25 percent organic matter. Because soil organic matter is approximately 58 percent carbon, this represents a substantial difference in the soil carbon pool.
Tillage can temporarily enhance microbial access to both previously mentioned carbon pools. When tillage exposes previously protected carbon, microbial activity increases rapidly. This initial flush can temporarily increase nitrogen mineralization as organic nitrogen is converted to plant-available forms. However, this phase is short-lived. As microbial populations expand, nitrogen demand increases, leading to immobilization and reduced nitrogen availability.
Hypothetically, increased microbial growth and activity would rapidly mineralize organic matter, trigger a surge in NO₃⁻, deplete soil organic matter, and as resources become limiting and the environment can no longer sustain elevated microbial populations, this boom would be followed by a population crash. This relationship is ultimately driven by the soil C:N ratio, which introduces an interesting additional complexity of residue. Different residues bring very different carbon-to-nitrogen balances into the system, and microbes respond accordingly. High carbon residues give microbes plenty of energy but very little nitrogen, so they pull N out of the soil to meet their needs. Residues with lower C:N ratios (soybean, alfalfa, etc.) do opposite, releasing nitrogen as they break down. Now the real question becomes where the critical point sits, and when does management push the system from the threshold of immobilization and mineralization.
These hypotheses form the foundation for new research currently underway through the Precision Nutrient Management Program. Initial proof-of-concept work has already been completed, providing a necessary steppingstone to address these questions.
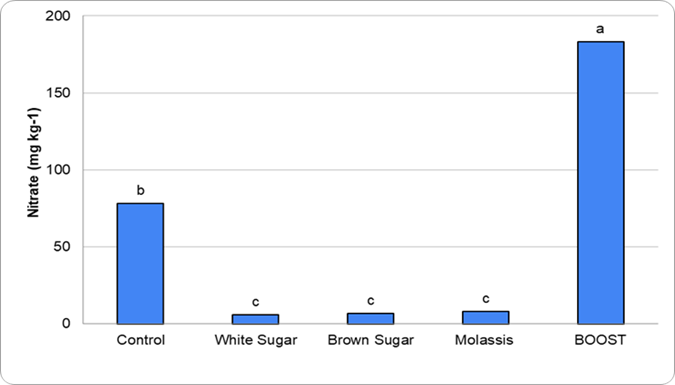
Figure 1. Graph depicting the different concentrations of nitrate leached corresponding to applied treatments in the proof-of-concept work
The preliminary work (Figure 1) evaluated different sugar sources applied alongside a high-nitrogen product to assess the extent of nitrogen immobilization. Although these studies were conducted using potting soils, clear trends were apparent. Treatments containing sugar consistently showed greater nitrogen immobilization compared to treatments without sugar. This response is consistent with studies showing that additions of simple carbon substrates stimulate microbial growth and increase nitrogen immobilization (Dendooven et al. 2006). Building on this work, an active field-based research project is underway to evaluate how sugar additions influence nitrogen availability and microbial dynamics under real-world Oklahoma production conditions.
From an agronomic standpoint, sugar functions primarily as a readily available carbon source that stimulates microbial growth. In nitrogen-limited systems, this response increases the likelihood that nitrogen will be incorporated into microbial biomass rather than remaining immediately available for crop uptake.
Finally, we conclude with a conceptual consideration. If increased OM mineralization leads to greater plant biomass, this process may partially offset losses of OM. Greater biomass production could return more residues to the soil, contributing to the OM pool in the upper soil profile. Therefore, the system may compensate for OM mineralization through the rebuilding of organic matter via plant inputs. However, the stabilization of this carbon depends on microbial processing and physical protection within the soil matrix (Cotrufo et al. 2015)
However, while the underlying logic is sound, this concept has not been extensively studied within Oklahoma cropping systems. This blog does not address the impact of sugar applications on residue breakdown, and the potential impact of such. Future research through the Precision Nutrient Management Program will further investigate the mineralization process to better understand carbon dynamics within these systems.
Take Home:
- Oklahoma production systems generally have lower residual N and high carbon residues, creating conditions conducive to N immobilization
- Adding sugar increases microbial growth, creating population booms that will momentarily increase mineralization, but then immediately immobilize residual nitrogen.
- Tillage can amplify the negative effects of sugar by exposing more carbon and reducing soil organic matter
- Proof-of-concept work shows sugar triggered a net nitrogen immobilization in a carbon heavy environment
- Proof-of-concept work also suggests that when additional nitrogen is present, sugar additions may shift the system toward net mineralization rather than immobilization.
Work Cited:
Blagodatskaya, E., & Kuzyakov, Y. (2008). Mechanisms of real and apparent priming effects. Biology and Fertility of Soils, 45, 115–131.
Brady, N. C., and R. R. Weil. “The Nature and Properties of Soils, 15th Edn (eBook).” (2017).
Cotrufo, M. F., Wallenstein, M. D., Boot, C. M., Denef, K., & Paul, E. (2013). The Microbial Efficiency-Matrix Stabilization (MEMS) framework. Global Change Biology, 19, 988–995.
Cotrufo, M. F., Soong, J. L., Horton, A. J., Campbell, E. E., Haddix, M. L., Wall, D. H., & Parton, W. J. (2015). Formation of soil organic matter via biochemical and physical pathways of litter mass loss. Nature Geoscience, 8(10), 776–779.
Dendooven, L., Verhulst, N., Luna-Guido, M., & Ceballos-Ramírez, J. M. (2006). Dynamics of inorganic nitrogen in nitrate- and glucose-amended alkaline–saline soil. Plant and Soil, 283(1–2), 321–333.
Devine, M. D., & Hall, L. M. (1990). Implications of sucrose transport mechanisms for the translocation of herbicides. Weed Science, 38(3), 299–304.
Kuzyakov, Y., & Blagodatskaya, E. (2015). Microbial hotspots and hot moments in soil: Concept & review. Soil Biology and Biochemistry, 83, 184–199.
Recous, S., Mary, B., & Faurie, G. (1990). Microbial immobilization of ammonium and nitrate in cultivated soils. Soil Biology and Biochemistry, 22, 913–922.
Mechanics of Soil Fertility: Understanding Humic and Fulvic Acids
Brian Arnall, Oklahoma State University, Precision Nutrient Management Extension Specialist
Oliver Li, Oklahoma State University, Soil Chemistry
Interest in humic and fulvic acid products has increased substantially in agricultural production systems during the past two decades. These materials are frequently promoted as tools for improving soil biology, increasing nutrient availability, enhancing fertilizer efficiency, and stimulating plant growth. Because humic substances are known to be important components of soil organic matter, it is reasonable to ask whether adding humic or fulvic products to soil can meaningfully influence soil fertility.
As with many soil fertility questions, the answer depends on understanding two key factors: the mechanism involved and the magnitude of that mechanism relative to the soil system. Soil processes operate within large natural pools of organic matter, nutrients, and microbial activity. Therefore, evaluating the potential effects of humic products requires examining both how these compounds function chemically and biologically and how their application rates compare with the soils organic matter.
What Are Humic and Fulvic Acids?
Humic substances are heterogeneous organic compounds formed during the decomposition and transformation of plant and microbial residues. Historically, soil scientists have divided these materials into three operational fractions based on their solubility behavior: humic acid, fulvic acid, and humin (Stevenson, 1994; Tan, 2014). Humic acids are relatively large molecules that are insoluble under acidic conditions but dissolve in alkaline solutions. Fulvic acids are smaller molecules that remain soluble across the entire pH range, which allows them to move more freely in soil solution.
Both humic and fulvic acids contain numerous functional groups, particularly carboxyl and phenolic groups, which carry negative charge. These functional groups allow humic substances to interact with metal ions and nutrient cations and contribute to several important soil properties, including cation exchange capacity, buffering capacity, and metal complexation (Stevenson, 1994; Lehmann and Kleber, 2015). Because these materials originate from decomposed organic residues, they represent one portion of the complex mixture that collectively makes up soil organic matter. The distribution of the soil organic matter fractions varies among soil types and land uses, but fulvic acids and humic acids are each typically estimated to comprise approximately 10–35% of total soil organic matter (Guimarães et al., 2013).
Nutrient Retention and the Role of Cation Exchange
One of the most commonly cited mechanisms associated with humic substances is their ability to retain nutrients through cation exchange. The negatively charged functional groups present on humic molecules attract positively charged ions in soil solution. Through this electrostatic attraction, humic materials can retain several plant nutrients, including ammonium, potassium, calcium, magnesium, and certain micronutrients such as zinc and copper (Stevenson, 1994; Tan, 2014). This mechanism functions in the same manner as cation exchange on clay minerals. Of course, negatively charged surfaces do not retain negatively charged ions. As a result, nutrients such as nitrate are not held by humic substances and remain mobile in soil solution.
Laboratory measurements indicate that humic materials may possess relatively high cation exchange capacity on a mass basis. Reported values commonly range from approximately 300 to 600 cmolc kg⁻¹ depending on the source material and extraction method (Stevenson, 1994; Tan, 2014). These values demonstrate that humic substances can retain a large amount of cationic nutrients. A question that can be posed, however, is how this capacity compares with the nutrient retention already provided by soil organic matter.
Understanding the magnitude of humic additions requires comparing product application rates with the organic matter already present in soil. Calculations based on typical cation exchange values suggest that one pound of humic material with a CEC of 300–600 cmolc kg⁻¹ could theoretically retain approximately 0.04 to 0.08 pounds of ammonium-nitrogen. When viewed in isolation this number may appear meaningful. However, agricultural soils already contain large quantities of organic matter. An acre furrow slice, representing approximately the upper six inches of soil, weighs roughly two million pounds. Soil containing one percent organic matter therefore contains about 20,000 pounds of organic material per acre (Brady and Weil, 2016). Humified organic matter typically has cation exchange capacities ranging between 150 and 300 cmolc kg⁻¹ (Stevenson, 1994), meaning that the exchange capacity associated with native soil organic matter is already substantial. To put this into perspective, one pound of humic material can retain roughly 0.04 to 0.08 pounds of cation charge. Ammonium and potassium carry a single positive charge, while calcium carries two, meaning two ammoniums can be held for every two calcium. To provide contrast to the application of a humic substance, increasing soil organic matter by just 0.1% equivalent to about 2,000 pounds of additional organic material per acre can provide the capacity to retain approximately 40 to 80 pounds of cation charge or 40 to 80 pounds of ammonium.
The key point is not that humic materials cannot retain nutrients. They clearly can. Rather, the scale of material already present in soil is extremely large compared with the few ounces or pounds of humic products typically applied in agricultural systems. Consequently, the nutrient retention capacity associated with soil organic matter overwhelmingly dominates the soil system.
Micronutrient Complexation
Humic and fulvic substances are also known to interact with micronutrients through metal complexation reactions (also known as ‘chelation’). Carboxyl and phenolic functional groups can coordinate with metal ions such as iron, zinc, copper, and manganese to form organic complexes (Stevenson, 1994; Tan, 2014). These complexes can influence micronutrient mobility and availability in soils.
Fulvic acids are particularly effective at forming soluble complexes because they remain dissolved across the full range of soil pH. In some cases, these complexes may increase micronutrient mobility and transport within the soil solution. This mechanism has been well documented in soil chemistry research and may explain some responses observed in systems where micronutrient availability is limited.
Effects on Plant Physiology
In addition to soil chemical interactions, humic substances may influence plant growth through physiological mechanisms occurring in the rhizosphere. Several studies have shown that humic substances can stimulate root development, including increases in root elongation, lateral root formation, and root hair production (Nardi et al., 2002; Canellas and Olivares, 2014).
Research suggests that these responses may involve interactions with plant hormonal pathways and membrane transport processes. Humic substances have been shown to activate plasma membrane H⁺-ATPase enzymes, which are involved in proton pumping and nutrient uptake across root membranes (Canellas et al., 2002; Trevisan et al., 2010). Activation of these transport systems can enhance nutrient absorption and influence root architecture.
These physiological effects appear to occur primarily at the root–soil interface, where dissolved organic molecules interact directly with plant tissues. As a result, the responses observed in plant growth experiments are often attributed to rhizosphere signaling processes rather than large changes in bulk soil fertility.
Microbial Responses to Humic and Fulvic Compounds
Soil microorganisms respond strongly to carbon availability, and different carbon sources can produce very different microbial responses. Simple carbohydrates such as glucose and sucrose are readily metabolized by soil microbes and therefore produce rapid increases in microbial respiration and biomass. Humic substances, in contrast, consist of chemically complex and partially oxidized organic compounds that decompose much more slowly (Lehmann and Kleber, 2015).
Experimental studies comparing carbon sources consistently show that microbial respiration increases dramatically when simple sugars are added to soil, whereas humic substances produce smaller responses (Blagodatskaya and Kuzyakov, 2008). This difference reflects the relative degradability of these compounds as microbial energy sources.
Carbon Inputs from Humic Products Compared with Natural Soil Carbon
Soil microbial activity is largely driven by carbon supplied from plants through root exudation, residue decomposition, and organic matter turnover. The carbon pools already present in soil are therefore important for understanding the potential influence of humic product additions. A soil containing one percent organic matter holds approximately 11,600 pounds of carbon per acre (Brady and Weil, 2016).
Research on plant–soil carbon cycling indicates that living roots release significant quantities of organic carbon into soil each growing season through root exudation and rhizodeposition (Kuzyakov and Domanski, 2000). These plant-derived carbon inputs commonly amount to hundreds of pounds of carbon per acre and serve as a major energy source for soil microbial communities. Viewed in this context, humic product applications represent extremely small additions to the soil carbon pool. Consequently, microbial stimulation in agricultural soils is dominated by carbon inputs from plant residues and root exudates rather than by small additions of humic materials.
Building Organic Matter in the Central Plains
Increasing soil OM in the central Great Plains is achievable, but the magnitude of change is governed primarily by carbon inputs and water availability rather than any single management practice. Systems that combine no-till, increased residue return, diversified crop rotations, and where feasible cover crops or manure inputs are the most effective because they simultaneously increase carbon inputs and reduce decomposition losses (Lyon et al., 2007; Mikha et al., 2013; Nielsen et al., 2016). In semi-arid systems, realistic rates of OM increase are modest: over a 5-year period, changes are often small, approximately +0.05 to 0.1% OM, but significant in relation to the system which is often at total OM levels between 0.7 and 1.25 prior to establishment of conservation practices. The increase is confined to the top inch of the soil surface (Mikha et al., 2013; Saha et al., 2024). Mechanistically, these gains occur through greater residue and root-derived carbon inputs, reduced soil disturbance which slows microbial oxidation, and improved aggregation that physically protects organic matter from decomposition (Six et al., 2002; Lehmann and Kleber, 2015). However, as emphasized throughout this discussion, the scale of change is small relative to the large existing organic matter pool, and meaningful increases require long-term, system-level management focused on maximizing biomass production rather than relying on small external carbon additions such as commercial products.
Take-Home Points
- Humic and fulvic acids can retain cations, chelate micronutrients, and influence plant and microbial processes.
- Typical application rates are small relative to existing soil organic matter, so whole-soil impacts are limited.
- Most observed effects are localized in the rhizosphere, not broad changes in soil fertility.
- Evaluating both mechanism and scale is key to understanding their role in nutrient management.
References
Blagodatskaya, E., & Kuzyakov, Y. (2008). Mechanisms of real and apparent priming effects and their dependence on soil microbial biomass and community structure. Biology and Fertility of Soils, 45(2), 115–131.
Brady, N. C., & Weil, R. R. (2016). The nature and properties of soils (15th ed.). Pearson.
Canellas, L. P., Olivares, F. L., Okorokova-Façanha, A. L., & Façanha, A. R. (2002). Humic acids isolated from earthworm compost enhance root elongation and lateral root emergence in maize. Plant Physiology, 130(4), 1951–1957.
Canellas, L. P., & Olivares, F. L. (2014). Physiological responses to humic substances as plant growth promoters. Chemical and Biological Technologies in Agriculture, 1, 3.
Guimarães, D. V., Gonzaga, M. I. S., Silva, T. O., Silva, T. L., Dias, N. S., & Matias, M. I. S. (2013). Soil organic matter pools and carbon fractions in soil under different land uses. Soil and Tillage Research, 126, 177–182.
Kuzyakov, Y., & Domanski, G. (2000). Carbon input by plants into the soil: Review. Journal of Plant Nutrition and Soil Science, 163(4), 421–431.
Lehmann, J., & Kleber, M. (2015). The contentious nature of soil organic matter. Nature, 528(7580), 60–68.
Lovley, D. R., Coates, J. D., Blunt-Harris, E. L., Phillips, E. J. P., & Woodward, J. C. (1996). Humic substances as electron acceptors for microbial respiration. Nature, 382, 445–448.
Lyon, D. J., Stroup, W. W., & Brown, R. E. (2007). Crop production and soil water storage in long-term winter wheat–fallow tillage experiments. Soil and Tillage Research, 94(2), 387–397.
Mikha, M. M., Vigil, M. F., Benjamin, J. G., & Sauer, T. J. (2013). Cropping system influences on soil carbon and nitrogen stocks in the Central Great Plains. Soil Science Society of America Journal, 77(2), 702–710.
Nardi, S., Pizzeghello, D., Muscolo, A., & Vianello, A. (2002). Physiological effects of humic substances on higher plants. Soil Biology and Biochemistry, 34(11), 1527–1536.
Nielsen, D. C., Lyon, D. J., Hergert, G. W., Higgins, R. K., Calderón, F. J., & Vigil, M. F. (2016). Cover crop mixtures do not use water differently than single-species plantings. Agronomy Journal, 108(3), 1025–1038.
Saha, D., Kukal, S. S., & Bawa, S. S. (2024). Long-term impacts of conservation agriculture practices on soil organic carbon and aggregation. Soil Science Society of America Journal.
Six, J., Conant, R. T., Paul, E. A., & Paustian, K. (2002). Stabilization mechanisms of soil organic matter: Implications for C saturation of soils. Plant and Soil, 241(2), 155–176.
Stevenson, F. J. (1994). Humus chemistry: Genesis, composition, reactions (2nd ed.). Wiley.
Tan, K. H. (2014). Humic matter in soil and the environment. CRC Press.
Trevisan, S., Francioso, O., Quaggiotti, S., & Nardi, S. (2010). Humic substances biological activity at the plant–soil interface. Plant Signaling & Behavior, 5(6), 635–643.
For any questions or commments please feel free to reach out to Brian Anrall, b.arnall@okstate.edu
Corn Hybrids’ Yield Response to Limited Well Capacities in the Central High Plains
Macie McPeak: M.S in Irrigation and Water Management
Sumit Sharma : Extension Specialist for High Plains Irrigation and Water Management
Background
The Central High Plains, which include the Oklahoma Panhandle, Southwest Kansas, Southeast Colorado, and Northern Texas Panhandle, is a heavily farmed semi-arid region that depends on the Ogallala Aquifer for irrigation to ensure stable crop yields. However, the continuous decline of the Ogallala Aquifer has resulted in increased need for irrigation strategies that conserve water while maintaining crop profitability. Corn remains the most water consuming crop with highest productivity per unit of irrigation applied, and strong economic returns in the Central High Plains region. However, corn is also the most sensitive to water stress among all the existing cropping systems (including sorghum, cotton, and sunflower, soybeans and wheat). Declining water table has reduced the well capacities in many areas in the region, which cannot meet crop water demand, making it a growing challenge for corn production. Therefore, there is a need for research in irrigation strategies and agronomic choices such as drought tolerant hybrids, seeding rate, planting date, and hybrid maturity for sustainable and profitable corn production with reduced well capacities in the region. This blog discusses the yield response of different corn hybrids to limited well capacities in the Oklahoma Panhandle area of the Central High Plains.
Limited well capacities only meet partial crop water demand, which in general leads to yield declines especially in high water demanding crops such as corn. Several previous studies suggest that crop productivity does not significantly decrease as long as irrigation is maintained at approximately 75–80% of full evapotranspiration (ET) replacement (Su et al., 2022; Klocke et al., 2007; Zhao et al., 2019). However, when irrigation levels are more restricted, such as under reduced well capacities, there can be substantial yield losses and diminished economic returns. The magnitude of yield reduction varies with region, hybrids, and growth stage at which water stress occurred. For example, in the Central High Plains the corn ET demand is highest in Texas Panhandle and decreases as we move north towards Nebraska. Zhao et al. (2019) found that applying 75% ET in the Texas Panhandle produced corn yields equivalent to full irrigation, whereas reducing irrigation to 50% caused significant yield reductions. Similarly, Klocke et al. (2007) reported that limited irrigation at roughly 50% of full ET replacement in Nebraska achieved 80–90% of fully irrigated yields across multiple crop rotations. Therefore, the irrigation strategies which work in one region may not work the same way in other regions with different crop water demand and must be tested for the region-specific climatic conditions.
The current study was conducted in 2025 at the Oklahoma Panhandle Research and Extension Center in Goodwell, OK. Four Pioneer brand corn hybrids including P13777 (113 day maturity), P10625 (110 day maturity), P05810 (105 day maturity), and P14346 (114 days maturity) were planted at 22,000 and 28,000 seeds per acre. The hybrids were irrigated with a center pivot fitted with variable rate irrigation system at 200, 300, 400, and 500 GPM well capacities. The well capacities were simulated by adjusting the frequency of irrigation events.
Results & Discussion
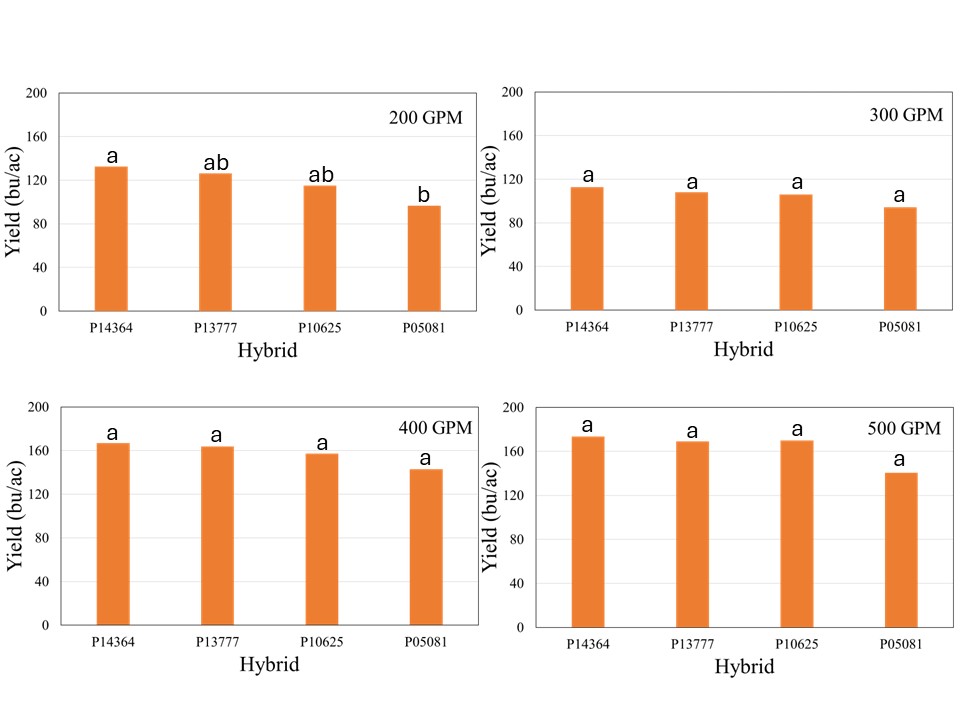
The crop received 12.1 inches of rain from planting until physiological maturity, while total rainfall from April till September was over 15 inches. Manual probing of the field showed near 4 feet soil profile at the time of planting which can hold up to 2 inches of plant available water per foot. The well capacities 200, 300, 400, and 500 GPM treatments received 7.4, 8.9, 10.8, and 12.0 inches of irrigation, respectively. The data showed no significant effect of population on corn yield across hybrids for any well capacity. However, the hybrids showed significant interaction with well capacities, which indicated that hybrid yield response varied at different capacities (Figure 1). In general, the average yield declined from longest maturity to shortest maturity hybrids irrespective of the well capacity, but was only statistically significant at for 200 GPM (Figure1). At this irrigation level, the shortest maturity hybrid P05081 yielded significantly lower yield than longest maturity hybrid P14364, while P13777 and P10625 were not different from either of these two hybrids.
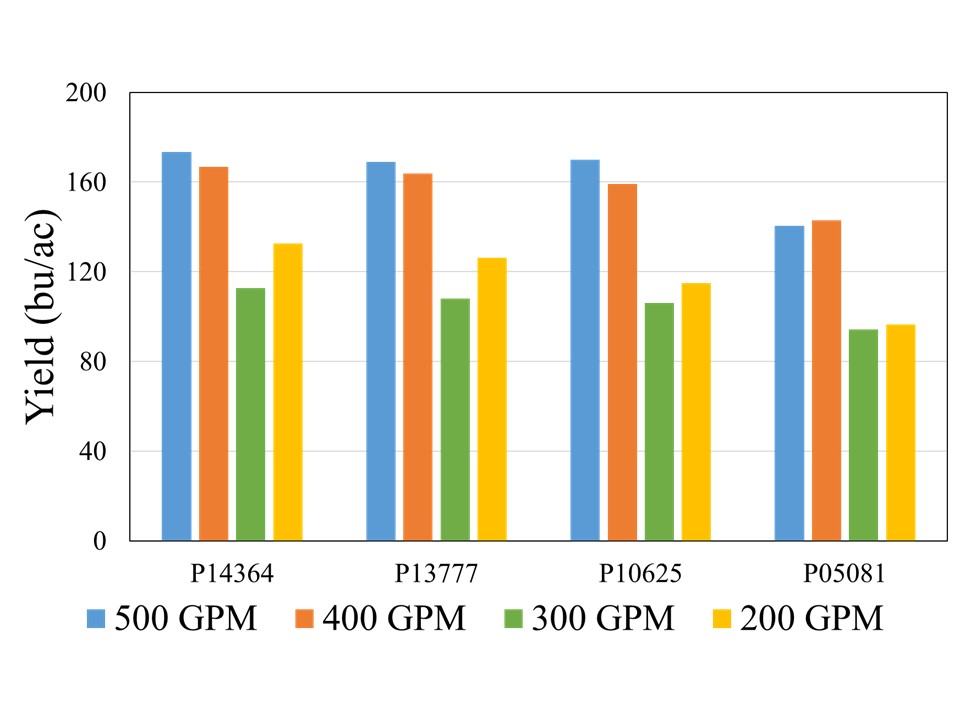
Although there was no statistical difference among the hybrids at 500, 400, and 300 GPM, when compared across well capacities, yield reductions were most pronounced at the 200 and 300 GPM irrigation levels for each individual hybrid, indicating that irrigation capacity was the primary yield limiting factor under restricted water availability (Figure 2). While the exact causes of this abrupt decline are not yet understood, as mentioned in the beginning of this blog, previous literature has suggested that severe yield decline in corn can be expected when irrigation is reduced to 60% ET replacement in the study region. Both 300 and 200 GPM well capacities met 60 and 65% crop ET demand, while 400 and 500 GPM met 71 and75% crop ET demand, respectively. More data will be needed to ascertain these threshold levels of well capacities for corn production in this region.
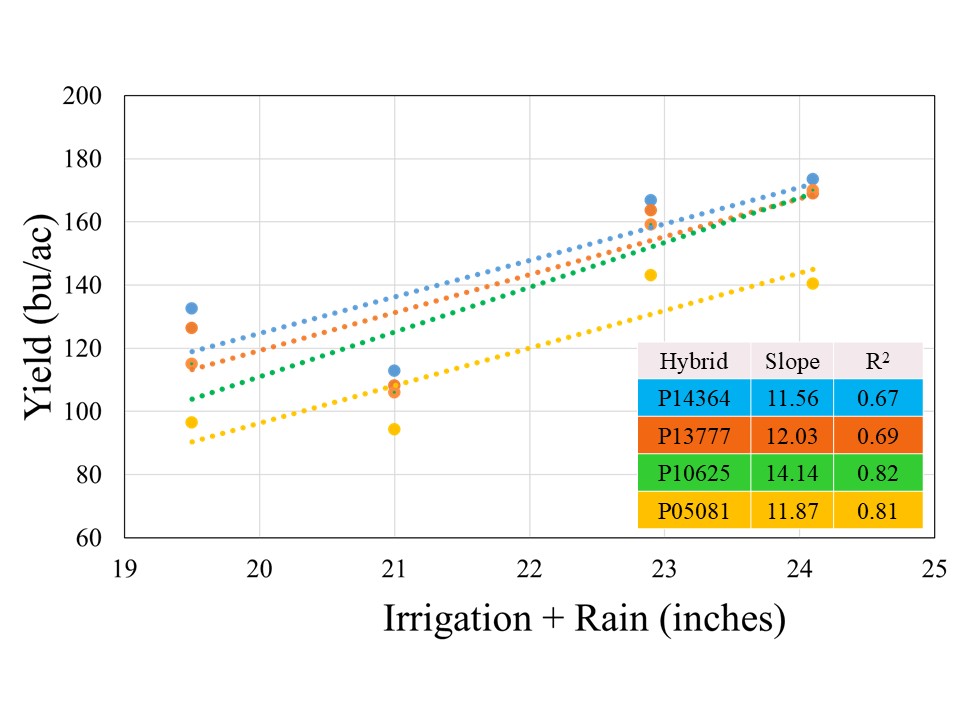
All the hybrids showed a positive yield response to Irrigation+Rain with different yield gains per inch of water applied (Figure 3). Hybrid P10625 registered highest yield gain of 14.1 bushel per inch of water applied, followed by P13777 (12.0 bu), P05081 (11.9 bu), and P14364 (11.6 bu). The stronger coefficient of regression (>80%) for two short maturity varieties indicated that irrigation was stronger yield limitation factor for these hybrids, in comparison to 114 and 113-day maturity hybrids for irrigation explained on 67 and 69% variability, respectively. This suggests that besides irrigation there might be other factors which could contribute to filling the yield gaps for given irrigation levels in longer maturity hybrids.
Planting population did not significantly affect grain yield across irrigation capacities. When pooled across the hybrids for individual planting populations, 28,000 seeding rates resulted in gain of 0.1, 2.6, 5, and 12 bushels per acre for 200, 300, 400, and 500 GPM, respectively. This indicates that higher planting populations at well capacities of 400 or above should be considered, while reducing population at 300 GPM or lower might be more cost-effective option.
Take Home
- Irrigation capacity remains the primary determinant of yield potential under limited well capacities in the Central High Plains.
- Pre-irrigation and recharging the soil profiles will be critical to support crop water demand for limited well capacities.
- Short maturity hybrids appeared to have consistently lower average yield and more vulnerable for yield losses at limited irrigation. However, one must consider that the growing conditions were more conducive for corn production in 2025 which generally favor long maturity hybrids. Therefore, long-term data will be required to assess the performance of short maturity hybrids during inclement growing seasons.
- Even though population didn’t significantly influence the grain yield. The 28,000 seeding rates overall had higher average yield at 400 and 500 GPM. Therefore, producers should consider the higher population at these well capacities or more.
- Overall, irrigation is the most important factor for yields, but there is a need for long-term agronomic data on hybrid maturity and population along with economic analysis to ascertain these findings.
Sorghum Nitrogen Timing
Contributors:
Josh Lofton, Cropping Systems Specialist
Brian Arnall, Precision Nutrient Specialist
This blog will bring in a three recent sorghum projects which will tie directly into past work highlighted the blogs https://osunpk.com/2022/04/07/can-grain-sorghum-wait-on-nitrogen-one-more-year-of-data/ and https://osunpk.com/2022/04/08/in-season-n-application-methods-for-sorghum/
Sorghum N management can be challenging. This is especially true as growers evaluate the input cost and associated return on investment expected for every input. Recent work at Oklahoma State University has highlighted that N applications in grain sorghum can be delayed by up to 30 days following emergence without significant yield declines. While this information is highly valuable, trials can only be run on certain environmental conditions. Changes in these conditions could alter the results enough to impact the effect delay N could have on the crop. Therefore, evaluating the physiological and phenotypic response of these delayed applications, especially with varied other agronomic management would be warranted.
One of the biggest agronomic management sorghum growers face yearly is planting rate. Growers typically increase the seeding rate in systems where specific resources, especially water, will not limit yield. At the same time, dryland growers across Oklahoma often decrease seeding rates by a large margin if adverse conditions are expected. If seeding rates are lowered in these conditions and resources are plentiful, sorghum often will develop tillers to overcome lower populations. However, if N is delayed, there is a potential that not enough resources will be available to develop these tillers, which could decrease yields.
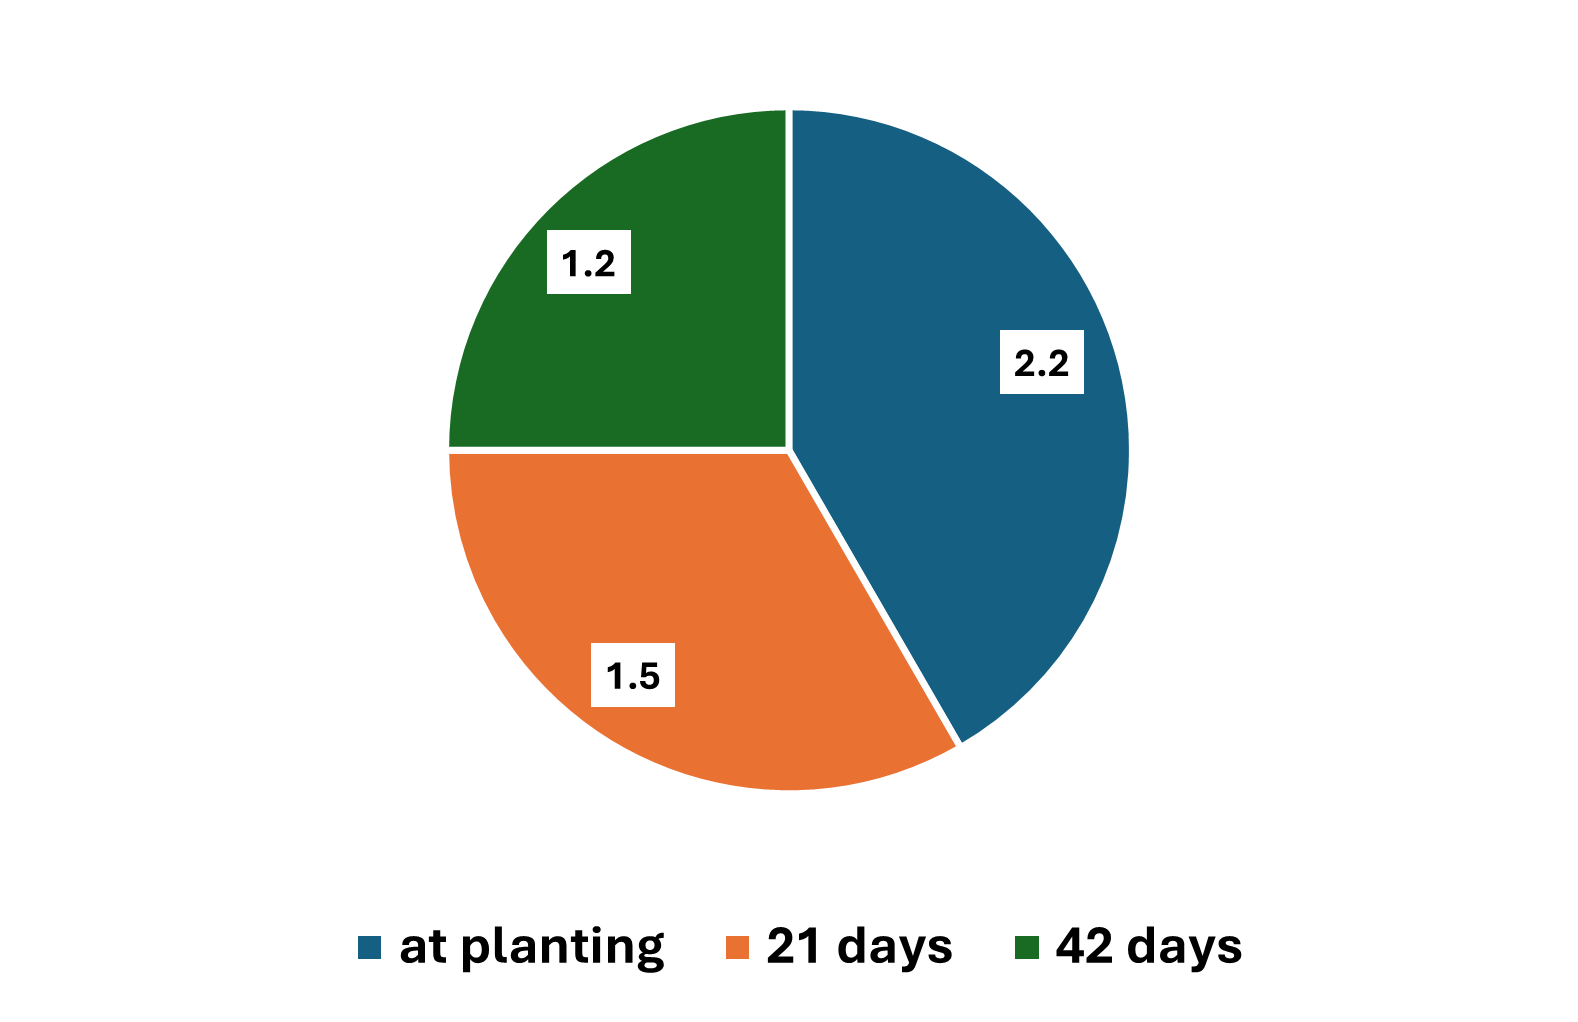
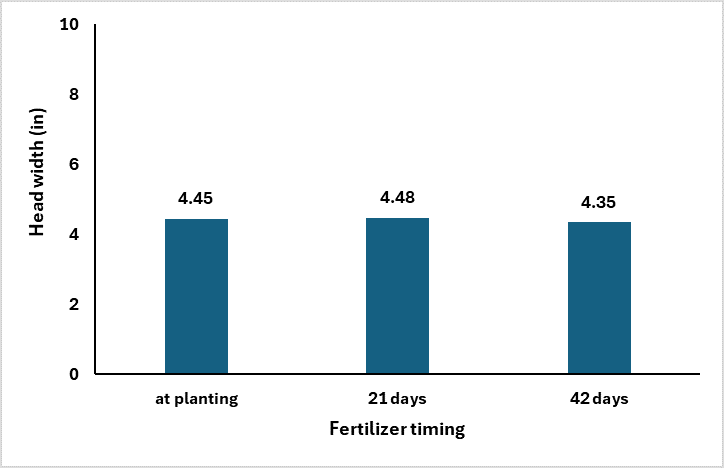
A recent set of trials, summarized below, shows that as N is delayed, the number of tillers significantly decreases over time. Furthermore, the plant cannot overcompensate for the lower number of productive heads with significantly greater head size or grain weight.
This information shows that delaying sorghum N applications can still be a viable strategy as growers evaluate their crop’s potential and possible returns. However, delayed N applications will often result in a lower number of tillers without compensating with increased primary head size or grain weight.

This date on yield components is really interesting when you then consider the grain yield data. The study, which is where the above yield component data came from, was looking at population by N timing. The Cropping Systems team planted 60K seeds per acre and hand thinned the stands down to 28 K (low) and 36K (high). The N was applied at planting, 21 days after emergence, and 42 days after emergence. The rate of N applied was 75 lbs N ac. It should be noted both locations were responsive to N fertilizer.

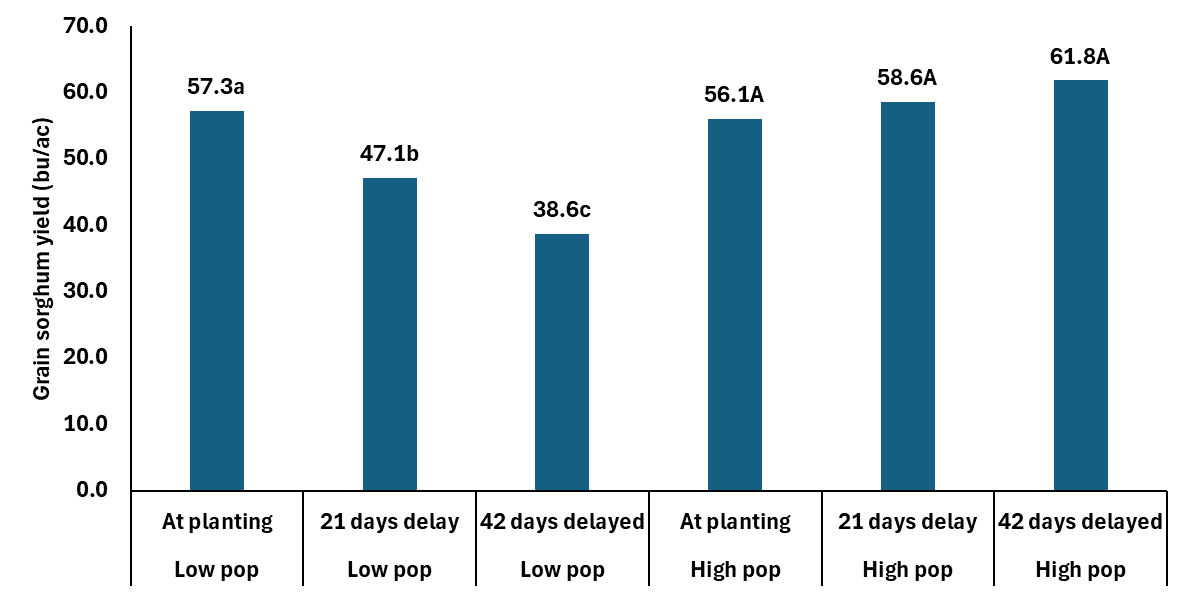
In the data you can without question see how the delayed N management is not a tool for any of members of the Low Pop Mafia. However those at what is closer to mid 30K+ there is no yield penalty and maybe a yield boost with delayed N. The extra yield is coming from the slightly heavier berries and getting more berries per head. Which is similar to what we are seeing in winter wheat. Delaying N in wheat is resulting in fewer tillers at harvest, but more berries per head with slightly heavier berries.
Now we can throw even more data into the pot from the Precision Nutrient Management Teams 2024 trials. The first trial below is a rate, time and source project where the primary source was urea applied in front of the planter for pre in range of rates from 0-180 in 30 lbs increments. Also applied pre was 90 lbs N as Super U. Then at 30 days after planted we applied 90 lbs N as urea, SuperU, UAN, and UAN + Anvol.
Pre-plant urea topped out at 150 lbs of Pre-plant (57 bushel), but it was statistically equal to 90 lbs N 51 bushel. The use of SuperU pre did not statistically increase yield but hit 56 bushel. The in-season shots of 90 lbs of UAN, statistically outperformed 90 pre and hit our highest yeilds of 63 and 62 bushel per acre. The dry sources in-season either equaled their in preplant counter parts.

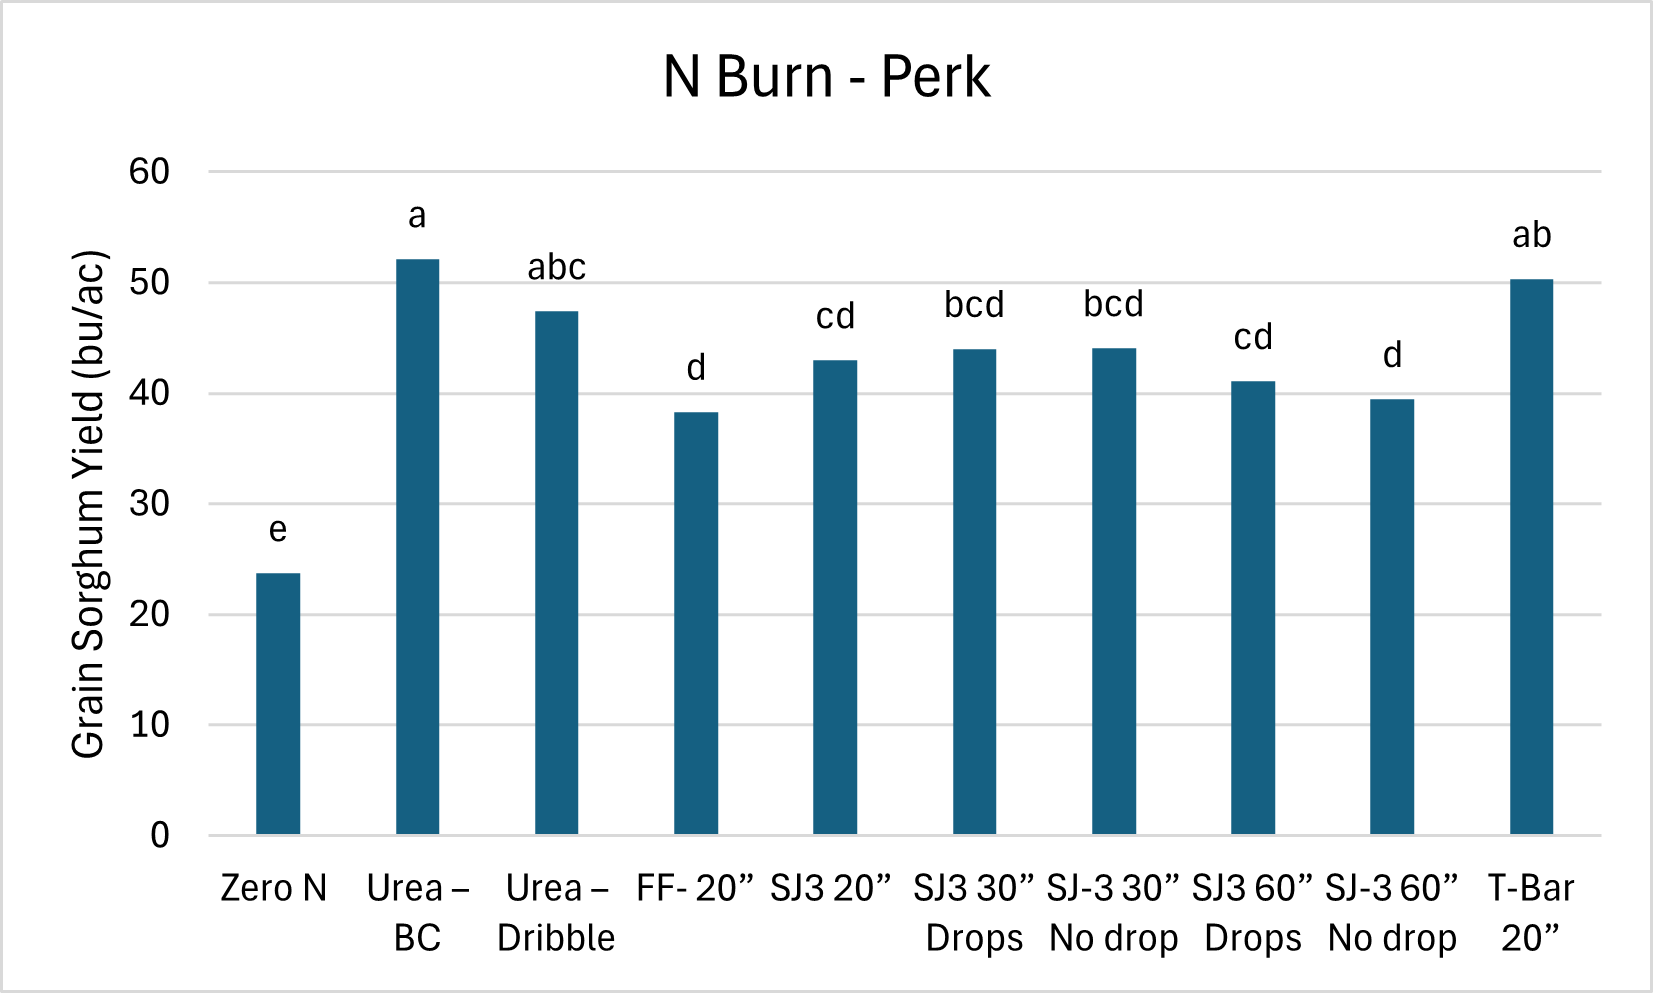
The Burn Study at Perkins, showed that the N could be applied in-season through a range of methods, and still result good yields. In this study 90 lbs of N was used and applied in a range of methods. The treatments for this study was applied on a different day than the N source. Which you can see in this case the dry untreated urea did quite well when when applied over the top of sorghum. In this case we are able to get a rain in just two days. So we did get good tissue burn but quick incorporation with limited volatilization.
Take Home:
Unless working in low population scenarios. The data show that we should not be getting into any rush with sorghum and can wait until we know we have a good stand. We also have several options in terms of nitrogen sources and method of application.
Any questions or comments feel free to contact Dr. Lofton or myself
josh.lofton@okstate.edu
b.arnall@okstate.edu
Funding Provided by The Oklahoma Fertilizer Checkoff, The Oklahoma Sorghum Commission, and the National Sorghum Growers.
Management of soybean inoculum
Josh Lofton, Cropping Systems Specialist
Brian Arnall, Precision Nutrient Management Specialist
Soybean, a legume, can form a symbiotic relationship with Bradyrhizobium japonicum (Kirchner, Buchanan) and create their N to supplement crop demands. However, this relationship depends upon these beneficial microorganisms’ presence and persistence in the soil. This specific strain of microorganisms is not native to Oklahoma and thus must be supplemented using inoculum as a seed treatment. However, the use of inoculums alone does not guarantee a successful relationship. Handling, storage, soil conditions, and other factors can impact the ability of these microorganisms to do their job.
Soybean nitrogen demand is high, with most reports indicating that soybeans need 4.5 to 5.0 pounds of nitrogen per bushel of grain yield. This means that a 30-bushel crop requires between 135 and 150 pounds of nitrogen per acre (in comparison, corn and wheat need only 0.8 or1.6 pounds, respectively). This relationship has been shown to supply an equivalent of 89 lbs of N to the soil. In the previous example, these bacteria could fulfill 50-90% of nitrogen demand, reducing input costs significantly.
However, the bacteria associated with soybean inoculum are living organisms. Therefore, the conditions they experience before being applied to the seed and after treatment (including both before and following planting) can significantly impact their relationship with the soybean plant and, thus, their ability to provide N to the plant. By introducing a high concentration of bacteria near the seed and emerging root, this symbiotic relationship is more likely to be established quickly.
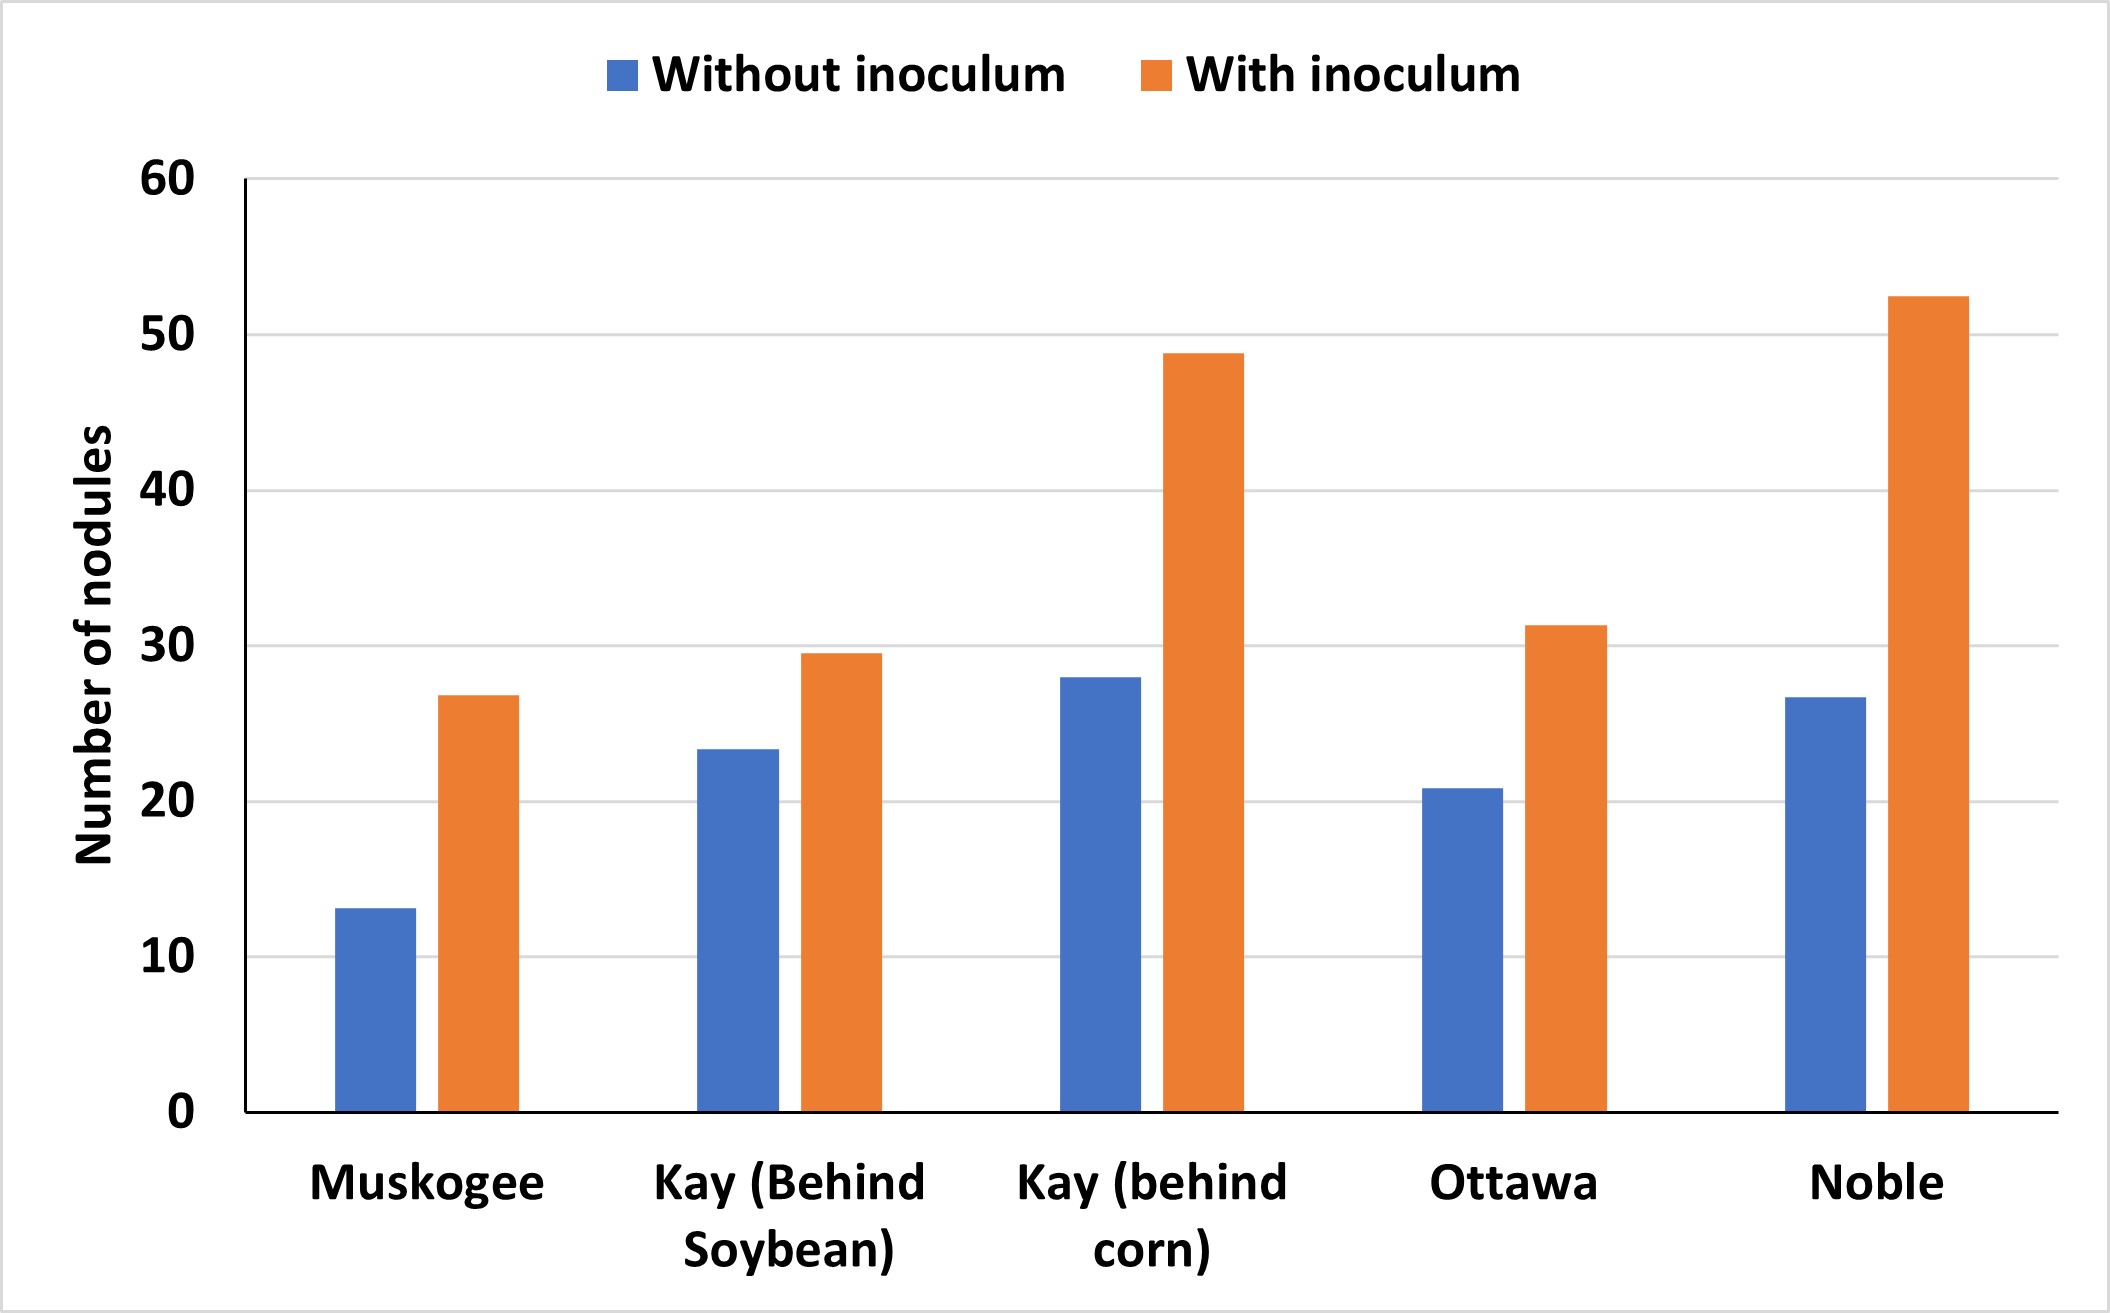
The importance of using inoculum is often debated in Oklahoma, particularly given the fluctuating prices of commodities and inputs. A recent assessment of various soybean-producing areas throughout the state revealed that most fields experienced advantages from incorporating soybean inoculation (Figure 1).
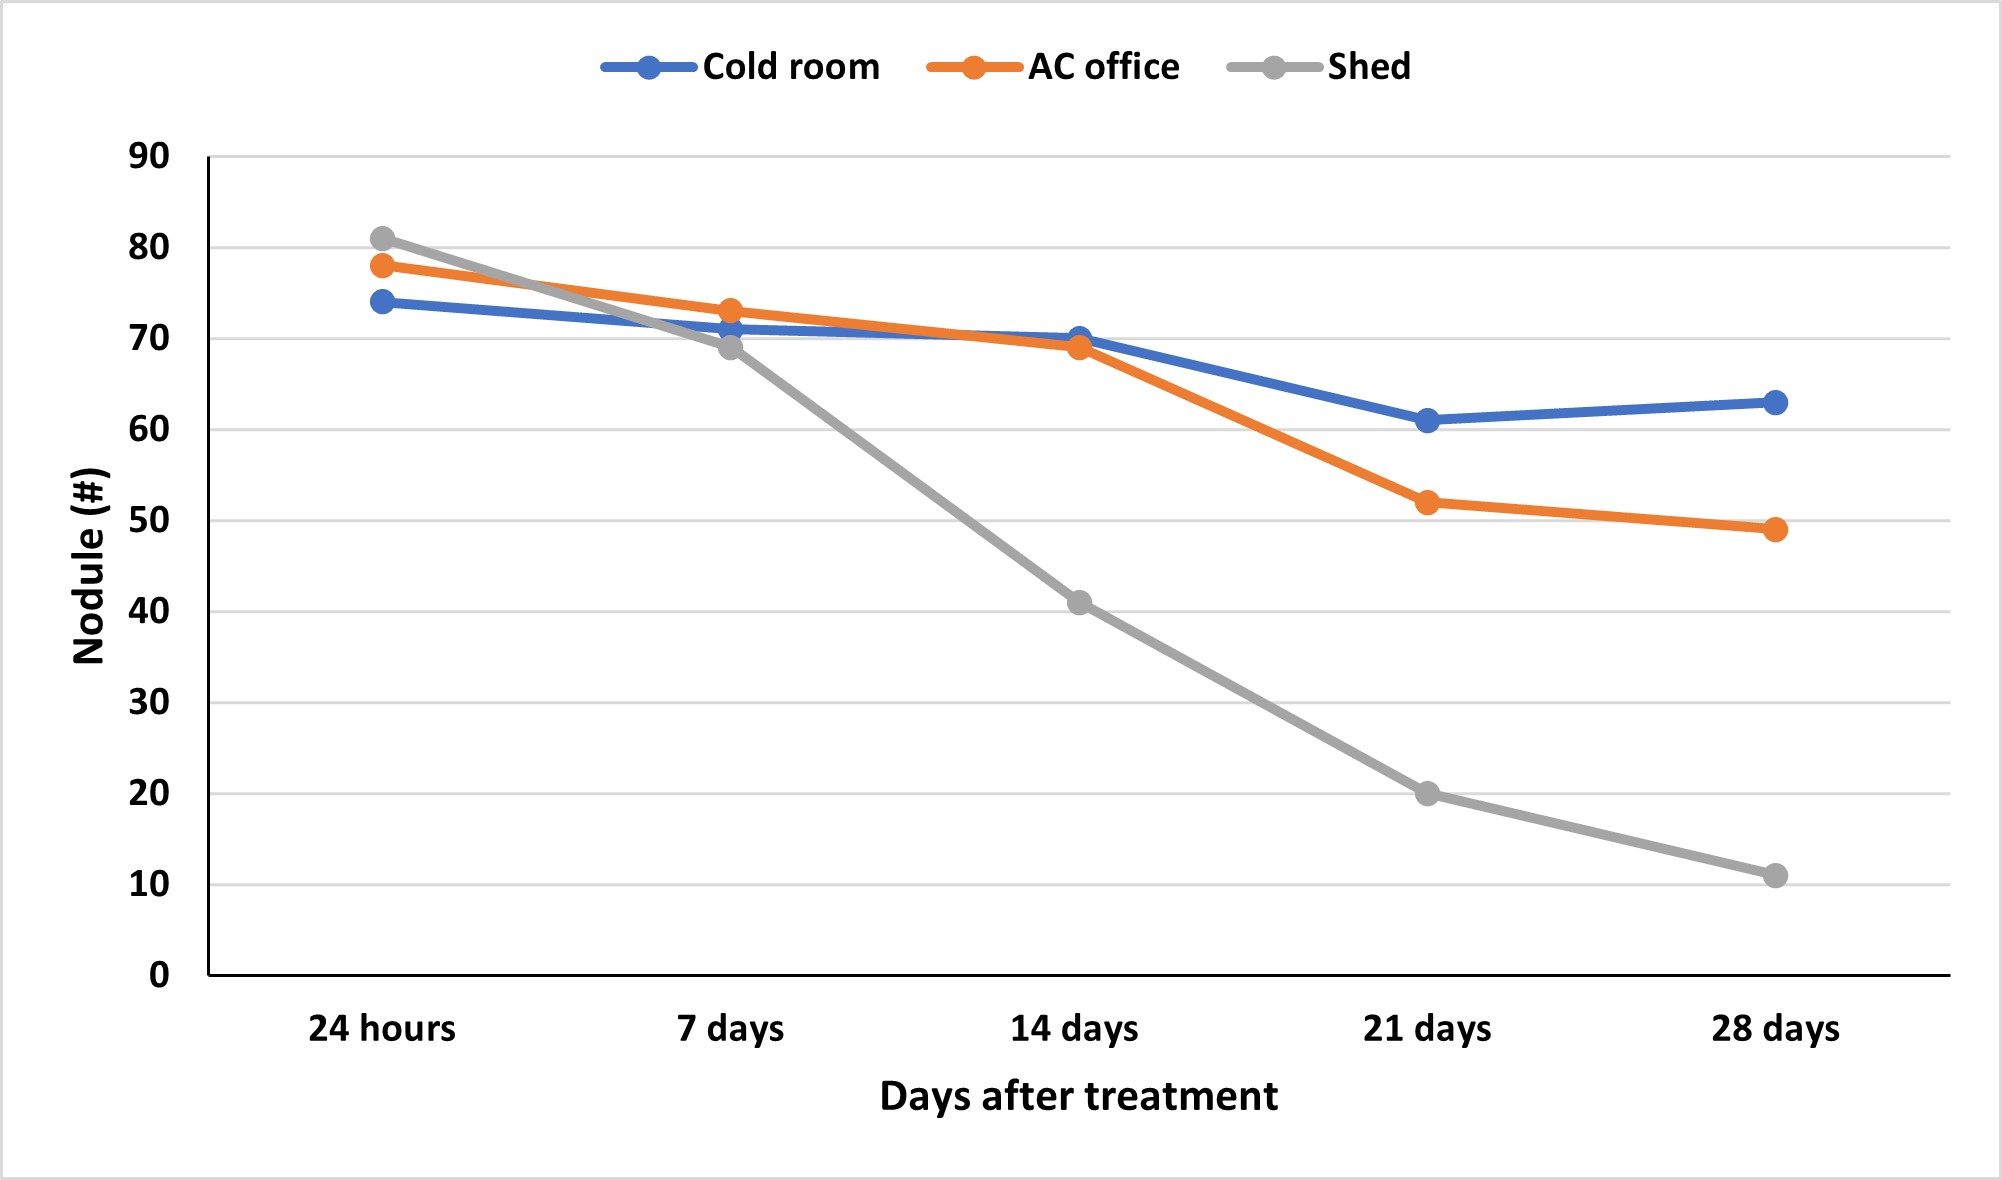
These benefits can be seen when the inoculum maintains viability until it is planted. It is always recommended that the bacteria be stored in a cool, dark environment before application on the seed. These conditions help preserve the survival of these bacteria outside of the host relationship. An evaluation of soybean inoculant after being stored short-term in different conditions found that in as little as 14 days, viability can decrease when kept in non-climate-controlled conditions (Figure 2). Additionally, viability was further reduced at 21 days when stored at room temperature compared to a refrigerated system
However, conditions colder than this, such as the use of a freezer, can compromise survival as well. Storing inoculum in the freezer forms ice crystals within the living cells and damages the cell membranes, making the microorganisms less likely to be alive upon rethawing. Additional chemicals can be added to increase the viability of long-term storage and sub-freezing temperatures. From an application standpoint, a new product should be purchased if additional storage is needed beyond short-term storage.
An additional question frequently arises: “How often should I inoculate my soybean?” As mentioned, these bacteria are not native to Oklahoma. As a result, they are not well adapted to survive in our environment and must outcompete native populations in the soil. Additionally, periods of hot and dry conditions appear to reduce the bacteria’s ability to survive without a host, the soybean roots. These are conditions we often observe in Oklahoma systems. Therefore, inoculation should be applied with every soybean planting to ensure a sufficient population of these bacteria. These bacteria promote root nodulation and nitrogen fixation in the soil.
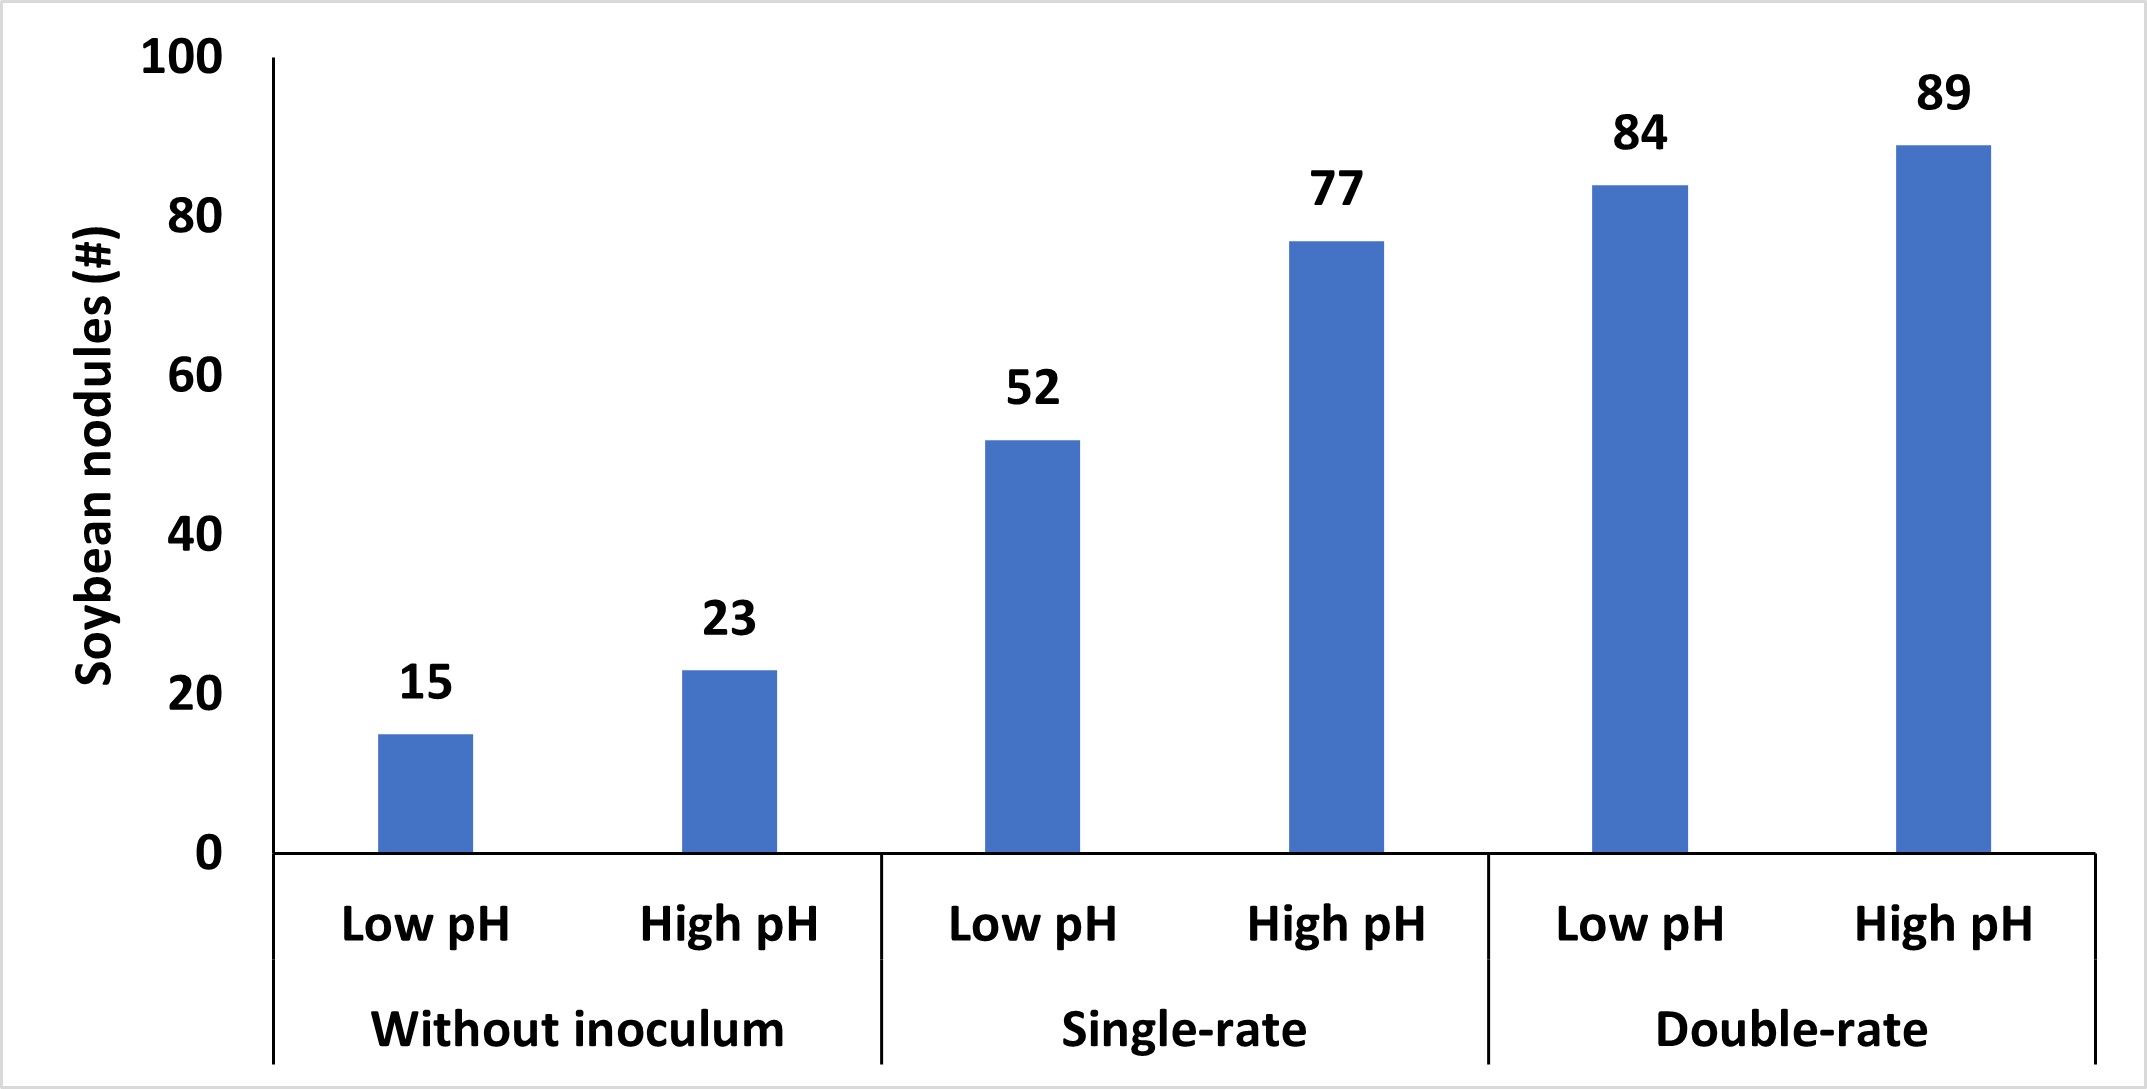
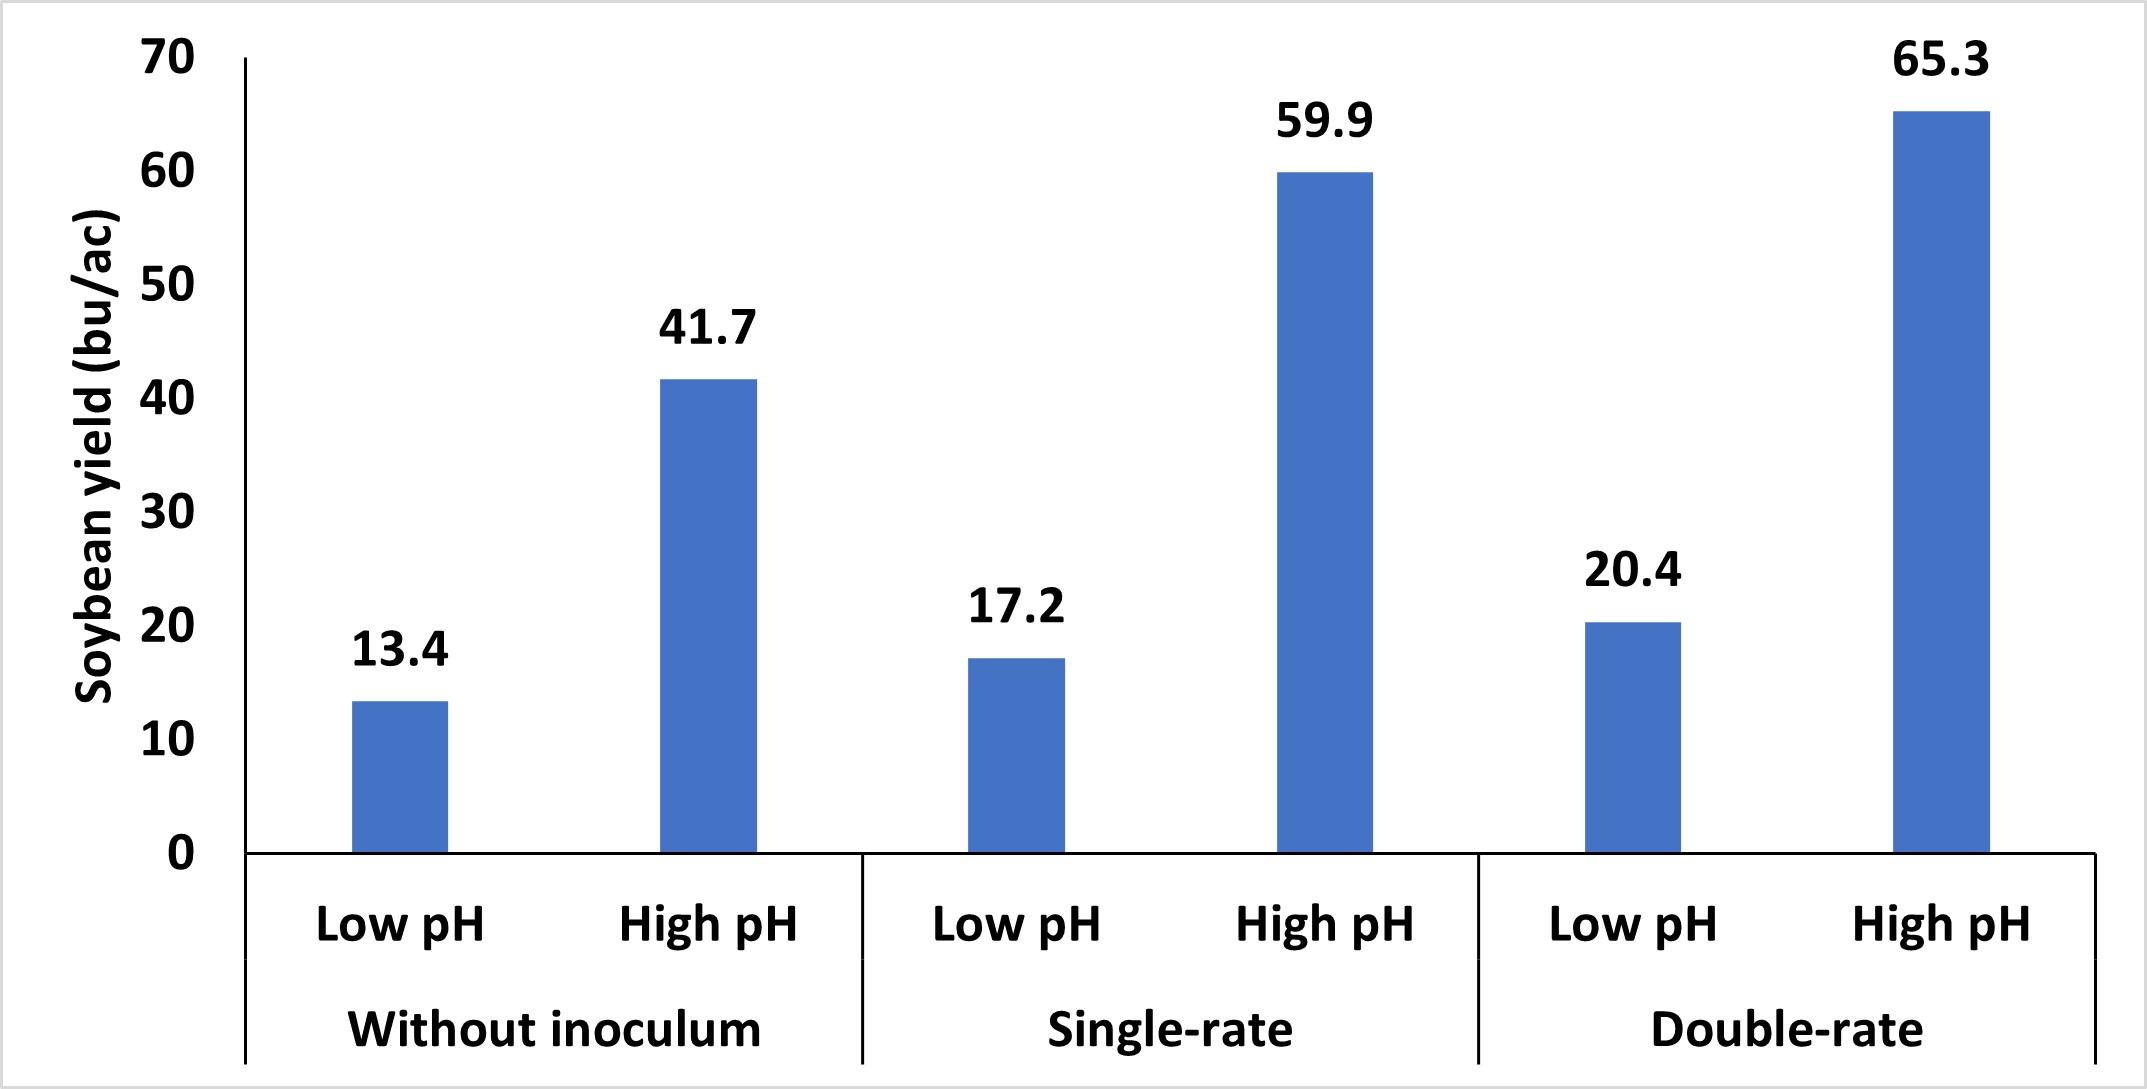
Other soil conditions, such as excessively dry or wet soils, high or low pH, and residual nutrients, can also impact the persistence of these microorganisms. Of these, soil pH has the biggest impact on the survival of these bacteria. High pH is less of a concern to Oklahoma production systems; however, soil with lower pH should be remediated. Like many bacterial systems, these bacteria optimally function at a pH range that closely resembles the ideal pH range for most crops. Lowering the soil pH below a critical threshold reduces the viability of the bacteria, hampers N-fixation processes, and diminishes the capacity of both the bacteria and soybean plants to form and maintain this relationship. While applying inoculum to soybean seeds in these adverse soil conditions can provide some advantages (Figure 3), but it often doesn’t increase yields. Therefore, inoculation with corresponding adjustments to soil pH represents the best approach.
While using inoculum is not a new concept, it is important to highlight the benefits it can provide when utilized correctly. The potential to reduce N input costs is attractive, but the effectiveness depends on proper handling, storage, and soil conditions until it can intercept the host. To maximize benefits, inoculum should be stored in a cool, dark environment and utilized in a timely manner. If there is doubt that there are not enough bacteria, an inoculum should be added. Oklahoma’s climate, particularly hot and dry conditions, can limit bacteria survival, reinforcing the need to treat the inoculum until it is in the ground carefully. Additionally, considering the soil environment is important to sustain the population of bacteria until it can inoculate its host. Emphasis on these small details can have a large impact on the plant’s ability to fix nitrogen and optimize productivity throughout the growing season.
TAKE HOMES
* Soybean requires more lbs of N per bushel than most grain crops.
* Soybeans symbiotic relationship with rhizobia can provide the majority of this nitrogen.
* Soybean rhizobia is not native to Oklahoma soils so should be added to first year soybean fields.
* Inoculum should be treated with care to insure proper nodulation.
* Due to Oklahoma’s climate and existing soil conditions rhizobia may not persist from year to year.
Any questions or comments feel free to contact Dr. Lofton or myself
josh.lofton@okstate.edu
b.arnall@okstate.edu
Appreciation of the Oklahoma Soybean Board for their support of this project.
A comparison of four nitrogen sources in No-till Wheat.
Jolee Derrick, Precision Nutrient Management Masters Student.
Brian Arnall, Precision Nutrient Management Specialist.
Nitrogen (N) fertilizer’s ability to be utilized by a production system is reliant upon the surrounding environment. The state of Oklahoma’s diverse climate presents unique challenges for producers aiming to apply fertilizers effectively and mitigate the adverse effects of unfavorable conditions on nitrogen fertilizers. To lessen the effect that unfavorable environments can have on N fertilizers, chemical additions have been introduced to base fertilizers to give the best possible chance at an impact. With that in mind, a study was conducted to investigate the impact of N sources and application timings on winter wheat grain yield and protein, aiming to identify both the agronomic effects of these sources and how variations in their timing may influence the crop. Included below is a figure of where and when the trials were conducted.

In each of the trials, four N sources (Urea, SuperU, UAN, and UAN + Anvol) were analyzed across a range of timings. The sources were categorized on two criteria: application type, distinguishing between dry and liquid sources, and the presence of additives versus non-additives. The two N sources were Urea and UAN. The other products in this study were SuperU and Anvol. SuperU is a N product that has Dicyandiamide (DCD) and N- (n-butyl) thiophosphoric triamide (NBPT) incorporated into a Urea base. Anvol is an additive product which contains NBPT and Duromide and can be incorporated with dry or liquid N sources.
For additional clarification, N- (n-butyl) thiophosphoric triamide is a urease inhibitor which prevents the conversion of urea to ammonia. Duromide is a molecule which is intended to slow the breakdown of NBPT. DCD is a nitrification inhibitor that slows the conversion of ammonium to nitrate.
Urea is a stable molecule which in the presence of moisture is quickly converted to stable ammonium (NH4), however it can be converted to ammonia gas (NH3) by the enzyme urease beforehand. Additionally, when urea is left on the soil surface and not incorporated via tillage or ½ inch of a precipitation event, the NH4 that was created from urea can be converted back to NH3 and gasses off. So, the use of urease inhibitors is implemented to allow more time for incorporation of the urea into the soil.
Ammonium in the soil is quickly converted to nitrate (NO3) by soil microbes when soil temperature is above 50F°. When N is in the NO3 form it is more susceptible to loss through leaching or denitrification. Therefore, nitrification inhibitors are applied to prevent the conversion of NH4 to NO3.
All treatments were applied at the same rate of 60 lbs of N ac-1, which is well below yield goal rate. A lower N rate was chosen to allow the efficacy of the products to express themselves more clearly, rather than a higher rate that may limit the ability to determine differences between product and rate applied. Furthermore, dry N sources were broadcasted by hand across the plots while liquid sources were applied by backpacking utilizing a handheld boom with streamer nozzles. Application timing dates were analyzed by identifying the growing degree days (GDD) associated with each timing which were correlated with the Feekes physiological growth chart displayed in Figure 3. Over the span of the study, N has been applied over six stages of growth. The range of application dates stems from the fact that it is difficult to get across all the ground exactly when you need to.


Over four years this study was replicated 11 times. Of those 11 site years, three did not show a response to N, so they were removed from further analysis. The graph above shows the average yield of each respective source (across all locations and timings). The data shows there is a statistical difference between SuperU and Urea vs. UAN, but no statistical difference between UAN treated Anvol and any other source. The data indicates that on average, a dry source resulted in a higher yield than when a liquid source was applied. This makes sense considering that in many cases, wheat was planted in heavy residue during cropping seasons that experienced prolonged drought conditions. Therefore, it is thought that a liquid source can get tied up in the residue. This was first reported in a previous blog posting, Its dry and nitrogen cost a lot, what now?, and years later, the same trends in new data indicate the same conclusion.

If we look at all timings and site years averaging together there is no statistical difference between a raw N source and its treated counterpart. This result is not surprising as we would expect that not all environments were conducive to loss pathways that the products prevented. Basically, we would not expect a return on investment in every single site year, and therefore you do not see broad sweeping recommendations. There was a 2-bushel difference between UAN and UAN Anvol. As this was a numerical difference, not a statistical one, I would say that while the yield advantage was not substantial there may be economic environments that would suggest general use.

While the evaluation of the four sources across all timings and locations showed some interesting results, this work was performed to see if there was a timing of application which would have a higher probability of a safened N returning better yields. As you look at the chart above it is good to remember the traditional trend for precipitation in Oklahoma, where we tend to start going dry in November and stay dry through mid-January. Rain fall probability and frequency starts to increase around mid-February, but moisture isn’t consistent until March. This project was performed during some of the dryest winters we have seen in Oklahoma. Also, just a note, since the graph above combines all the sites that have differing application dates the absolute yields are a bit deceiving. For example, the Nov and Feb timings include the locations with our highest yields 80+ bpa per acre, while January and February include our lowest. So, the way this data is represented we should not draw conclusions about best time for N app. For that go read the blogs Impact Nitrogen timing 2021-2022 Version and Is there still time for Nitrogen??


Figure 6a and b. A: The mesonet rainfall totals for Oct -Dec for the Lake Carl Blackwell research station for 2020-2023 A: The mesonet rainfall totals for Jan – April for the Lake Carl Blackwell research station for 2021-2024. The black line on both graphs is the 10 year average.
Now about the source by time. While it’s not always statistical you can see that the dry sources tend to outperform the liquid sources at most timings. Also, while there is never a statistical difference in the raw product and safened, there are trends. SuperU tended to have higher yields than urea when applied in Nov and Dec. It could be hypothesized that the addition of a nitrification inhibitor may have added value, however the UAN + Anvol in November also showed a positive response that would point to the value being derived from urease inhibition. As we move into the period of more consistent rainfall the differences between products start declining, which also makes sense.
The following figures illustrate rainfall events following N application, with the application dates indicated by arrows. Figure 7 corresponds to our trial conducted in 2020-2021, which revealed no statistical differences among the N sources for any timing. However you can see that for the first timing (orange bars) which received 0.7″ of rain two days after application that the yields are uniform than the grey bars with both safened products are numerically greater than the raw product, just makes since as a 0.1″ precipitation event happened 6 days application application and it wasn’t until day 9 that a good incorporating rainfall occurred.

Figure 8 has data the same location one year later, during which we observed statistically significant differences among the dry and liquid N sources. The environmental conditions during 2022 were drier, impacting the incorporation of N applications. The lack incorporating rainfall likely led to tie-up of the UAN on/in the residue, limiting access to plant available N.

It is essential to highlight the environmental conditions encountered throughout this project. From 2020 to 2023, moderate to extreme drought conditions were prevalent. During this period, the influence of a La Niña led to reduced moisture availability. For the first time in an extended period, the 2023-2024 wheat year began under a strong El Niño, which typically results in increased moisture accumulation compared to its La Niña counterpart. Currently, there are indications that a return to a La Niña system may occur by the end of the year, raising the expectation of a potential reversion to drought conditions. Consequently, this research may provide producers with options to consider regarding sources of N application in their production systems.
We plan to update this blog with a deeper analysis of the results seen at each location as soon as possible. But for now, we wanted to share the early look.
At this point the reason for the liquid yield gap is speculation. It could be increased loss via ammonia volatilization or it could be immobilization of the N by microbes. The next step of this process is to understand 1) is the UAN tied up in the residue via immobilization via microbes or is it lost to volatilization. 2) If tied up, what is the time frame between application and immobilization.
Take Home:
- It was observed that during low moisture conditions, dry N sources had significantly better results than liquid counterparts in no-till winter wheat production.
- On average, additive products had no significant impact on grain yield versus base fertilizers, however, when evaluated by location, differences could be found. Responses usually correlated with post-application weather conditions.
- When adequate precipitation was received shortly after application, N sources did not show differences.
Any questions or comments feel free to contact me. b.arnall@okstate.edu

