Home » Posts tagged 'sulfur'
Tag Archives: sulfur

Nitrogen and Sulfur in Wheat
Brian Arnall, Precision Nutrient Management Specialist
Samson Abiola, PNM Ph.D. Student.
Nitrogen timing in wheat production is not a new topic on this blog, in-fact its the majority. But not often do we dive into the application of sulfur. And as it is top-dressing season I thought it would be a great opportunity to look at summary of a project I have been running since the fall of 2017 which the team has call the Protein Progression Study. The objective was to evaluate the impact of N and S application timings on winter wheat grain yield and protein. With a goal of looking at the ratio of the N split along with the addition of S and late season N and S, in such a way that we could determine BMP for maximizing grain yield and protein.
My work in the past has shown two things consistently, that spring N is better on the average and S responses have been limited to deep sandy soils in wet years. Way back when (2013) on farm response strips showed high residual N at depth and no response to S. https://osunpk.com/2013/06/28/response-to-npks-strips-across-oklahoma/. But there has been a lot of grain grown since that time expectations are that we should/are seeing an increase in S response. In fact Kansas State is seeing more S response, especially in the well drained soils in east half of the state.
Some KSU Sulfur works.
https://www.ksre.k-state.edu/news/stories/2022/04/video-sulfur-deficiency-in-wheat.html
https://eupdate.agronomy.ksu.edu/article/sulfur-deficiency-in-wheat-364-1
Click to access sulphur-in-kansas-plant-soil-and-fertilizer-considerations_MF2264.pdf
So the Protein Progression Project was established in 2017 and where ever we had space we would drop in the study. So in the end across six seasons we had 13 trials spread over five locations. Site-years varied by location: Chickasha (2018-2022), Lake Carl Blackwell (2018-2023), Ballagh (2020), Perkins (2021), and Caldwell (2021).

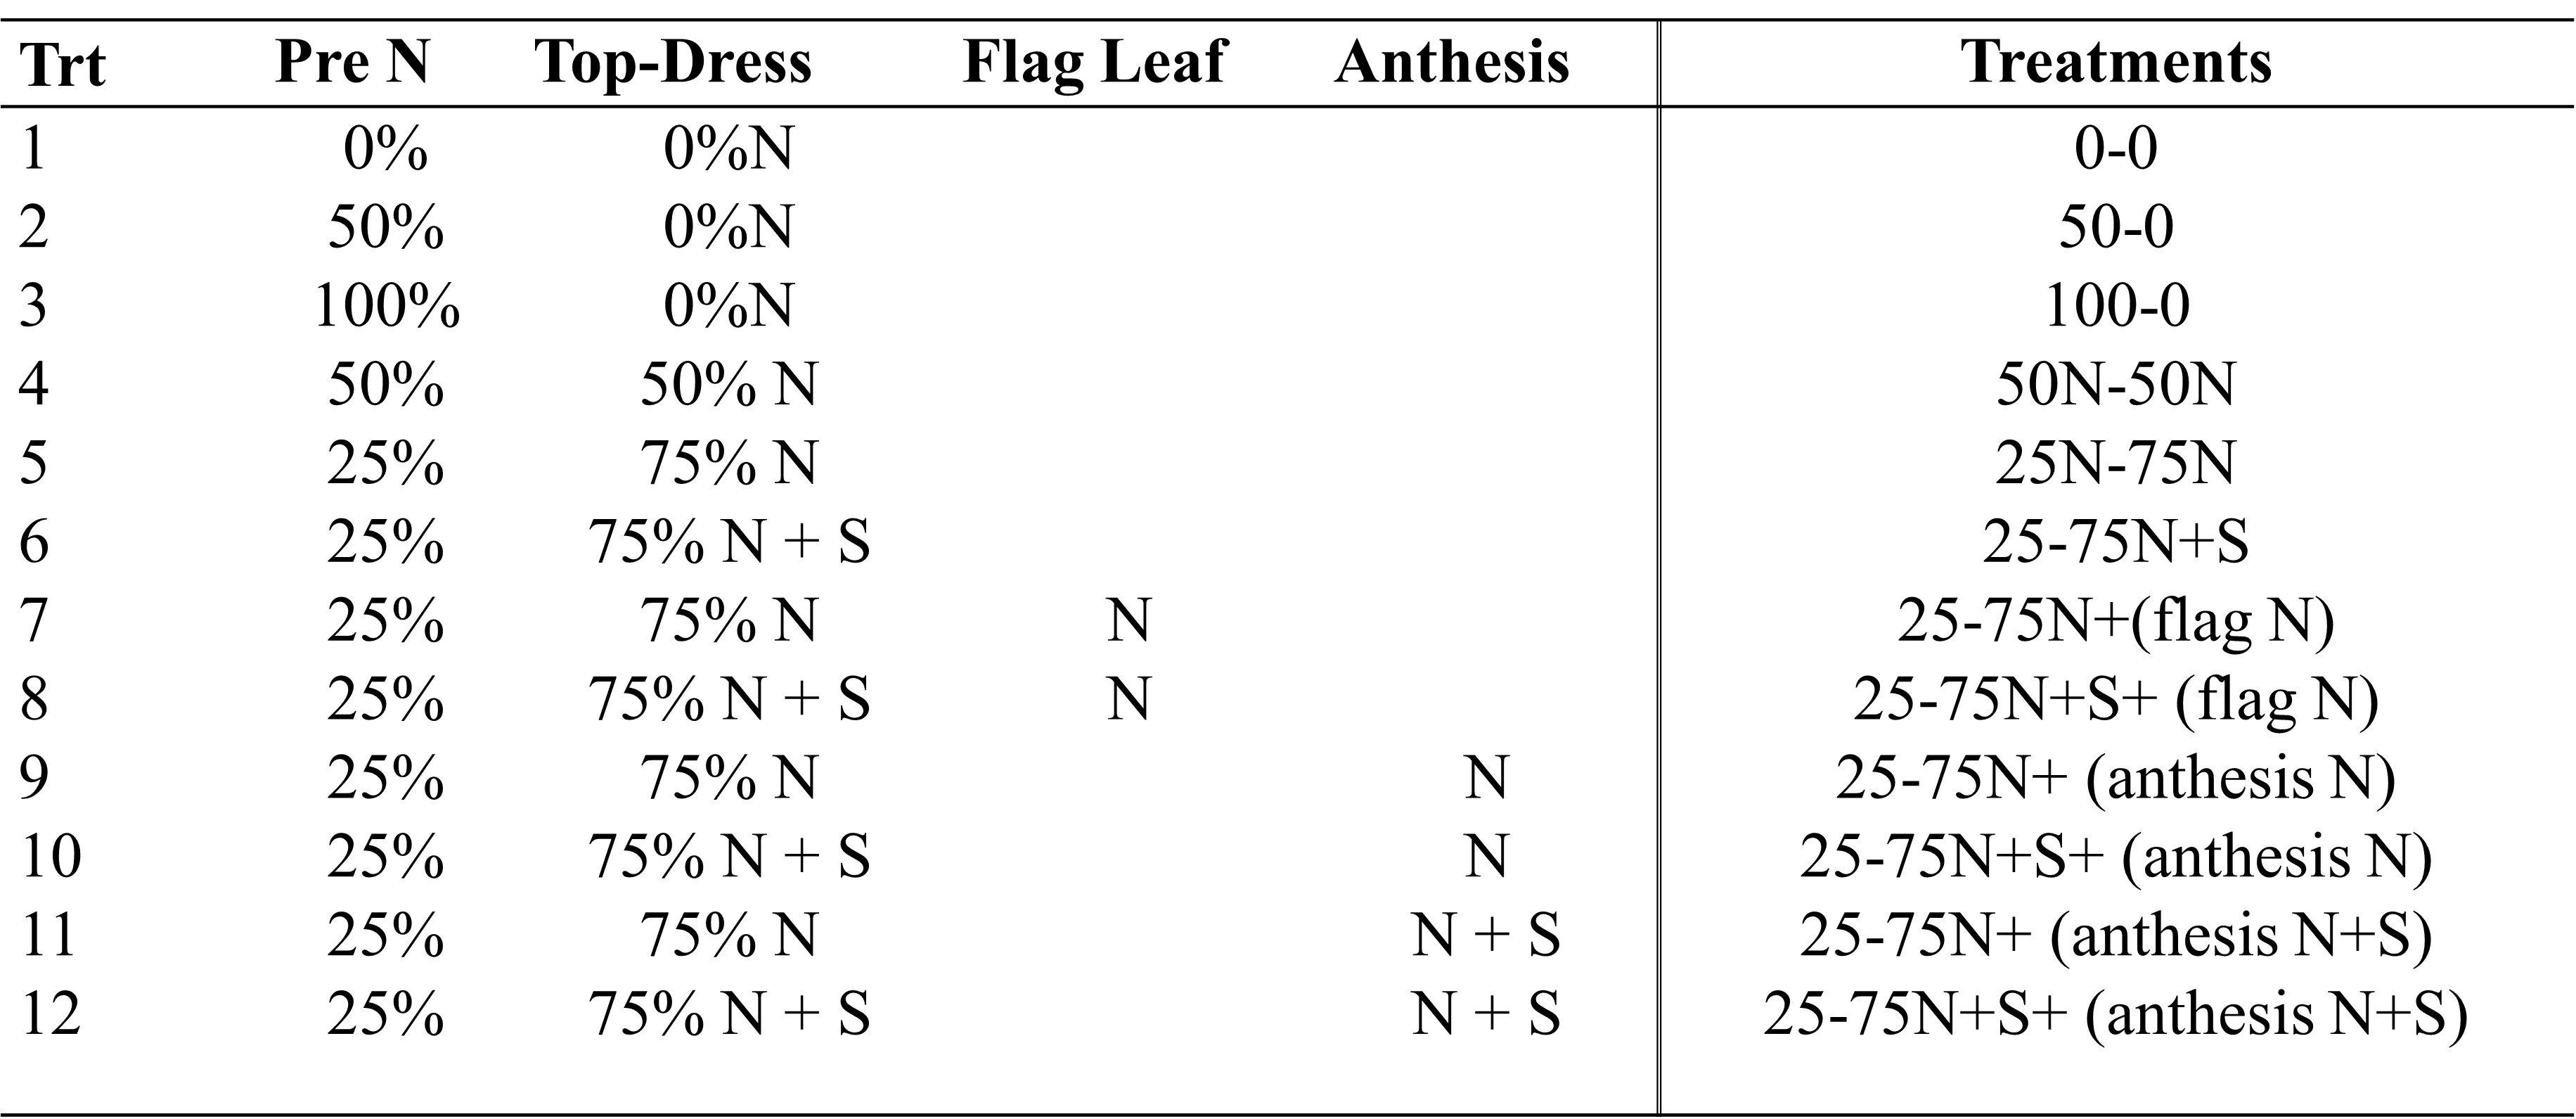
First lets just dive into the the N application were we looked at 100% pre vs 50-50 split and 25-75 split (Table 2.) Based upon the wealth of previous work https://osunpk.com/2022/08/26/impact-of-nitrogen-timing-2021-22-version/, its not much of a surprise that split application out preformed preplant and that having the majority applied in-season tended to better grain yields and protein values.

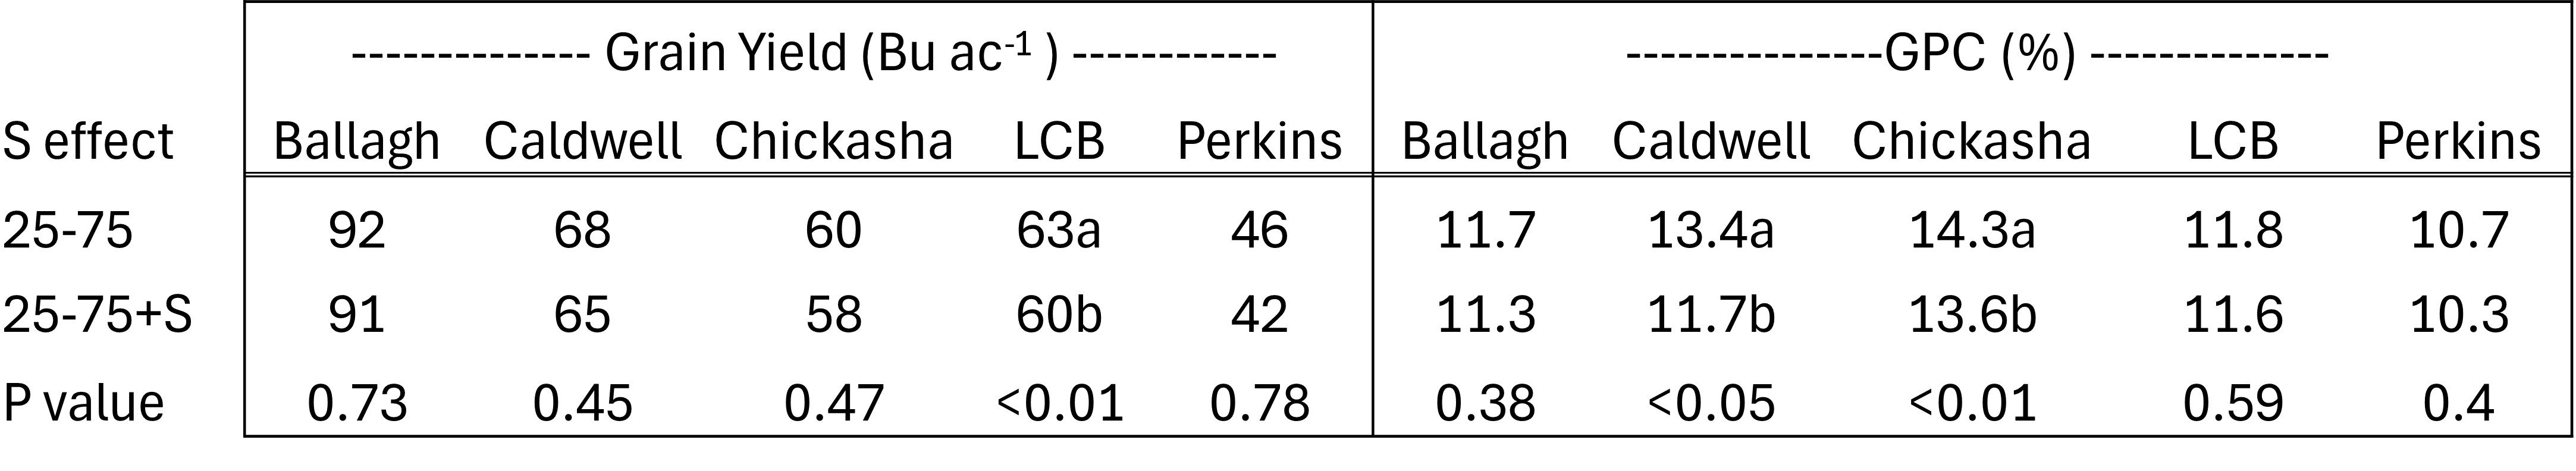
This next table is were things get to be un-expected. While the data below is presented by location, we did run each site year by itself. In no one site year did S statistically, or numerically increase yield. As you can see in Table 2 below, the only statistical response was a negative yield response to S. And you can not ignore the trend that numerically, adding S had consistently lower yields. Even more surprising was the same trend was seen in Protein.
One aspect of Protein Progression trials were that while 0-6″ soil test S tended to be low. We would often find pretty high levels of S when we sampled deeper, especially when there was a clay increase with depth. Sulfur tends to be held by the clay in our subsoil. We are also looking at better understanding the relationship between N and S. In fact a review article published in 2010 discussed that the N and S ratio can negative influence crop production when either one of the elements becomes un-balanced. For example we are seeing more often in corn that when N is over applied we can experience yield loss, unless we apply S. Meaning at 200 lbs of N we make 275 BPA, at 300 N lbs we make 250, but 300 N plus 20 S we can make 275 again. Part of the rationale is that excessive N limits S mineralization. On the flip side if S is applied while N is deficient and yield decrease could be experienced. Maybe that is what we are seeing in this date. Either way, this data is why the Precision Nutrient Management program is spending a fair amount of efforts in understanding the N x S relationship in wheat (which we are looking at milling quality also) and corn.
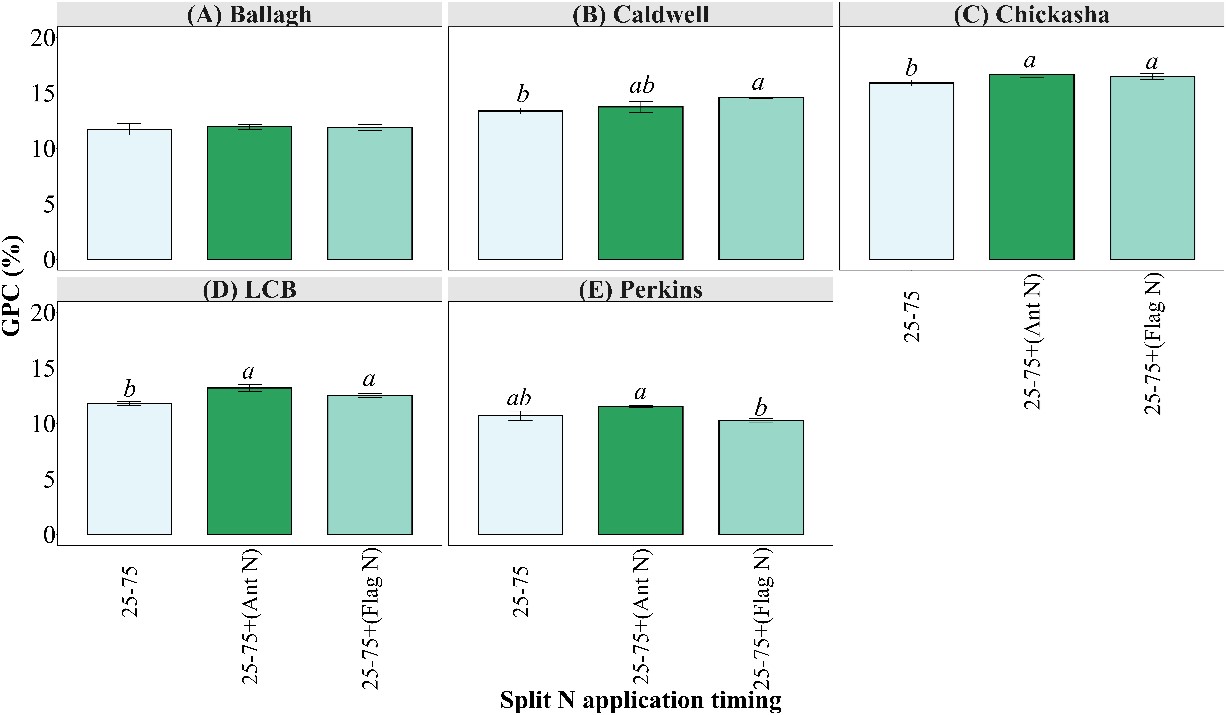
A quick dive into increasing protein with late N applications. At three of the five location GPC was significantly increased with Late N. In most cases the anthesis (flowering) application was the highest with exception of Caldwell. We will have another blog coming out in a month that digs into anthesis applied N at a much deeper level, looking at source, nozzle and droplet sizes.
Looking at this study in a vacuum we can say that it probably best to split apply your N and that in central and northern Ok the addition of S in rainfed wheat doesn’t offer great ROI. If I look at the whole picture of all my work and experience I would offer this. For grain only wheat, the majority if not all N should be applied in-season sometime between green up and two weeks after hollow stem. I have had positive yield responses to S applied top-dress, but it has always been deep sandy soils and wet seasons. I have not have much is any response to S in heavier soil, especially if there is a clay increase in the two feet of profile. So my general S recommendation is 10 lbs in sandy soils and if you show low soil test S in heavier ground and you are trying to push grain yields, then you could consider the addition of S as a potential insurance. That said, I haven’t seen much proof of it.
Take Homes
* Split application of nitrogen resulted in higher grain yields and protein concentrations when compared to 100% preplant.
* Putting on 75% of the total N in-season tended to result in higher grain yields and protein concentrations when compared to 50-50 split.
* Adding 10 lbs of S topdress did not result in any increase in grain yield or protein.
A big Thanks to the collaborators providing on-farm locations for this project. Ballagh Family Farms, Turek Family Farms and Tyler Knight.
Citation. Jamal, A.,*, Y. Moon, M. Abdin. 2010 Review article. Sulphur -a general overview and interaction with nitrogen. AJCS 4(7):523-529 (2010). ISSN:1835-2707.
Any questions or comments feel free to contact me. b.arnall@okstate.edu
Double Crop Response to Additional N, P, K and S.
Vaughn Reed, PhD. Student Precision Nutrient Management
Brain Arnall Precision Nutrient Management Extension Specialist.
Data presented below are the results of Mr. Reeds Masters research project.
On farm research trials are important, because they give us the ability to see responses over a larger geographic area, and even more importantly, evaluate our recommendations on fields that are managed by producers, not researchers. They also allow us to look at current production practices and see if there are any missed opportunities. Several years ago, we looked at whether producers were leaving yield on the table by not applying enough nitrogen (N), phosphorus (P), potassium(K), and sulfur (S) to winter wheat. We did this by applying strips of N, P, K, and S fertilizer on farmers’ fields with the instructions to not change their fertilizer management strategies. If one or more of the strips resulted in higher yields then it could be assumed that either the nutrient was under-applied by the producer, or in the case of N, lost. That study concluded that at 75% of the locations, yield was maximized by the producer with [their respective] NPKS management system, however the greatest responses came from the addition of P and that Oklahoma State University’s soil testing and analysis was adequate for nutrient recommendations. That studies results were published in 2017 and is open access, so available for anyone to read. https://dl.sciencesocieties.org/publications/cftm/abstracts/3/1/cftm2017.02.0014

Locations of double crop fertility response strips applied in the summers of 2016 and 2017.
There are many producers around the state that follow winter wheat with double crops (DC). Often, this practice is done with limited inputs to reduce economic risk. Oklahoma State does not make different recommendations for DC or full season crops, with the exception that yield potentials can differ. In 2016 and 2017 we duplicated the Wheat NPKS study across 3 double crops (soybean, grain sorghum, sunflower) following winter wheat and canola. With a recent climb in DC yields we wanted to investigate if producers were applying enough nutrients to maximize grain yield. Additionally it would allow us evaluate the accuracy of OSU’s soil test based fertilizer recommendations in a double crop. Over the two years, 61 on-farm sites ranging from central to NE Oklahoma had 200 lb/ac of product per nutrient applied in strips 6ft wide by 150 ft long. Urea (46-0-0), triple super phosphate (0-46-0), muriate of potash (0-0-60), and gypsum (0-0-0-19) were used for sources N, P, K, and S, respectively (92 lbs N, 92 lbs P, 120 lbs K, 38 lbs S). In most cases the fertilizer was applied post planting and post-emergence to ensure strips were applied an areas with good stand.
NPKS Strip Applicator. This ground driven 3pt rig uses Gandy boxes to deliver fertilizer into tubes which is then blown, by a PTO driven fan, out into strips 6 feet wide, per box. This applicator was putting out 200 lbs of Urea, 0-46-0, potash, and gypsum out per acre.
Much like with the wheat-NPKS study 75% of the locations did not respond to additional fertilizer. Twenty treatment comparisons of the 244 made across all 61 locations (50 soybean, 7 grain sorghum, 4 sunflower) yielded a statistically significant change in yield due to the addition of N-P-K-or S. For this report, a comparison was the yield of each nutrient versus the non-treated check, therefore there were four comparisons made per location. Seventeen of the twenty positive responses were found in soybean, three with grain sorghum, and no responses were found in sunflower plots. Lack of response from grain sorghum and sunflower locations is contributed to small amount of grain sorghum and sunflower fields in the study.
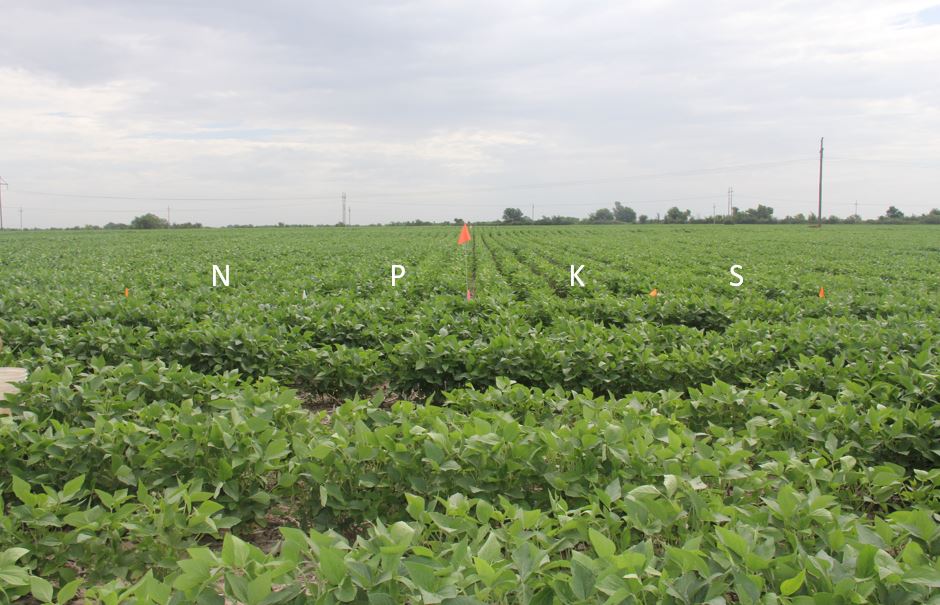
Double crop soybeans in Ottawa County with strips of nitrogen, phosphorus, potassium, and sulfur applied post plant.
Nitrogen rates, for non-legumous crops, are yield driven, meaning the higher yielding a crop, the higher amount of N required. Both grain sorghum and sunflower crops, due to neither being legumes, were expected to see N response, especially to those locations that applied little to no N to begin with. A yield response from the addition of N was found in one grain sorghum location, where the producer application was not enough to maximize yield, and the additional N pushed the yields. As expected, there were no soybean locations that responded to the addition of N.
Phosphorus and potassium are both sufficiency based, not yield driven. This means that if the soil is at 100% sufficiency, the crop will produce at its highest rate achievable, based on that nutrient. 100% sufficiency for P and K are approximately 65 STP and 250 STK, respectively. Phosphorus and potassium strips yielded the most results, especially in soybean locations. Of 20 responses, five responses were due to P, ten due to K, and four due to S. Locations that responded to the addition to P were locations that either had low levels of STP (approx. 80% sufficiency or less), or had low pH, which leads to less availability of P (pH>5.0).
Potassium yielded the most positive results, with ten responsive locations, as well as the most interesting results, with only three sites falling below 100% sufficiency. The other responses were attributed to having low Cl levels (Cl, as in Chloride, which while responses are rare, is a necessary nutrient, and sometimes can lead to losses in yield, especially in sandy environments), as well as drought stress conditions. Potassium has been shown to have a vital role in nutrient uptake and water retention, as it is found to be critical for root growth, and these are displayed highest in crops found in drought like conditions. One hypothesis for the K response is related to root growth. The later planted DC will spend less resources in root development before going reproductive. Soybean is a heavy user of K, combine smaller roots, typically hot drier soils, and high K demand it is not surprising to find this occurrence.
Sulfur, while not wide-spread reported in Oklahoma, has recommendations by OSU built on a yield driven scale. There were four responsive locations found in this project. While one location had low soil test S values there were located areas that received high rainfall events during the growing season, and therefore the response was attributed to leaching of S.
So, after all that, what is the bottom line? Here is our observations:
- Producers maximized yield 75% of the time, with 25% of locations responding to any additional nutrient.
- The 20 responses to additional nutrients occurred across 15 locations, four locations had responses to more than one nutrient
- By nutrient: Note for P and K, due to site variability it was not expected to observe statistic yield increase due to P or K unless soil test was below 70% sufficiency, of which no location had soil test P or K below 70%.
- 38 locations were below 100% sufficiency of phosphorus, with five observed responses
- Seven locations were below 100% sufficiency of potassium, two observed responses. An additional eight locations responded that were not predicted by soil test
- Based on pre-plant soil test there were no sites expected to respond to the addition of Sulfur, 4 locations did respond.
- Soil test results were adequate in correctly identifying locations that would not respond to the addition of nutrients (93.5% accurate), while not as accurate at predicting sites that would respond.
- For K, soil testing was less accurate, as eight of the ten responsive locations had soil test values above 250 soil test K (125 ppm or 100% sufficiency). For this reason, we are currently doing work evaluating K recommendations for soybeans.
This work confirms that of the fields we evaluated, the majority was not yield limited by N, P, K or S. However, as with anything, we have more work to do in order to further refine our recommendations, and always looking to learn more about how to aid producers.
Response to NPKS strips across Oklahoma
From the fall of 2011 to about a week ago one of my grad students, Lance Shepherd, has spent A LOT of time burning up the highways and back roads of Oklahoma. Lance’s project was titled “NPKS Strips in Oklahoma winter wheat”, basically an extension of the N-Rich Strip concept. We wanted to see if we could or would find a response to added nitrogen (N), phosphorus (P), potassium (K), or sulfur (S) fertilizer on top of the farmer’s fertilizer applications. Over the two crop years lance applied NPKS strip on more than 80 fields from the Kansas border to the Red River. Of those 80+ Lance was able to collect, by hand, grain samples from 59 sites. Over the next few weeks I will be sharing some of the juicy tidbits we are gleaming from this fantastic data set.

NPKS applicator. Gandy boxes hold each fertilizer and a pto driven fan blew the fertilizer down the boom.
For the project at every site Lance collected soil samples to 18”, documented soil type and collected producer fertilizer, variety, and field history information. Over the 59 locations there were essentially 236 trials. The yield of each strip (N,P,K, and S) was compared back to a sample collected from the field, referred to as Farmer Practice. Of the 236 comparisons there were a total of 17 positive responses. Of these 17 responses seven were to N, seven to P, three to K, with no responses to S.

N-Rich strip very evident in field west of Alva. N-Rich 70 bu/ac Farmer Practice 38 bu/ac.
We are learning a great deal from these 17 locations. The biggest take home was that in most instances soil test results identified the yield limiting factors. For example of the seven responsive P locations six had either a low soil pH or low soil P index, some both. At only one site was there a response not predicted by soil test. Of all 59 harvested fields more than just six had low P or pH levels however most producers had applied enough fertilizer to reach maximum yield. For nitrogen two items proved to be the most likely reason for loss of yield, under estimated yield goal or environment conducive to N loss. As for the K responses we look at both K and chloride (Cl) as KCl, 0-0-62 potash, was applied in the K strip. Just looking at the soils data K was not low at any of the three sites. However, two sites are in sandy loam soils, which is conducive to Cl deficiencies. The lack of response to S was not surprising as soil tests indicated S was sufficient at all 80 locations were strips were applied. So again what did we learn from these plots, soil testing is key in maximizing yield and profitability and in most of the N responsive sites the N-Rich strip indicated a need for added fertilizer in February.
