Home » Posts tagged 'soil acidity'
Tag Archives: soil acidity

Laboratory evaluation of Liquid Calcium
Liquid calcium products have been around for a long time. The vast majority of these products are either a calcium chloride or chelated calcium base which is now commonly found with the addition of a humic acid, microbial, or micronutrient. Many of these make promises such as “raises your soil pH with natural, regenerative, liquid calcium fertilizers that correct soil pH quickly, efficiently, and affordably!”. From a soil chemistry aspect the promise of adding 3 to 5 gallons of a Ca solution, which is approximately 10% Ca, will raise the soil pH is impossible on a mass balance approach. In this I mean that to increase the pH of an acid soil {soil pH is the ratio of hydrogen (H) and hydroxide (OH) in the soil, and having an acid soil means the concentration of H is greater than that of OH} requires a significant portion of the H+ that is in solution and on soil particle to be converted to OH, or removed from the system entirely.
The blog below walks through the full chemical process of liming a soil but in essence to reduce the H+ concentration we add a cation (positively charged ion) such as Ca or magnesium (Mg) which will kick the H+ of the soil particle and a oxygen (O) donator such as CO2 with ag lime or (OH)2 which is in hydrated lime. Each of these O’s will react with two H’s to make water. And with that the pH increases.
However regardless of the chemistry, there is always a lot of discussion around the use of liquid calcium Therefore we decided to dig into the question with both field and laboratory testing. This blog will walk through the lab portion.
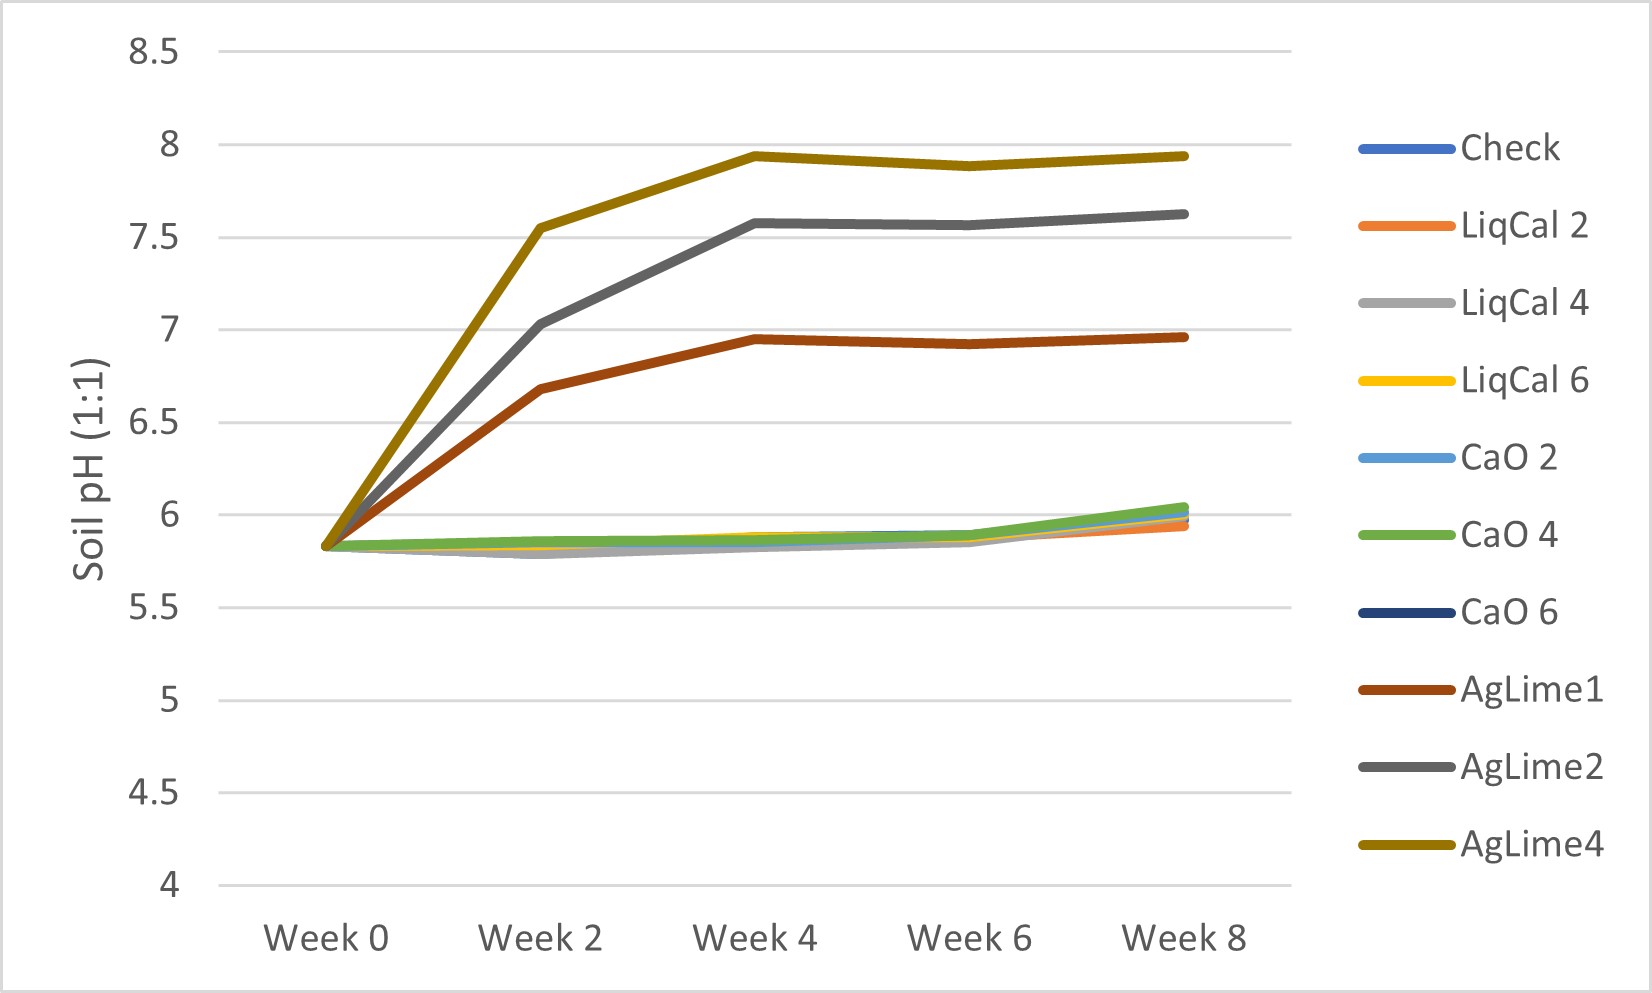
This was a laboratory incubation study. The objective was to evaluation the impact of the liquid Ca product (LiqCa**) on the soil pH, buffer capacity, Ca content and CEC of two acidic soils. LiqCa was applied at three rates to 500 g of soil. The three rates were equivalent to 2, 4, and 6 gallon per acre applied on a 6” acre furrow slice of soil. One none treated check and two comparative products were also applied. HydrateLime (CaO) as applied at rate of Ca equivalent to the amount of Ca applied via LiqCa, which was approximately 1.19 pounds of Ca per acre. Also AgLime (CaCO3) was applied at rates equivalent to 1, 2, and 4 ton effective calcium carbonate equivalency (ECCE). The Ag lime used in the study had a measured ECCE of 92%. The two soils selected for both acidic but had differing soil textures and buffering capacities. The first LCB, had an initial soil pH (1:1 H2O) of 5.3 and a texture of silty clay loam and Perkins had a initial pH of 5.8 and is a sandy loam texture. Both soils had been previously collected, dried, ground, and homogenized. In total 10 treatments were tested across two soils with four replications per treatment and soil.
Project protocol, which has been used to determined site specific liming and acidification rates, was to apply the treatments to 500 grams of soil. Then for a period of eight weeks this soil wetted and mixed to a point of 50% field capacity once a week then allowed to airdry and be mixed again. At the initiation and every two weeks after soil pH was recorded from each treatment. The expectation is that soil pH levels will change as the liming products are impacting the system and at some point, the pH reaches equilibrium and no longer changes. In this soil that point was week six however the trail was continued to week eight for confirmation. See Figures 1 and 2.
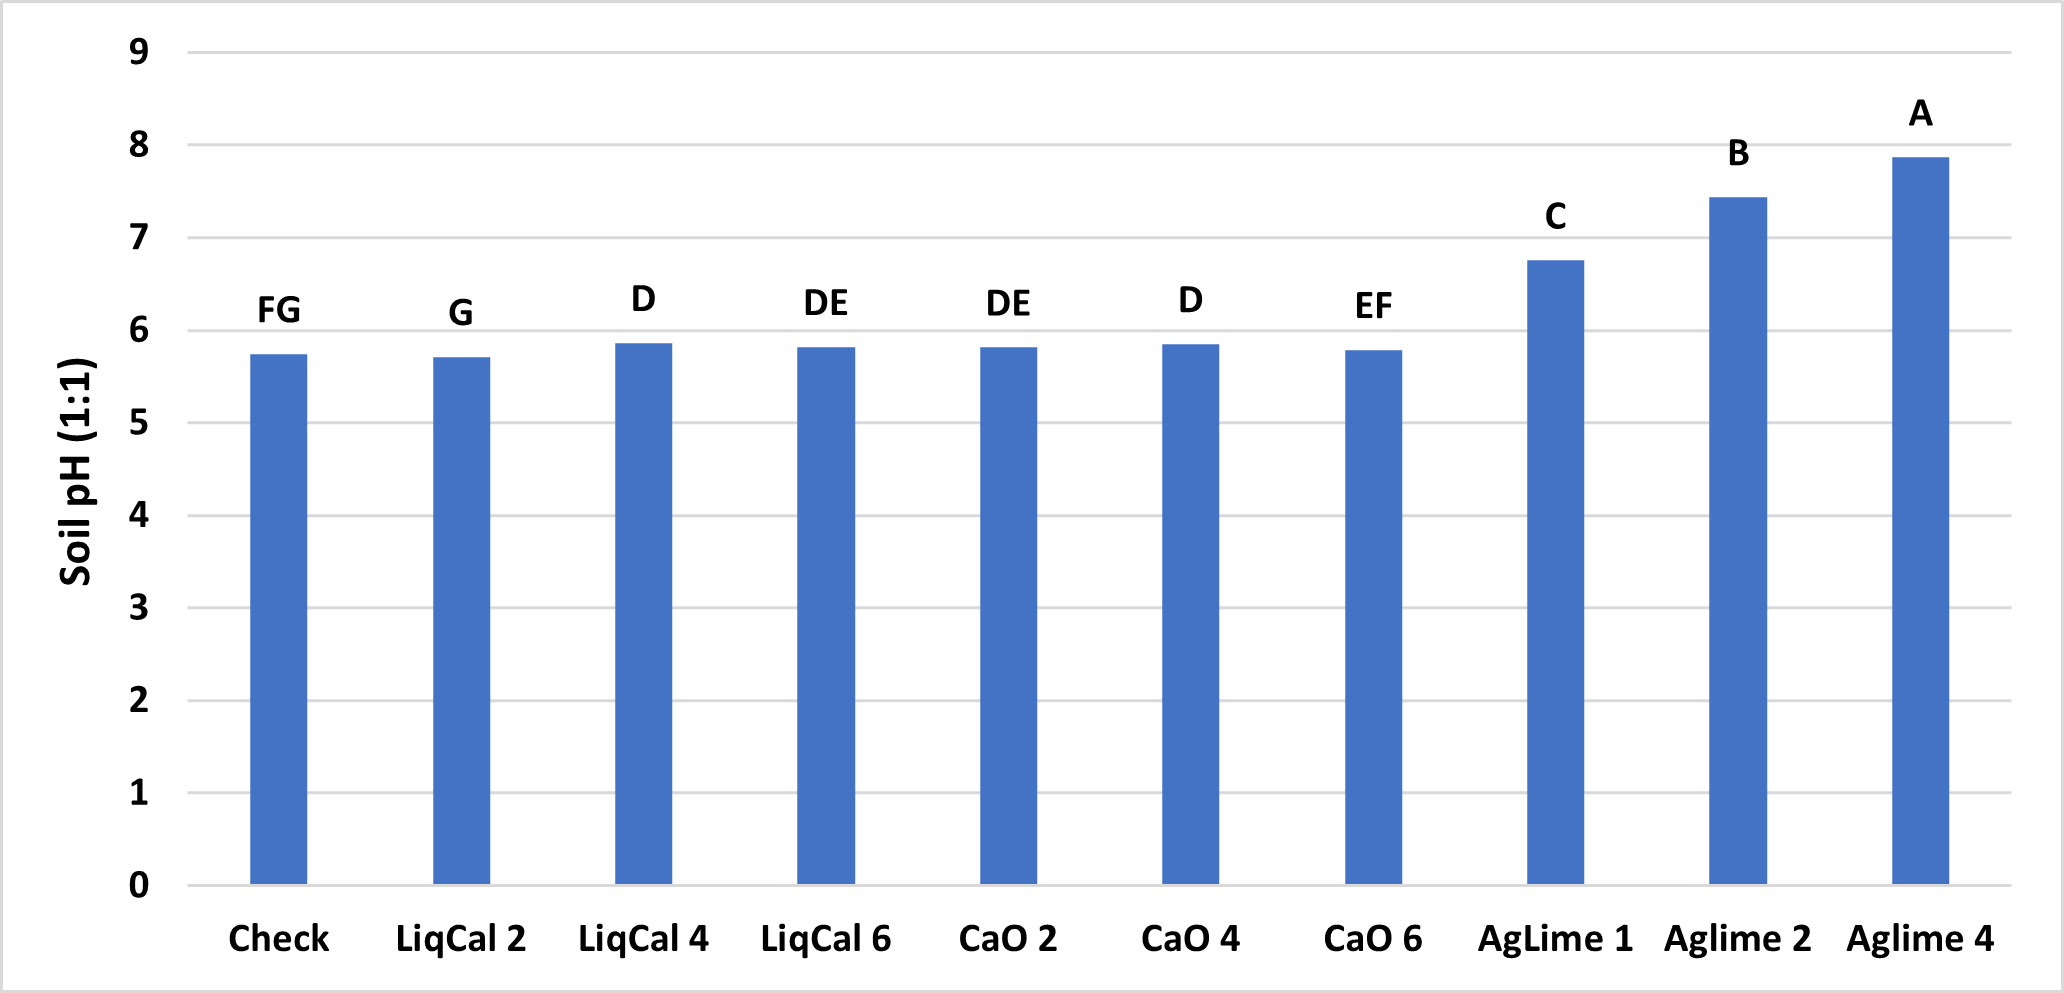
ANOVA Main effect analysis showed that Soil was not a significant effect so therefore both soils were combined for further analysis. Figure 3 shows the final soil pH of the treatments with letters above bars representing significance between treatments. In this study all treatments were significantly greater than the check with exception of LiqCal 2 and CaO 6. Neither LiqCal or CaO treatments reached the pH level of Aglime, regardless of rate.


Summary
The incubation study showed that application of LiqCal at a rate of 4 and 6 gallons per acre did significantly increase the soil pH by 0.1 pH units and 6 gallons per acre increased the Buffer index above the check by 0.03 units. Showing the application of LiqCal did impact the soil. However the application of 1 ton of Ag lime resulted in significantly great increase in soil pH, 1.0 units by 8 weeks and a buffer index change of 0.2 units. The Aglime 1 was statistically greatly than all LiqCal treatments. Ag lime 2 and 4 were both statistically greater than Ag lime 1 with increasing N rate with increasing lime rate. Given the active ingredient listed in LiqCal is CaCl, this result is not unexpected. Ag lime changes pH by the function of CO3 reacting H+ in large quantities. In a unsupported effort a titration was performed on LiqCal, which show the solution was buffered against pH change. However it was estimated that a application of approximately 500 gallons per acre would be needed to sufficiently change the soil pH within a 0-6” zone of soil.
Results of the field study.
https://osunpk.com/2025/06/02/field-evaluation-of-lime-and-calcium-sources-impact-on-acidity/
Take Home
The application of a liquid calcium will add both calcium and chloride which are plant essential nutrients and can be deficient. In a soil or environment suffering from Cl deficiency specifically I would expect an agronomic response. However this study suggest there is no benefit to soil acidity or CEC with the application rates utilized (2, 4, and 6 gallon per acre).
** LiqCal The product evaluated was derived from calcium chloride. It should be noted that since the completion of the study this specific product used has changed its formulation to a calcium chelate. This change however would not be expected to change the results as the experiment did include a equivalent calcium rate of calcium oxide.
Other articles of Interest
https://extension.psu.edu/beware-of-liquid-calcium-products
https://foragefax.tamu.edu/liquid-calcium-a-substitute-for-what/
Any questions or comments feel free to contact me. b.arnall@okstate.edu
Field evaluation of lime and calcium sources impact on Acidity.
At the same time we initiated a lab study looking at the application of LiqCal https://osunpk.com/?p=2096 , we also initiated a field trial to look at the multi-year application of LiqCal, Pelletized Lime and Ag-Lime.
A field study was implemented on a bermudagrass hay meadow near Stillwater in the summer of 2019. The study looked to evaluate the impact of multiple liming / calcium sources impact on forage yield and soil properties. This report will focus on the impact of treatments on soil properties while a later report will discuss the forage results.
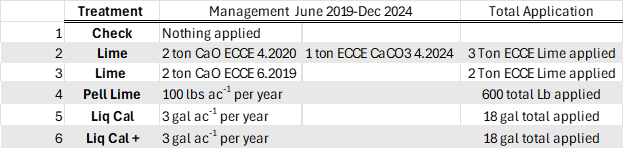
Table 1. has the management of the six treatments we evaluated, all plots had 30 gallons of 28-0-0 streamed on each spring in May. Treatment 1 was the un-treated check. Treatment 2, was meant to be a 2 ton ECCE (Effective Calcium Carbonate Equivalency) Ag Lime application when we first implemented the plots in 2019, but we could not source any in time so we applied 2.0 ton ECCE hydrated lime (CaO) the next spring. The spring 2023 soil samples showed the pH to have fallen below 5.8 so and Ag lime was sourced from a local quarry and 1.0 ton ECCE was applied May 2024. Treatment 3, was meant to complement Treatment 2 as an additional lime source of hydrated lime, it was applied June 2019. My project has used hydrated lime as a source for many years as it is fast acting and works great for research. Treatment 4 had 100 lbs. of pelletized lime applied each spring. The 100 lbs. rate was based upon recommendation from a local group that sells Pell lime. Treatments 5 and 6 were two liquid calcium products *Liq Cal * and **Lig Cal+ from the same company. The difference based upon information shared by the company was the addition of humic acid in the Liq Cal+ product. Both LiqCal and LiqCal+ where applied at a rate of 3 gallons per acre per year, with 17 gallons per acre of water as a carrier. Table 1, also shows total application over the six years of the study.
After six years of applications and harvest it was decided to terminate the study. The forage results were intriguing however little differences where seen in total harvest over the six years, highlighting a scenario I have encountered in the past on older stands of bermuda. That data will be shared in a separate blog.
The soils data however showed exceptionally consistent results.
In February of 2025 soil samples were collected from each plot at depths of 0-3 inch’s and 0-6 inches (Table 2.). It was our interest to see if the soil was being impacted below the zone we would expect lime and calcium to move without tillage, which if 0-3″. Figure 1. below shows the soil pH of the treatments at each depth. In the surface (blue) the Ag Lime and Hydrated lime treatments both significantly increased from 4.78 to 6.13 and 5.7 respectively. While the Pel lime, LiqCal and LiqCal+ had statistically similar pH’s as the check at 4.8, 4.65, and 4.65. It is important to note that the Ag Lime applied in May of 2024 resulted in a significant increase in pH from the 2019 application of Treatment 3. The Spring of 2024 soil samples showed that the two treatments ( 2 and 3 ) were equivalent. So within one year of application the Ag lime significantly raised soil pH.
As expected the impact on the 3-6″ soil pH was less than the surface. However, the Ag Lime and Hydrated lime treatments significantly increased the pH by approximately 0.50 pH units. This is important data as the majority of the literature suggestion limited impact of lime on the soil below the 3″ depth.

The buffer pH of a soil is used to determine the amount of lime needed to change the soils pH. In Figure 2. while numeric differences can be seen, no treatment statistically impacted the buffer pH at any soil depth.

The soil calcium level was also measured. As with 0-3″ pH and Buffer pH the Ag Lime and Hydrated lime had the greatest change from the check. These treatments were not statistically greater than the Pell Lime but where higher than the LiqCal and LiqCal+.
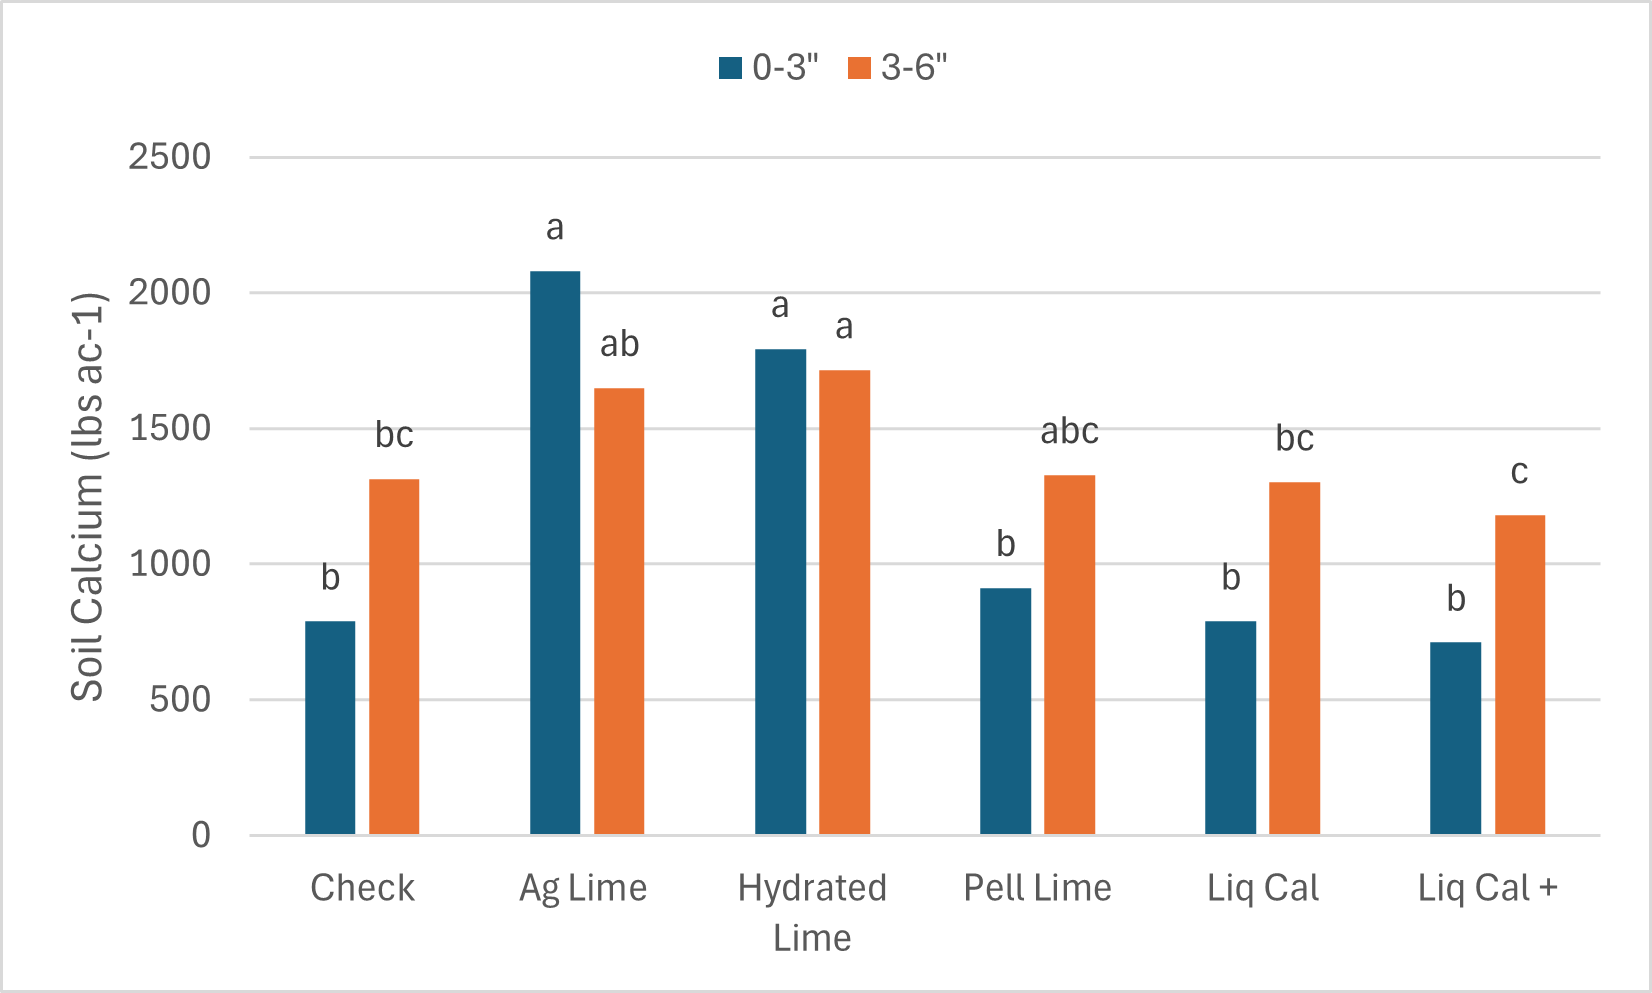

Each value is the average of four replicates.
Take Homes
In terms of changing the soils pH or calcium concentration, as explained in the blog https://osunpk.com/2023/01/24/mechanics-of-soil-fertility-the-hows-and-whys-of-the-things/, it takes a significant addition of cations and oxygens to have an impact. This data shows that after six years of continued application of pelletized lime and two liquid calcium products the soil pH did not change. While the application of 2 ton ECCE hydrate lime did.
Also within one year of application Ag lime the soil pH significantly increased.
* LiqCal The product evaluated was derived from calcium chloride. It should be noted that since the completion of the study this specific product used has changed its formulation to a calcium chelate. This change however would not be expected to change the results as the experiment did include a equivalent calcium rate of calcium oxide.
** LiqCal+ The product evaluated was derived from calcium chloride. It should be noted that since the completion of the study this specific product used has changed its formulation. The base was changed from calcium chloride to a calcium chelate. Neither existing label showed Humic Acid as a additive, however the new label has a a list of nutrients at or below 0.02% (Mg, Zn, S, Mn, Cu, B, Fe) and Na at .032% and is advertised as having microbial enhancements.
Any questions or comments feel free to contact me. b.arnall@okstate.edu
Banding P as a band-aid for soil acidity, not so cheap now.
Whoi Cho, PhD student Ag Economics advised by Dr. Wade Brorsen
Raedan Sharry, PhD Student Soil Science advised by Dr. Brian Arnall
Brian Arnall, Precision Nutrient Management Extension.
In 2014 I wrote the blog Banding P as a Band-Aid for low-pH soils. Banding phosphate to alleviate soil acidity has been a long practiced approach in the southern Great Plains. The blog that follows is a summary of a recent publication that re-evaluated this practices economic viability.
Many Oklahoma wheat fields are impacted by soil acidity and the associated aluminum (Al) toxicity that comes with the low soil pH. The increased availability of the toxic AL3+ leads to reduced grain and forage yields by impacting the ability of the plant to reach important nutrients and moisture by inhibiting root growth. Aluminum can also tie up phosphorus in the soil, further intensifying the negative effects of soil acidity. More on the causes and implication of soil acidity can be found in factsheet PSS-2239 or here (https://extension.okstate.edu/fact-sheets/cause-and-effects-of-soil-acidity.html). The acidification of many of Oklahoma’s fields has left producers with important choices on how to best manage their fields to maximize profit.

Two specific management strategies are widely utilized in Oklahoma to counter the negative impacts of soil acidification: Lime application and banding phosphorus (P) fertilizer with seed. While banding P with seed ties up Al allowing the crop to grow, this effect is only temporary, and application will be required every year. The effects of liming are longer lasting and corrects soil acidity instead of just relieving Al toxicity. Historically banding P has been a popular alternative to liming largely due to the much lower initial cost of application. However, as P fertilizers continue to increase in cost the choice between banding P and liming needed to be reconsidered.
A recent study by Cho et al.,2020 compared the profitability of liming versus banding P in a continuous wheat system considering the impacts that lime cost, wheat price and yield goal has on the comparison. This work compared the net present value (NPV) of lime and banded P. The study considered yield goal level (40 and 60 bu/ac) as well as the price of P2O5 fertilizer and Ag Lime. The price of P2O5 used in this study was $0.43 lb-1 while lime price was dictated by distance from quarry, close to quarry being approximately $43 ton-1 and far being $81 ton-1. For all intents and purposes these lime values are equivalent to total lime cost including application. Wheat prices utilized in the study were $5.10 bu-1 and $7.91 bu-1. It is important to note that baseline yield level was not considered sustainable under banded P management in this analysis. This resulted in a decrease in yield of approximately 3.2 bu ac-1 per year. This is attributable to the expected continued decline in pH when banding P is the management technique of choice.
The analysis in this work showed that lime application is cost prohibitive in the short term (1 year) when compared with banding P regardless of lime cost, yield goal level, and wheat value (within the scope of this study). This same result can be seen over a two-year span when yield is at the lower level (40 bu ac-1). While in the short-term banding P was shown to be a viable alternative to liming, as producers are able to control ground longer lime application becomes the more appealing option, especially when producers can plan for more than 3 years of future production. In fact, under no set of circumstances did banding P provide greater economic return than liming regardless of crop value, yield, or liming cost when more than 3 years of production were considered and only under one scenario did banded P provide a higher NPV in a 3-year planning horizon.
While historically banding P was a profitable alternative to lime application for many wheat producers the situation has likely drastically changed. At the time of writing this blog (09/17/2021) Diammonium Phosphate (DAP) at the Two Rivers Cooperative was priced at $0.78 lb-1. of P2O5. This is a drastic increase in P cost over the last year or so since Cho et al. was published in 2020. With P fertilizer prices remaining high it will be important for producers to continue to consider the value of liming compared to banded P. This is particularly crucial for those producers who can make plans over a longer time frame, especially those more than 3 years.
Addendum: As fertilizer prices have continued to rise a quick analysis utilizing the $0.78 lb-1 of P2O5was completed to consider the higher P fertilizer cost. Under this analysis an estimated decrease in NPV of approximately $38 an acre for P banding occurred. When considering this change in NPV, lime application becomes the more profitable option for alleviation of soil acidity symptoms even in the short term (assuming lime price values are equivalent to the previous analysis). This underlines the fact that it is imperative to consider the impact on profitability of the liming vs. banding P decision in the current economic climate for agricultural inputs.
Link to the Open Access Peer Reviewed publication “Banding of phosphorus as an alternative to lime for wheat in acid soil” https://doi.org/10.1002/agg2.20071
