Home » Posts tagged 'phosphorus'
Tag Archives: phosphorus

Double Crop Options After Wheat (KSU Edition)
Stolen from the KSU e-Update June 5th 2025.
Double cropping after wheat harvest can be a high-risk venture for grain crops. The remaining growing season is relatively short. Hot and/or dry conditions in July and August may cause problems with germination, emergence, seed set, or grain fill. Ample soil moisture this year can aid in establishing a successful crop after wheat harvest. Double-cropping forages after wheat works well even in drier regions of the state.
The most common double crop grain options are soybean, sorghum, and sunflower. Other possibilities include summer annual forages and specialized crops such as proso millet or other short-season summer crops, even corn. Cover crops are also an option for planting after wheat (see the companion eUpdate article “Cover crops grown post-wheat for forage”).
Be aware of herbicide carryover potential
One major planting consideration after wheat is the potential for herbicide carryover. Many herbicides applied to wheat are Group 2 herbicides in the sulfonylurea family with the potential to remain in the soil after harvest. If a herbicide such as chlorsulfuron (Glean, Finesse, others) or metsulfuron (Ally) has been used, then the most tolerant double crop will be sulfonylurea-resistant varieties of soybean (STS, SR, Bolt) or other crops. When choosing to use herbicide-resistant varieties, be sure to match the resistance trait with the specific herbicide (not only the herbicide group) that you used. This is especially true when looking at sunflowers as a double crop. There are sunflowers with the Clearfield trait, which allows Beyond herbicide applications, and ExpressSun sunflowers, which allow an application of Express herbicide. While both of these herbicides are Group 2 (ALS-inhibiting herbicides), the Clearfield trait and ExpressSun are not interchangeable, and plant damage can result from other Group 2 herbicides.
Less information is available regarding the herbicide carryover potential of wheat herbicides to cover crops. There is little or no mention of rotational restrictions for specific cover crops on the labels of most herbicides. However, this does not mean there are no restrictions. Generally, there will be a statement that indicates “no other crops” should be planted for a specified amount of time, or that a bioassay must be conducted prior to planting the crop.
Burndown of summer annual weeds present at planting is essential for successful double-cropping. Assuming glyphosate-resistant kochia and pigweeds are present, combinations of glyphosate with products such as saflufenacil (Sharpen) or tiafenacil (Reviton), or alternative treatments such as paraquat may be required. Dicamba or 2,4-D may also be considered if the soybean varieties with appropriate herbicide resistance traits are planted. In addition, residual herbicides for the double crop should be applied at this time.
Management, production costs, and yield outlooks for double crop options are discussed below.
Soybeans
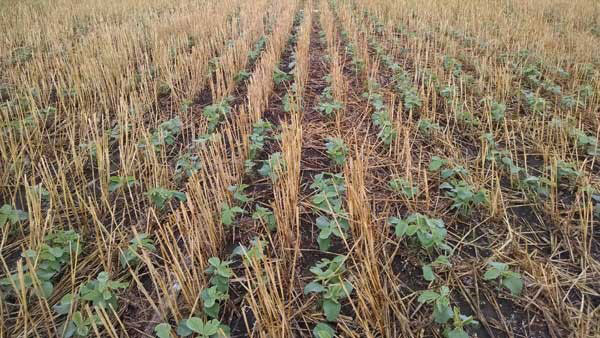
Soybeans are likely the most commonly used crop for double cropping, especially in central and eastern Kansas (Figure 1). With glyphosate-resistant varieties, often the only production cost for planting double crop soybeans was the seed, an application of glyphosate, and the fuel and equipment costs associated with planting, spraying, and harvesting. However, the spread of herbicide-resistant weeds means additional herbicides will be required to achieve acceptable control and minimize the risk of further development of resistant weeds.
Weed control. The weed control cost cannot really be counted against the soybeans, since that cost should occur whether or not a soybean crop is present. In fact, having soybeans on the field may reduce herbicide costs compared to leaving the field fallow. Still, it is recommended to apply a pre-emergence residual herbicide before or at planting time. Later in the summer, a healthy soybean canopy may suppress weeds enough that a late-summer post-emergence application may not be needed.
Variety selection for double cropping is important. Soybeans flower in response to a combination of temperature and day length, so shifting to an earlier-maturing variety when planting late in a double crop situation will result in very short plants with pods that are close to the ground. Planting a variety with the same or perhaps even slightly later maturity rating (compared to soybeans planted at a typical planting date) will allow the plant to develop a larger canopy before flowering. Planting a variety that is too much later in maturity, however, increases the risk that the beans may not mature before frost, especially if long periods of drought slow growth. The goal is to maximize the length of the growing season of the crop, so prompt planting after wheat harvest time is critical. The earlier you can plant, the higher the yield potential of the crop if moisture is not a limiting factor.
Fertilizer considerations. Adding some nitrogen (N) to double-crop soybeans may be beneficial if the previous wheat yield was high and the soil N was depleted. A soil test before wheat harvest for N levels is recommended. Use no more than 30 lbs/acre of N. It would be ideal to knife-in the fertilizer. If that is not possible, banding it on the soil surface would be acceptable. Do not apply N in the furrow with soybean seed as severe stand loss can occur.
Seeding rates and row spacing. Seeding rate can be slightly increased if soybeans are planted too late in order to increase canopy development. Narrow row spacing (15-inch or less) has often resulted in a yield advantage compared to 30-inch rows in late plantings. Soybeans planted in narrow rows will canopy over more quickly than in wide rows, which is important when the length of the growing season is shortened. Narrow rows also offer the benefits of increasing early-season light capture, suppressing weeds, and reducing erosion. On the other hand, the advantage of planting in wide rows is that the bottom pods will usually be slightly higher off the soil surface to aid harvest. The other consideration is planting equipment. Often, no-till planters will handle wheat residue better and place seeds more precisely than drills, although the difference has narrowed in recent years.
What are typical yield expectations for double-crop soybeans? It varies considerably depending on moisture and temperature, but yields are usually several bushels less than full-season soybeans. A long-term average of 20 bushels per acre is often mentioned when discussing double-crop soybeans in central and northeast Kansas. Rainfall amount and distribution can cause a wide variation in yields from year to year. Double-crop soybean yields typically are much better as you move farther southeast in Kansas, often ranging from 20 to 40 bushels per acre.
A recent publication explores the potential yield of double-crop soybeans relative to full-season yield (Figure 2) and the most limiting factors affecting the yields for double-crop soybeans. The link to this article is: https://bookstore.ksre.ksu.edu/pubs/MF3461.pdf.

Grain Sorghum
Grain sorghum is another double crop option. Unlike soybeans, sorghum hybrids for double cropping should be earlier maturing hybrids. Sorghum development is primarily driven by the accumulation of heat units, and the double crop growing season is too short to allow medium-late or late hybrids to mature before the first frost in most of Kansas.
Seeding rates and row spacing. Late-planted sorghum likely will not tiller as much as early plantings and can benefit from slightly higher seeding rates than would be used for sorghum planted at an earlier date. Narrow row spacing is advised, especially if the outlook for rainfall is good.
Fertilizer considerations. A key component for the estimation of N application rates is the yield potential. This will largely determine the N needs. It is also important to consider potential residual N from the wheat crop. This can be particularly important when wheat yields are lower than expected. In that situation, additional available N may be present in the soil. Assess the amount of profile N by taking soil samples at a depth of 24 inches and submitting them for analysis at a soil testing laboratory.
Double crop sorghum planted into average or greater-than-average amounts of wheat residue can result in a challenging amount of residue to deal with when planting next year’s crop. Nitrogen fertilizer can be tied up by wheat residue, so use application methods to minimize tie-up, such as knifing into the soil below the residue.
Weed control. Weed control can be important in double-crop sorghum. Warm-season annual grasses, such as crabgrass, can reduce double-crop sorghum yields. Using a chloroacetamide-and-atrazine pre-emergence product may be key to successful double-crop sorghum production. Herbicide-resistant grain sorghum varieties will allow the use of imazamox (Imiflex in igrowth sorghums) or quizalofop (FirstAct in DoubleTeam grain sorghum) that can control summer annual grasses.
No-till studies at Hesston documented 4-year average double crop sorghum yields of 75 bushels per acre compared to about 90 bushels per acre for full-season sorghum. A different 10-year study that did not have double crop planting but did compare early- and late-planting dates averaged 73 bushels per acre for May planting vs. 68 bushels per acre for June planting.
Sunflowers
Sunflowers can be a successful double crop option anywhere in the state, provided there is enough moisture at planting time to get a stand. Sunflowers need more moisture than any other crop to germinate and emerge because of the large seed. Therefore, stand establishment is important. Planting immediately after wheat harvest on a limited irrigation field can be a good fit to help with stand establishment.
Seeding rates and hybrid selection. When double-cropping sunflowers, producers should use similar seeding rates to what is typical for the area for full-season sunflowers. While full-season sunflowers can be successful in double-crop production, utilizing shorter-season hybrids can increase the likelihood of the sunflowers blooming and maturing before a killing frost.
Weed control. First, it is important to check the herbicide applications on the wheat. The rotation restriction to sunflowers after several commonly used wheat herbicides is 22-24 months.
Weed control can be an issue with double-crop sunflowers since herbicide options are limited, especially post-emergence. Thus, controlling weeds prior to sunflower planting is critical and may be complicated pre-plant restrictions for some herbicides. Planting Clearfield or ExpressSun sunflowers will provide additional post-emergence herbicide options, but ALS-resistant kochia and pigweeds still won’t be controlled. Imazamox (Beyond in Clearfield sunflower) has activity on small annual grasses as well as many broadleaf weeds, if they are not ALS-resistant.
Summer annual forages
With mid-July plantings, and where herbicide carryover issues are not a concern, summer annual sorghum-type forages are also a good double crop option. A study planted July 21, 2008 near Holton, when summer rainfall was very favorable, provided yields of 2.5 to 3 tons dry matter/acre for hybrid pearl millet and sudangrass at the low end to 4 to 5 tons dry matter/acre for forage sorghum, BMR forage sorghum, photoperiod sensitive forage sorghum, and sorghum x sudangrass hybrids. Earlier plantings may produce even more tonnage, as long as there is adequate August rainfall.
One challenge with late-planted summer annual forages is getting them to dry down when harvest is delayed until mid- to late-September. Wrapping bales or bagging to make silage are good ways to deal with the higher moisture forage this late in the year.
Corn
Is double-crop corn a viable option? Corn is typically not recommended for late June or July plantings because yield is usually substantially less than when planted earlier.
Typically, mid-July planted corn struggles during pollination and seldom receives sufficient heat units to fill grain before frost. Very short-season corn hybrids (80 to 95 RM) have the greatest chance of maturing before frost in double crop plantings, but generally have less yield potential when compared to hybrids of 100 RM or more used for full-season plantings. Short-season hybrids often set the ear fairly close to the ground, increasing the harvest difficulty. Glyphosate-resistant hybrids will make weed control easier with double crop corn, but problems remain present with late-emerging summer weeds such as pigweeds, velvetleaf, and large crabgrass. Keep in mind, corn is very susceptible to carryover of most residual ALS herbicides used in wheat.
Considerations for altering seeding rates and variety/hybrid maturity for the crops discussed above are summarized in Table 1.
Table 1. Seeding rate and variety/hybrid relative maturity considerations for double crops compared to full-season.
| Crop | Seeding rate | Relative maturity |
| ???????? Difference between double crop and full-season ???????? | ||
| Soybean | Increase | No change or longer |
| Sorghum | Increase | Shorter |
| Sunflower | No change | Shorter |
| Corn | No change | Shorter |
Volunteer wheat control
One of the issues with double cropping that is often overlooked by producers is the potential for volunteer wheat in the crop following wheat. If volunteer wheat emerges and goes uncontrolled, it can cause serious problems for nearby wheat fields in the fall as a host for the wheat streak mosaic complex of viruses [wheat streak mosaic (WSMV), High Plains disease (HPD), and triticum mosaic (TriMV)] that are transmitted by the wheat curl mite (WCM).
Volunteer wheat can generally be controlled fairly well with glyphosate or Group 1 herbicides such as quizalofop (Assure II, others), clethodim (Select Max, others), or sethodydim (Poast Plus, others), but control is reduced during times of drought stress. Atrazine can provide control of volunteer wheat in double-crop corn or sorghum, but control can be erratic depending on rainfall patterns.
For more detailed information about herbicides, see the “2025 Chemical Weed Control for Field Crops, Pastures, and Noncropland” guide available online at https://www.bookstore.ksre.ksu.edu/pubs/CHEMWEEDGUIDE.pdf or check with your local K-State Research and Extension office for a paper copy. The use of trade names is for clarity to readers and does not imply endorsement of a particular product, nor does exclusion imply non-approval. Always consult the herbicide label for the most current use requirements.
To Subscribe to the KSU Agronomy E-Updates follow this link
https://eupdate.agronomy.ksu.edu/index_new_prep.php
Authors contributing to the post
Sarah Lancaster, Weed Management Specialist
slancaster@ksu.edu
John Holman, Cropping Systems Agronomist
jholman@ksu.edu
Logan Simon, Southwest Area Agronomist
lsimon@ksu.edu
Tina Sullivan, Northeast Area Agronomist
tsullivan@ksu.edu
Jeanne Falk Jones, Multi-County Agronomist
jfalkjones@ksu.edu

Did in-furrow starter products increase yields?
Bronc Finch, Precision Nutrient Management Post-Doctorial Scientist.
Brian Arnall, Precision Nutrient Management Specialist.
As winter wheat planting time approaches this question arises often when fertilizer decisions are being made. There are several products that have been marketed to wheat producers that contain combinations of nitrogen (N), phosphorus (P), and potassium (K) as well as some plant essential micro-nutrients. These products are designed to be placed with the seed as an in-furrow application at planting and provide nutrients earlier in the season than traditional dry spreading methods. While the state of Oklahoma macro-nutrient deficiencies are often corrected with traditional fertilizing methods and micro-nutrient deficiencies are not commonly witnessed in winter wheat; these products are often sold with the expectation yield increases can still occur. This has led to the question can these fertilizer products improve winter wheat yield production regardless of soil analysis results? To answer this Oklahoma State University developed a study evaluating eleven different starter fertilizer options available to producers (Table 1). Of these eleven fertilizer options three are commonly available fertilizers, and eight of them are products available through specific companies. The study was carried out at three locations a year for two years.

To compare the ability of these products to increase yield beyond the recommendation of soil test results, pre-plant soil samples were collected to a 6-inch depth at each of these research sites. Soil analysis of the five-site years used in this evaluation (Table 2) reported no deficiency at the Lake Carl Blackwell research farm. Deficient concentrations of P (< 32.5 ppm) was recorded at the North 40 research site and Perkins research station, along with a low pH (4.8) at the Perkins research station. Acidic soils are of concern for crop production having many detrimental impacts to root production, however there is also influence on nutrient availability. Aluminum concentrations are often higher in low pH soils which will result in root pruning and the binding of applied P, increasing the concerns when soil analysis P concentrations are already deficient.

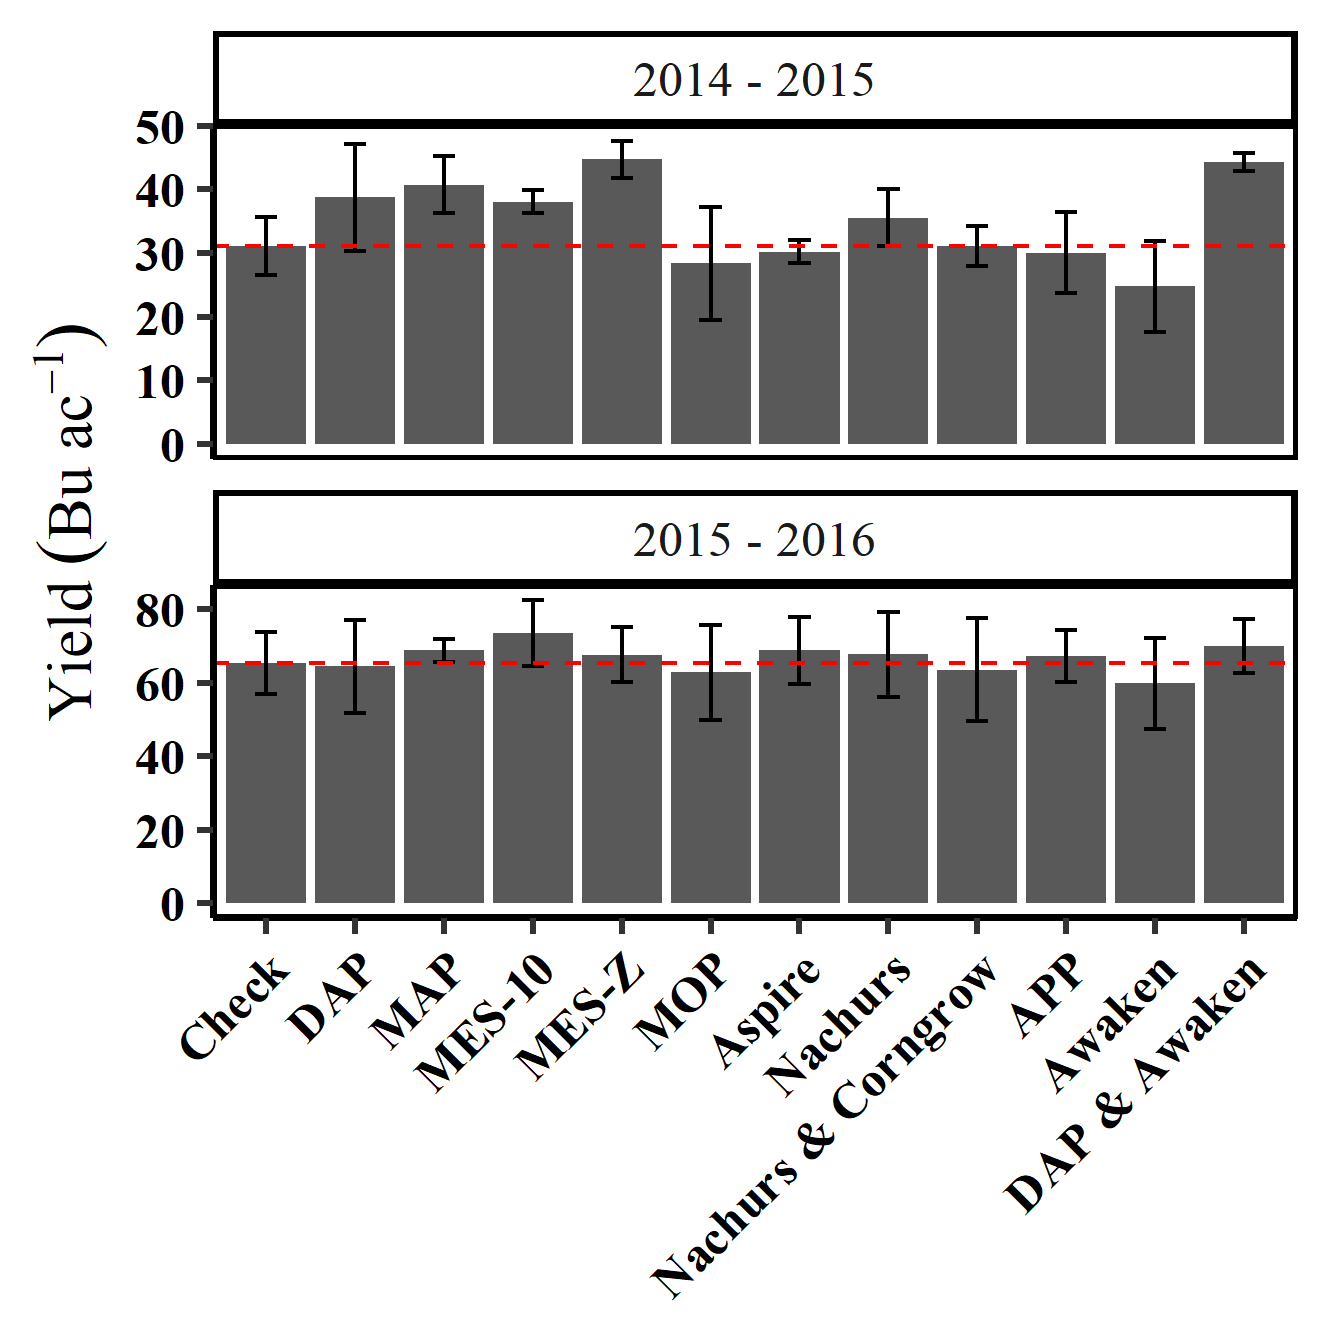
Evaluation of these commercially available products at non-nutrient deficient sites show no influence of any in-furrow placed fertilizer product on winter wheat grain yield compared to an unfertilized check, yielding an average of 52 bu ac-1 in 2014-2015, and 93 bu ac-1 in 2015-2016 (Figure 1). Figure 1, along with the following figures, show the mean and variability of winter wheat grain yield of each of the commercially available starter fertilizer product treatments, as well as the check treatment which received no fertilizer application. The column for each treatment represents the grain yield in bu ac-1 which is the average of three replications the variability of grain yield at an individual treatment can be observed by the error bars which depict the range of grain yields within a specific treatment. The larger the error bar the less consistent the yield and the harder it is to separate out statistical differences in yield.

When the soil test P level was below 32.5 ppm, some P containing starter fertilizers where able to increase winter wheat grain yield in 2014-2015 growing season at North 40. Products containing 40 – 52% P; MAP, DAP + Awaken and MES-Z, improved grain yield by up to 14 bu ac-1 compared to the check. At the North 40 locations APP did not show the same increase in yields as DAP and MAP. The addition of micro-nutrients by Awaken combined with DAP yielded a 20 bu ac-1 increase over Awaken used alone, but no increase compared to DAP or MAP used alone. Similarly, the addition of Zinc by MES-Z yielded similar to the base product, MAP.
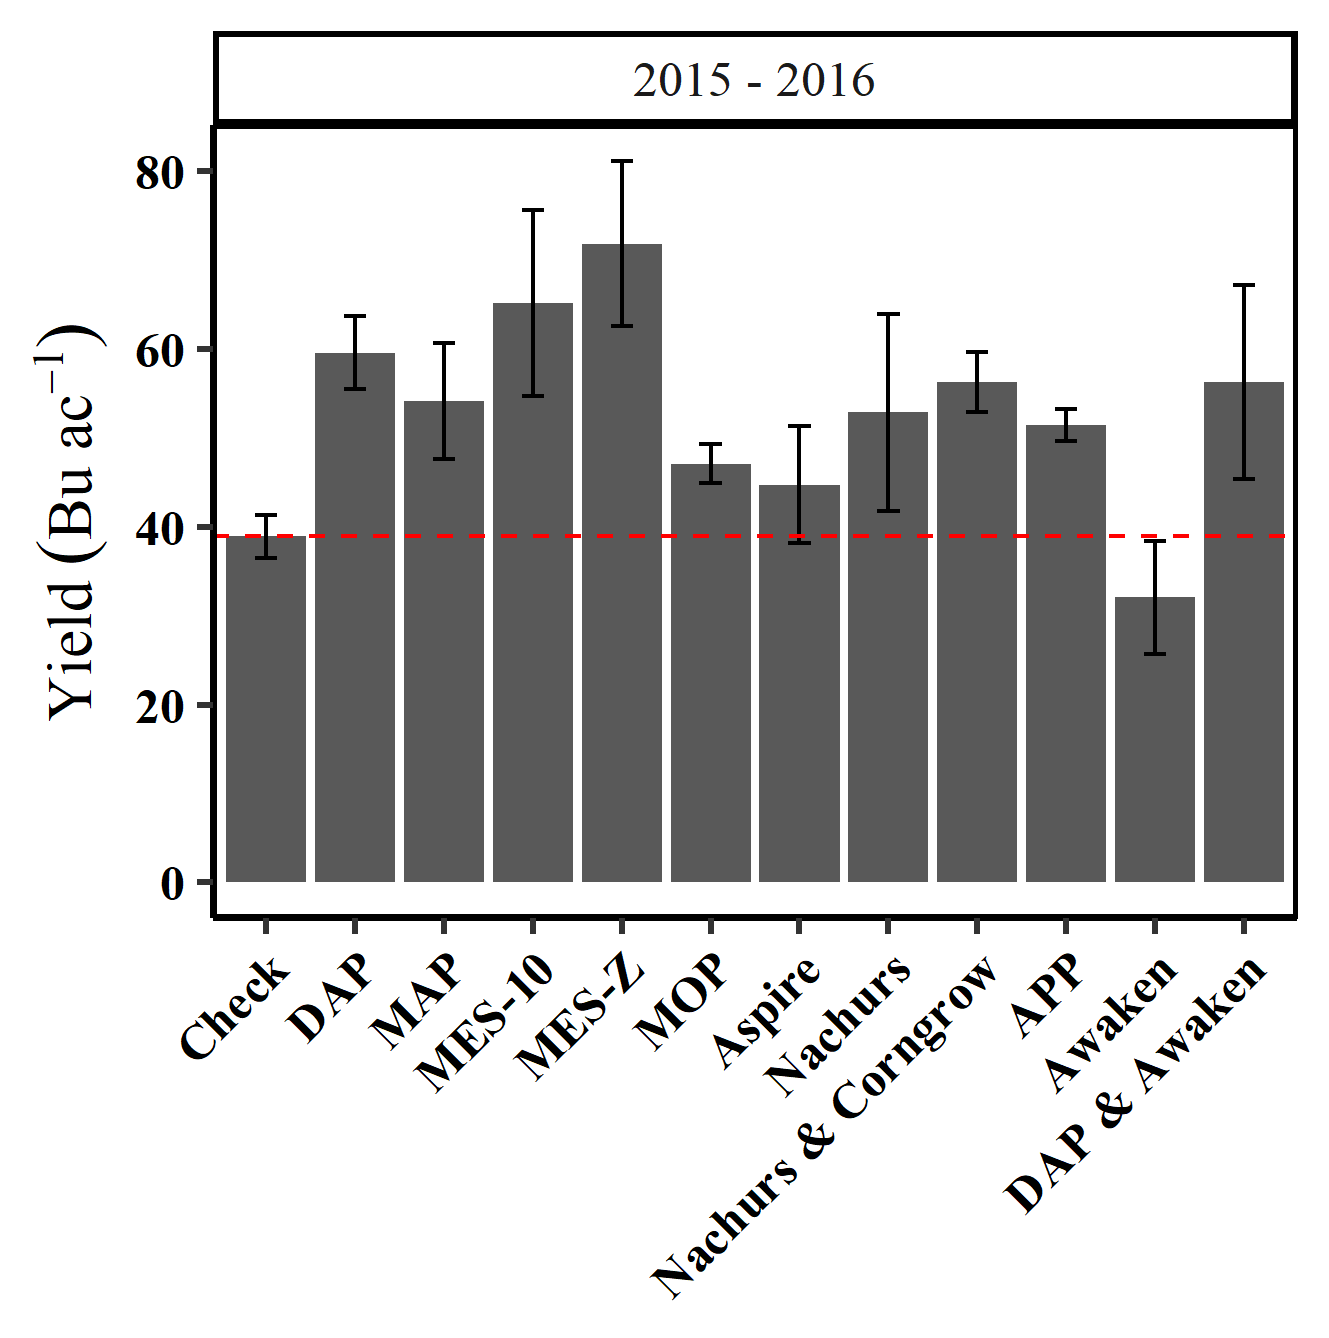
When P deficiency was compounded by a low pH such as observed at Perkins there was response to more in-furrow products. Compared to the check, increases up to 32 bu ac-1 in winter wheat grain yield was found by DAP, MES-10, MES-Z, Nachurs + CornGrow, and DAP + Awaken. Further investigation revealed the source of P fertilizer (DAP, MAP, and APP) reported no difference in yield averaging 55 bu ac-1. The addition of S and K by Nachurs was not different from APP, which is a similar liquid fertilizer, averaging 52 bu ac-1. Micro-nutrient additions by Awaken combined with DAP (56 bu ac-1), and by CornGrow combined with Nachurs (56 bu ac-1) did not increase winter wheat grain yield compared to each other or their respective base products of DAP (59 bu ac-1) and Nachurs (53 bu ac-1). Similarly, additions of S by MES-10 and S and Zn by MES-Z yielded similar to one another with 65 and 72 bu ac-1respectively but produced 14 bu ac-1 more yield on average than the base product MAP. At Perkins, which is a well-drained sandy loam soil, we often see a yield response to S when yield levels so seeing a response to the products that added 7 lbs of S, was not un-expected.
With these results in mind and the current cost of fertilizers, the addition of fertilizer products on non-limiting soils is not expected to result in an increase in winter wheat grain yield. Also, many of these products contain micro-nutrients that are rarely found to be at deficient levels for much of the winter wheat production region in Oklahoma. Therefore, the use of these products on non-nutrient limiting soils would unnecessarily increase the cost of production and decrease the return on investment. However, that is not to say these products should be avoided completely, in the event of a nutrient limiting soils some products show potential benefit for correct soil deficiencies. As observed some P containing products were able to provide adequate P concentrations for increasing yields and overcoming low pH conditions. This work along with previous work evaluating efficient fertilizer management suggest the correction of a nutrient deficient soil to be more important than the source of the nutrients and supports the need for soil testing and following recommendations.
This blog is a summation of Mr. Jonathon Williams thesis which was published in the Journal of Agricultural Sciences. Impact of in-furrow fertilizer on winter wheat grain yield and mineral concentration https://doi.org/10.1017/S0021859622000557
SIDEBAR
So we do small plot research to me in control of as many variables as possible. But all farmers and consultants know that fields are are variable and the results of small plots do not always translate well. I get that 100%, but for me as a scientist I need to understand the little things so that I can apply the knowledge on a large scale. Just last month I wrote a blog about cutting phosphorus rates BLOG. The third major take home of the blog was:
A composite soil sample is an AVERAGE of the field. If your average is right at the ok level (pH of 5.6ish and M3P of 30 ppm), then half of your field is below optimum and will benefit from P.“
That applies to what we learned from the above study. We found if soil test said nutrient was adequate we did not see a response of adding more. However if we combine the two blogs, if your composite soil test comes back just at the optimum level, there is a good chance at least 45% of field is below optimum and may respond.
So guess what my recommendation is. Soil SAMPLE, do it right (proper method and core numbers) and do it at the highest resolution you can afford, at least once.
Finally Do Not Skip on Nutrients when soil test says there is a need.
BA
Any questions or comments feel free to contact me. b.arnall@okstate.edu
Phosphorus decisions, Is it worth cutting P?
With the current conditions and input cost many wheat producers are considering cutting back on inputs. I can’t disagree with the plan, but I would caution against what you cut. If you have read any of my past blogs, or seen me speak, you should know I’m all for cutting back on pre-plant nitrogen (N). Based on some recent trials I would not argue cutting the potassium (K) side, but phosphorus (P) that’s another story that we will walk through in this blog.
First and foremost, soil testing is the key to P management. If your soil test is below the critical threshold for the test you use, 32.5 for Mehlich 3 (M3P), then you need to add phos. We have enough work that shows current recommendations work for P in wheat. Reeds paper Evaluation of incorporated phosphorus fertilizer recommendations on no-till managed winter wheat Link to Paper goes over soil test recommendations in no-till and the recent double crop soybean project Double Crop P and K Blog highlights the importance of P fertility, regardless of yield level. Also if your soil test is below a 5.5 and you haven’t limed (Liming is the best solution, Band-aids not so cheap Blog ), then the next best option is adding additional P to alleviate the aluminum toxicity Band-aids for low pH Blog. In-short if the fields soil test P and or pH is below optimum you should not forgo P application.
But the primary reason I am writing this blog is for those looking at fields with composite soil test that is right around the critical thresholds, and they are trying to make the call on to apply P or not to apply P. Even on fields with soil test values in the good level, I am usually in favor of banding in-furrow fertilizer wheat, but not because of the same reasons I am for corn. With corn you are planting in cool soils and the availability of nutrients like P is lower in cool wet soils. For wheat cold soil isn’t the concern until we reach the end of the planting window. It will serve as a bit of a “pop-up” as the crop comes out of dormancy in the spring. I have also seen little to no value of N applied in furrow. I see same response to DAP (18-46-0), MAP (11-52-0), and TSP (0-46-0) when all applied at same rate of P. Meaning it was the P not N making the difference.
For me the reason I still recommend getting a little phosphate out even when the soil test comes back is that the great majority of fields have a large range of variability. Looking at a set of 650 grid sampled fields across Oklahoma and Kansas it showed on average soil pH 6.0 and M3P was 34 ppm. Both pH and P are at adequate/optimum levels. However, the average is usually somewhere between the low and high point and in this data set and the range of soil pH was 1.8 units and the range in M3P was 67 ppm. That meant on average of the 648 field with pH values the average difference between low pH and high pH was 1.8 units and the difference between low P and high P was 64 ppm.

The field below is from Kingfisher county and was sampled at a resolution of 10 acres per sample. This is a fairly course resolution for grid sampling but provides a great view of how variable our soils can be. The field average pH is 5.3, which is below optimum but our aluminum tolerant wheats would be able to handle fairly well. For the P the average is 22 ppm which needs about 18 lbs of P2O5 to max yields. If the farmer applied a flat rate of 20 lbs there would be significant forage loss on about 65% of the field, for grain only about 45% of the field due to underapplication of P. Note that low P and low pH are not correlated well, meaning the areas low in pH are not always low in P.

Banding P makes it more efficient because it slows the rate of tie. However, we have plenty data that says broadcast applied P is still a great option, even after planting. So what are my take homes from this blog?
First: If you are grazing wheat get down 40-50 lbs of N pre. But I have plenty of data the pre-plant N on grain only wheat is not needed. I have the same amount of data that shows the only value of in-furrow N for grain only is that it forces you to plant more seeds, because it just lowers stand.
Second: When it comes to wheat pay attention to Phosphorus and soil pH. Even our acid tolerant wheats preform better in neutral soil pHs, especially forage wise.
Third: A composite soil sample is an AVERAGE of the field. If your average is right at the ok level (pH of 5.6ish and M3P of 30 ppm), then half of your field is below optimum and will benefit from P.
Fourth: If you can band P great, but if you cant broadcast is still a viable option. Do Not Skip P when soil test says there is a need.
Questions or comments please feel free to reach out.
Brian Arnall b.arnall@okstate.edu

Top-dress Wheat with P and K ??
Brian Arnall, Precision Nutrient Management Extension Specialist
Hunter Lovewell, Past PNM MS student.
Original Blog Name: Managing P and K in a wheat Double-crop Soybean System.
I planned to wait until the soybean yields came in to share the data from this project, but the wheat results are just too interesting this year.
So the trial posed the question, when is the best time to apply the phosphorus (P) and potassium (K) for the soybean crop in a wheat double crop soybean system, if any is needed above what is applied for the wheat crop. We applied the wheat’s P&K at establishment, but the soybeans P&K was applied either at wheat establishment, top-dress wheat timing, or post wheat harvest pre soybean planting. We used the sources of granular triple super phosphate (0-46-0) and potash (0-0-60) for all applications. We hypothesized the wheat crop would not benefit from the soybeans portion of P&K and that the top-dress application timing for the soybeans P&K would result in the greatest soybean yields.

So far, we have six site years with completed cycles with locations at the Eastern Research Station (ERS) near Haskell, Oklahoma, Ballagh Family Research Farm (BF) near Newkirk, Oklahoma, Skagg Family Farm (SF) near Lamont, Oklahoma, and Lake Carl Blackwell Research Farm (LCB) near Perry, Oklahoma. The research was conducted during the 2019-2020 growing season and the 2020-2021 growing season. For the 2021-2022 cycle we added two more locations one again on the Skagg Family farm and the second on a new cooperator, O’Neil Farms (OF) near Ponca City. For all locations no P or K was applied by the farmers at any point, but they did manage IPM. See location descriptions below.

The first two years of work is written up in Mr. Hunter Lovewell’s thesis titled “EFFECTS OF PHOSPHOROUS AND POTASSIUM APPLICATION TIMING ON A WHEAT DOUBLE-CROP SOYBEAN SYSTEM” which I can share with those interested. To be honest, Hunter had a couple tough seasons. Basically where wheat did well, beans typically failed and where you had good beans the previous wheat had failed. All the same he had some interesting results. What follows is pulled from his conclusions.
“While a significant response to the application of P and K was limited, the results show that there are environments in which the wheat crop can benefit from additional P and K fertilizer applied for the soybean crop. In the case of the soil (SF-SH) with low M3P and an acidic soil pH, the additional P applied during the winter wheat growing season, intended for soybeans, alleviated the aluminum toxicity issues with acidic pH, increasing wheat yields. Beyond the single location with low soil test P and pH no other significant response was found to the addition of and P. This may be explained in that most locations were only marginally deficient P and the majority of the varieties used in the study were considered to have acid soil tolerance. Penn and Arnall (2015) found that cultivars with aluminum tolerance had increased P use efficiency. The BF location showed a significant wheat grain yield response to the K fertilization, but the additional K applied for the soybean crop showed no benefit for the wheat crop. While there was no significant increase in soybean grain yield to the additional K fertilizer observations suggest that the application of K fertilizer for soybeans may be of benefit. As was mentioned before the double-crop system is susceptible to yield-limiting conditions, heat, and moisture, due to the maturity of the crop during the peak summer months. The soybean grain yields achieved in this study were all below the previous five-year yield average for all the locations. The low achieved yields and crop stress may have limited this study’s ability to identify a significant response to the application of fertilizer. “
So, one of the most interesting finding from the first six sites was that topdressing P increased yield of the wheat crop on the soil that had low pH and P. And since the P recs applied were only considering STP values and not soil pH, we had underapplied P for the wheat.
Now moving on to the 2021-22 season. Well as most of the famers know, this season has been a doozy. That said, we were not able to establish the treatments until February 1st. Therefor in the case of the 2021-22 wheat season the first application of P&K was made at top-dress timing and then the second application was made post wheat harvest. So, we are unable to say how a preplant wheat P&K application would have performed. But the wheat grain yield response to P&K was better than I could have ever imagined.

The rain post application (Feb 1st) was marginal but better than other areas in the central/southern Plains. There was about 1” of precipitation in February, almost 3” in March and under 0.2” in April. May rains for the OF site near Burbank aided in allowing the yields to climb, maxed out at 82 bushels per acre, while the SF-Nfld missed out on many of the late rains and yields topped out at 39 bushels.

At both sites there is a clear and distinct response to P fertilizer. Note the N and NK treatments significantly lower than all other treatments. The last column on each figure title NPK is the average of all other treatments that only received the wheats P&K rate and had yet had the soybeans P&K applications.
We were able to statistically analyze the locations together by calculating a relative yield for each location. This is done by dividing the yield of each plot by the yield of the N only treatment, we did this for each replication. We then ran a t-test to look at significant treatment difference, so below any treatments that has the letters above the columns, such as an ab and b, are not statistically different at a 95% level.

The relative yield data was able to confirm that across both locations an application of P in February significantly increased yields at a consistent level of 30-50%. It is interesting that while the NP+K+ treatment almost sorts out as being statistically the highest.
While I am not even close to suggesting that you should delay application of P fertilizer in wheat production, I am a big fan of in-furrow applications, this work does point to opportunities. Such as the ability to return to the field after the wheat is up and apply broadcast P if perhaps you could not at planting. But specifically, the potential for in-season Variable Rate phosphorus based upon crop response, maybe a P-Rich strip. What I can tell you this means is that I have more work to do. First, I need a better understand of when and where this is possible. Then it is time to figure out how to use this to our advantage to more efficiently use P fertilizer.
I do want to reiterate, I am not suggesting to move away from Preplant P nor in-furrow.
Keep an eye out for the soybean data because hopefully we catch a few good rains and find out if the timing of P&K will impact the double crop yields.
I want to send a big Thank you to all the cooperators who have put up with me and my time over years to get this data and the Oklahoma Soybean Board for their continued support of this project.
Feel free to send any questions for comments my way at b.arnall@okstate.edu
In-furrow fertilizers for wheat
From Guest Author, Dr. Dorivar Ruiz Diaz, Nutrient Management Specialist, Kansas State University
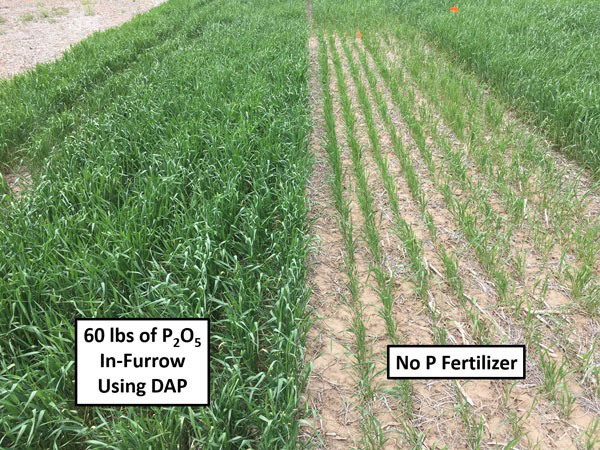
Wheat is considered a highly responsive crop to band-applied fertilizers, particularly phosphorus (P). Application of P as starter fertilizer can be an effective method for part or all the P needs. Wheat plants typically show a significant increase in fall tillers (Figure 1) and better root development with the use of starter fertilizer (P and N). Winterkill can also be reduced with the use of starter fertilizers, particularly in low P testing soils.
In-furrow fertilizer application
Phosphorus fertilizer application can be done through the drill with the seed. In-furrow fertilizer can be applied, depending on the soil test and recommended application rate, either in addition to or instead of, any pre-plant P applications. The use of dry fertilizer sources with air seeders is a very popular and practical option. However, other P sources (including liquid) are agronomically equivalent and decisions should be based on cost and adaptability for each operation.
When applying fertilizer with the seed, rates should be limited to avoid potential toxicity to the seedling. When placing fertilizer in direct contact with wheat seed, producers should use the guidelines in Table 1.
Table 1. Suggested maximum rates of fertilizer to apply directly with the wheat seed
| Pounds N + K2O (No urea containing fertilizers) | ||
| Row spacing (inches) | Medium-to-fine soil textures | Course textures or dry soils |
| 15 | 16 | 11 |
| 10 | 24 | 17 |
| 6-8 | 30 | 21 |
Air seeders that place the starter fertilizer and seed in a 1- to 2-inch band, rather than a narrow seed slot, provide some margin of safety because the concentration of the fertilizer and seed is lower in these diffuse bands. In this scenario, adding a little extra N fertilizer to the starter is less likely to injure the seed – but it is still a risk.
What about blending dry 18-46-0 (DAP) or 11-52-0 (MAP) directly with the seed in the hopper? Will the N in these products hurt the seed?
The N in these fertilizer products is in the ammonium-N form (NH4+), not the urea-N form, and is much less likely to injure the wheat seed, even though it is in direct seed contact. As for rates, guidelines provided in the table above should be used. If DAP or MAP is mixed with the seed, the mixture can safely be left in the seed hopper overnight without injuring the seed or gumming up the works. However, it is important to keep the wheat mixed with MAP or DAP in a lower relative humidity. A humidity greater than 70% will result in the fertilizer taking up moisture and will cause gumming or caking within the mixture.
How long can you allow this mixture of seed and fertilizer to set together without seeing any negative effects to crop establishment and yield?
The effects of leaving DAP fertilizer left mixed with wheat seed for various amounts of time is shown in Figure 2. Little to no negative effect was observed (up to 12 days in the K-State study).

Although the wheat response to these in-furrow fertilizer products is primarily from the P, the small amount of N that is present in DAP, MAP, or 10-34-0 may also be important in some cases. If no pre-plant N was applied, and the soil has little or no carryover N from the previous crop, the N from these fertilizer products could benefit the wheat.
Dorivar Ruiz Diaz, Nutrient Management Specialist
ruizdiaz@ksu.edu
Chris Weber, former Graduate Research Assistant, Soil Fertility
DAP in short supply? Revisiting, DAP vs MAP, Source may matter!
From mid August through October, fertilizer applicators and grain drills are running across the southern great plains wheat ground. Di-ammonium Phosphate (DAP 18-46-0) is maybe the most popular form of phosphorous (P) utilized in wheat production today. DAP delivers a high content of nitrogen (N) while efficiently binding the toxic aluminum (Al) ions low pH soils. However due to the flooding that occurred throughout the spring the Ports have been closed and DAP could be in short supply. I have heard that many companies and Co-ops have already sourced Mono-ammonium phosphate (MAP 11-52-0) to supplement the lack of DAP for our early planted wheat crop. With this happening, I wanted to share some points about the two sources. In a broadcast incorporated scenario I do not have much preference for one over the other. It is when producers are applying the fertilizer in-furrow or applying to alleviate Al toxicity that source can matter. As described in the post below, in a soil with a neutral pH DAP and MAP perform equally well. So in this scenario I give MAP a slight edge over DAP if the price is the same. I say this as you can run less material per acre with MAP and refill a little less often. Many worry about the drop in N delivered with MAP versus DAP but in my work I see that is the P in the starter that gives us a good response and not the N, which can be delivered with pre-plant or top-dress. However, DAP wins out in soils with a pH below 5.5. The original blog below shows the results when DAP and MAP are banded in acidic soils using the same rate of P per acre. The reason we see this happen is that when MAP dissolves it forms a slightly acidic solution (approx 4.0) while DAP will dissolve to form a slightly basic solution (approx 7.5). In our work BOTH DAP and MAP increased yield above the check in acidic soils, which goes to show MAP is an affect tool for short term remediation of aluminium toxicity (Band P for Al toxicity Blog). However it might require more MAP per acre to reach the equivalent results. Because of what we saw when comparing the two sources at equivalent rates of P, I would recommend increasing the rate of P2O5 from 30 lbs per acre to 35 or 40. This would be going from 65 lbs of DAP to 67-77 lbs of MAP per acre.
So the take home would be as this wheat season takes off and you find that DAP is hard to locate and you A) Have overall neutral (5.5+) pH levels do not hesitate using MAP. Run the normal amount of material getting a few extra lbs of P or apply less material to get the same amount of phosphate. B) Have a acidic situation and are banding to alleviate aluminum toxicity use the same amount of material or a little bit more. Keep in mind in acidic soils with a low soil test P level you have to apply enough phosphate to take care of the Al and enough to take care of the P deficiency. Note the results of the NPKS wheat response strip (NPKS BLOG)
Original Post Published July 18, 2016
DAP vs MAP, Source may matter!
Historically the two primary sources of phosphorus have had different homes in Oklahoma. In general terms MAP (11-52-0) sales was focused in Panhandle and south west, while DAP (18-46-0) dominated the central plains. Now I see the availability of MAP is increasing in central Oklahoma. For many this is great, with MAP more P can be applied with less material. which can over all reduce the cost per acre. There is a significant amount of good research that documents that source of phosphorus seldom matters. However this said, there is a fairly large subset of the area that needs to watch what they buy and where they apply it.
If you are operating under optimum soil conditions the research shows time and time again source does not matter especially for a starter. In a recent study just completed by OSU multiple sources (dry, liquid, ortho, poly ect ect) of P were evaluated. Regardless of source there was no significant difference in yield. With the exception of the low pH site. The reason DAP was so predominate in central Ok, soil acidity. See an older blog on Banding P in acidic soils.

Figure 1. The cover of an extension brochure distributed in Oklahoma during the 1980s.
When DAP is applied, the soil solution pH surrounding the granule will be alkaline with a pH of 7.8-8.2. This is a two fold win on soil acidity aka aluminum (Al) toxicity. The increase in pH around the prill reduces Al content and extends the life of P, and as the pH comes back down the P ties up Al and allows the plant to keep going. However, the initial pH around the MAP granule ranges from an acid pH of 3.5-4.2. There is short term pH change in the opposite direction of DAP, however the the Al right around the prill becomes more available and in theory ties up P even faster.
Below is a table showing the yield, relative to untreated check, of in-furrow DAP and MAP treatments in winter wheat. The N401 location had a ph 6.1 while Perk (green) has a pH of 4.8. At Perkins in the low pH, both forms of P significantly increased yield, almost 20 bushel on the average. DAP however was 5 bushel per acre better than MAP. At the N40 site the yield difference between the two sources was 1 bushel.

Relative yield winter wheat grain yield MAP and DAP both applied at equal rates of P (32 lbs P2O5 ac) when compared to a untreated check.
In general it can be said that in acid soils DAP will out preform MAP while in calcareous high pH soils MAP can out preform DAP. So regarding the earlier statement about the traditional sales area of MAP or DAP if you look at the soil pH of samples went into the Oklahoma State University Soil, Water, and Forage Analytical lab the distribution makes since.
Average soil pH of samples sent into OSU soil water forage analytical lab by county.
In the end game price point and accessibility drives the system. In soils with adequate soil pH levels, from about 5.7 to around 7.0, get the source which is cheapest per lbs of nutrient delivered and easiest to work with. But if you are banding phosphorus in row with your wheat crop because you have soil acidity, DAP should be your primary source.
Double Crop Response to Additional N, P, K and S.
Vaughn Reed, PhD. Student Precision Nutrient Management
Brain Arnall Precision Nutrient Management Extension Specialist.
Data presented below are the results of Mr. Reeds Masters research project.
On farm research trials are important, because they give us the ability to see responses over a larger geographic area, and even more importantly, evaluate our recommendations on fields that are managed by producers, not researchers. They also allow us to look at current production practices and see if there are any missed opportunities. Several years ago, we looked at whether producers were leaving yield on the table by not applying enough nitrogen (N), phosphorus (P), potassium(K), and sulfur (S) to winter wheat. We did this by applying strips of N, P, K, and S fertilizer on farmers’ fields with the instructions to not change their fertilizer management strategies. If one or more of the strips resulted in higher yields then it could be assumed that either the nutrient was under-applied by the producer, or in the case of N, lost. That study concluded that at 75% of the locations, yield was maximized by the producer with [their respective] NPKS management system, however the greatest responses came from the addition of P and that Oklahoma State University’s soil testing and analysis was adequate for nutrient recommendations. That studies results were published in 2017 and is open access, so available for anyone to read. https://dl.sciencesocieties.org/publications/cftm/abstracts/3/1/cftm2017.02.0014

Locations of double crop fertility response strips applied in the summers of 2016 and 2017.
There are many producers around the state that follow winter wheat with double crops (DC). Often, this practice is done with limited inputs to reduce economic risk. Oklahoma State does not make different recommendations for DC or full season crops, with the exception that yield potentials can differ. In 2016 and 2017 we duplicated the Wheat NPKS study across 3 double crops (soybean, grain sorghum, sunflower) following winter wheat and canola. With a recent climb in DC yields we wanted to investigate if producers were applying enough nutrients to maximize grain yield. Additionally it would allow us evaluate the accuracy of OSU’s soil test based fertilizer recommendations in a double crop. Over the two years, 61 on-farm sites ranging from central to NE Oklahoma had 200 lb/ac of product per nutrient applied in strips 6ft wide by 150 ft long. Urea (46-0-0), triple super phosphate (0-46-0), muriate of potash (0-0-60), and gypsum (0-0-0-19) were used for sources N, P, K, and S, respectively (92 lbs N, 92 lbs P, 120 lbs K, 38 lbs S). In most cases the fertilizer was applied post planting and post-emergence to ensure strips were applied an areas with good stand.
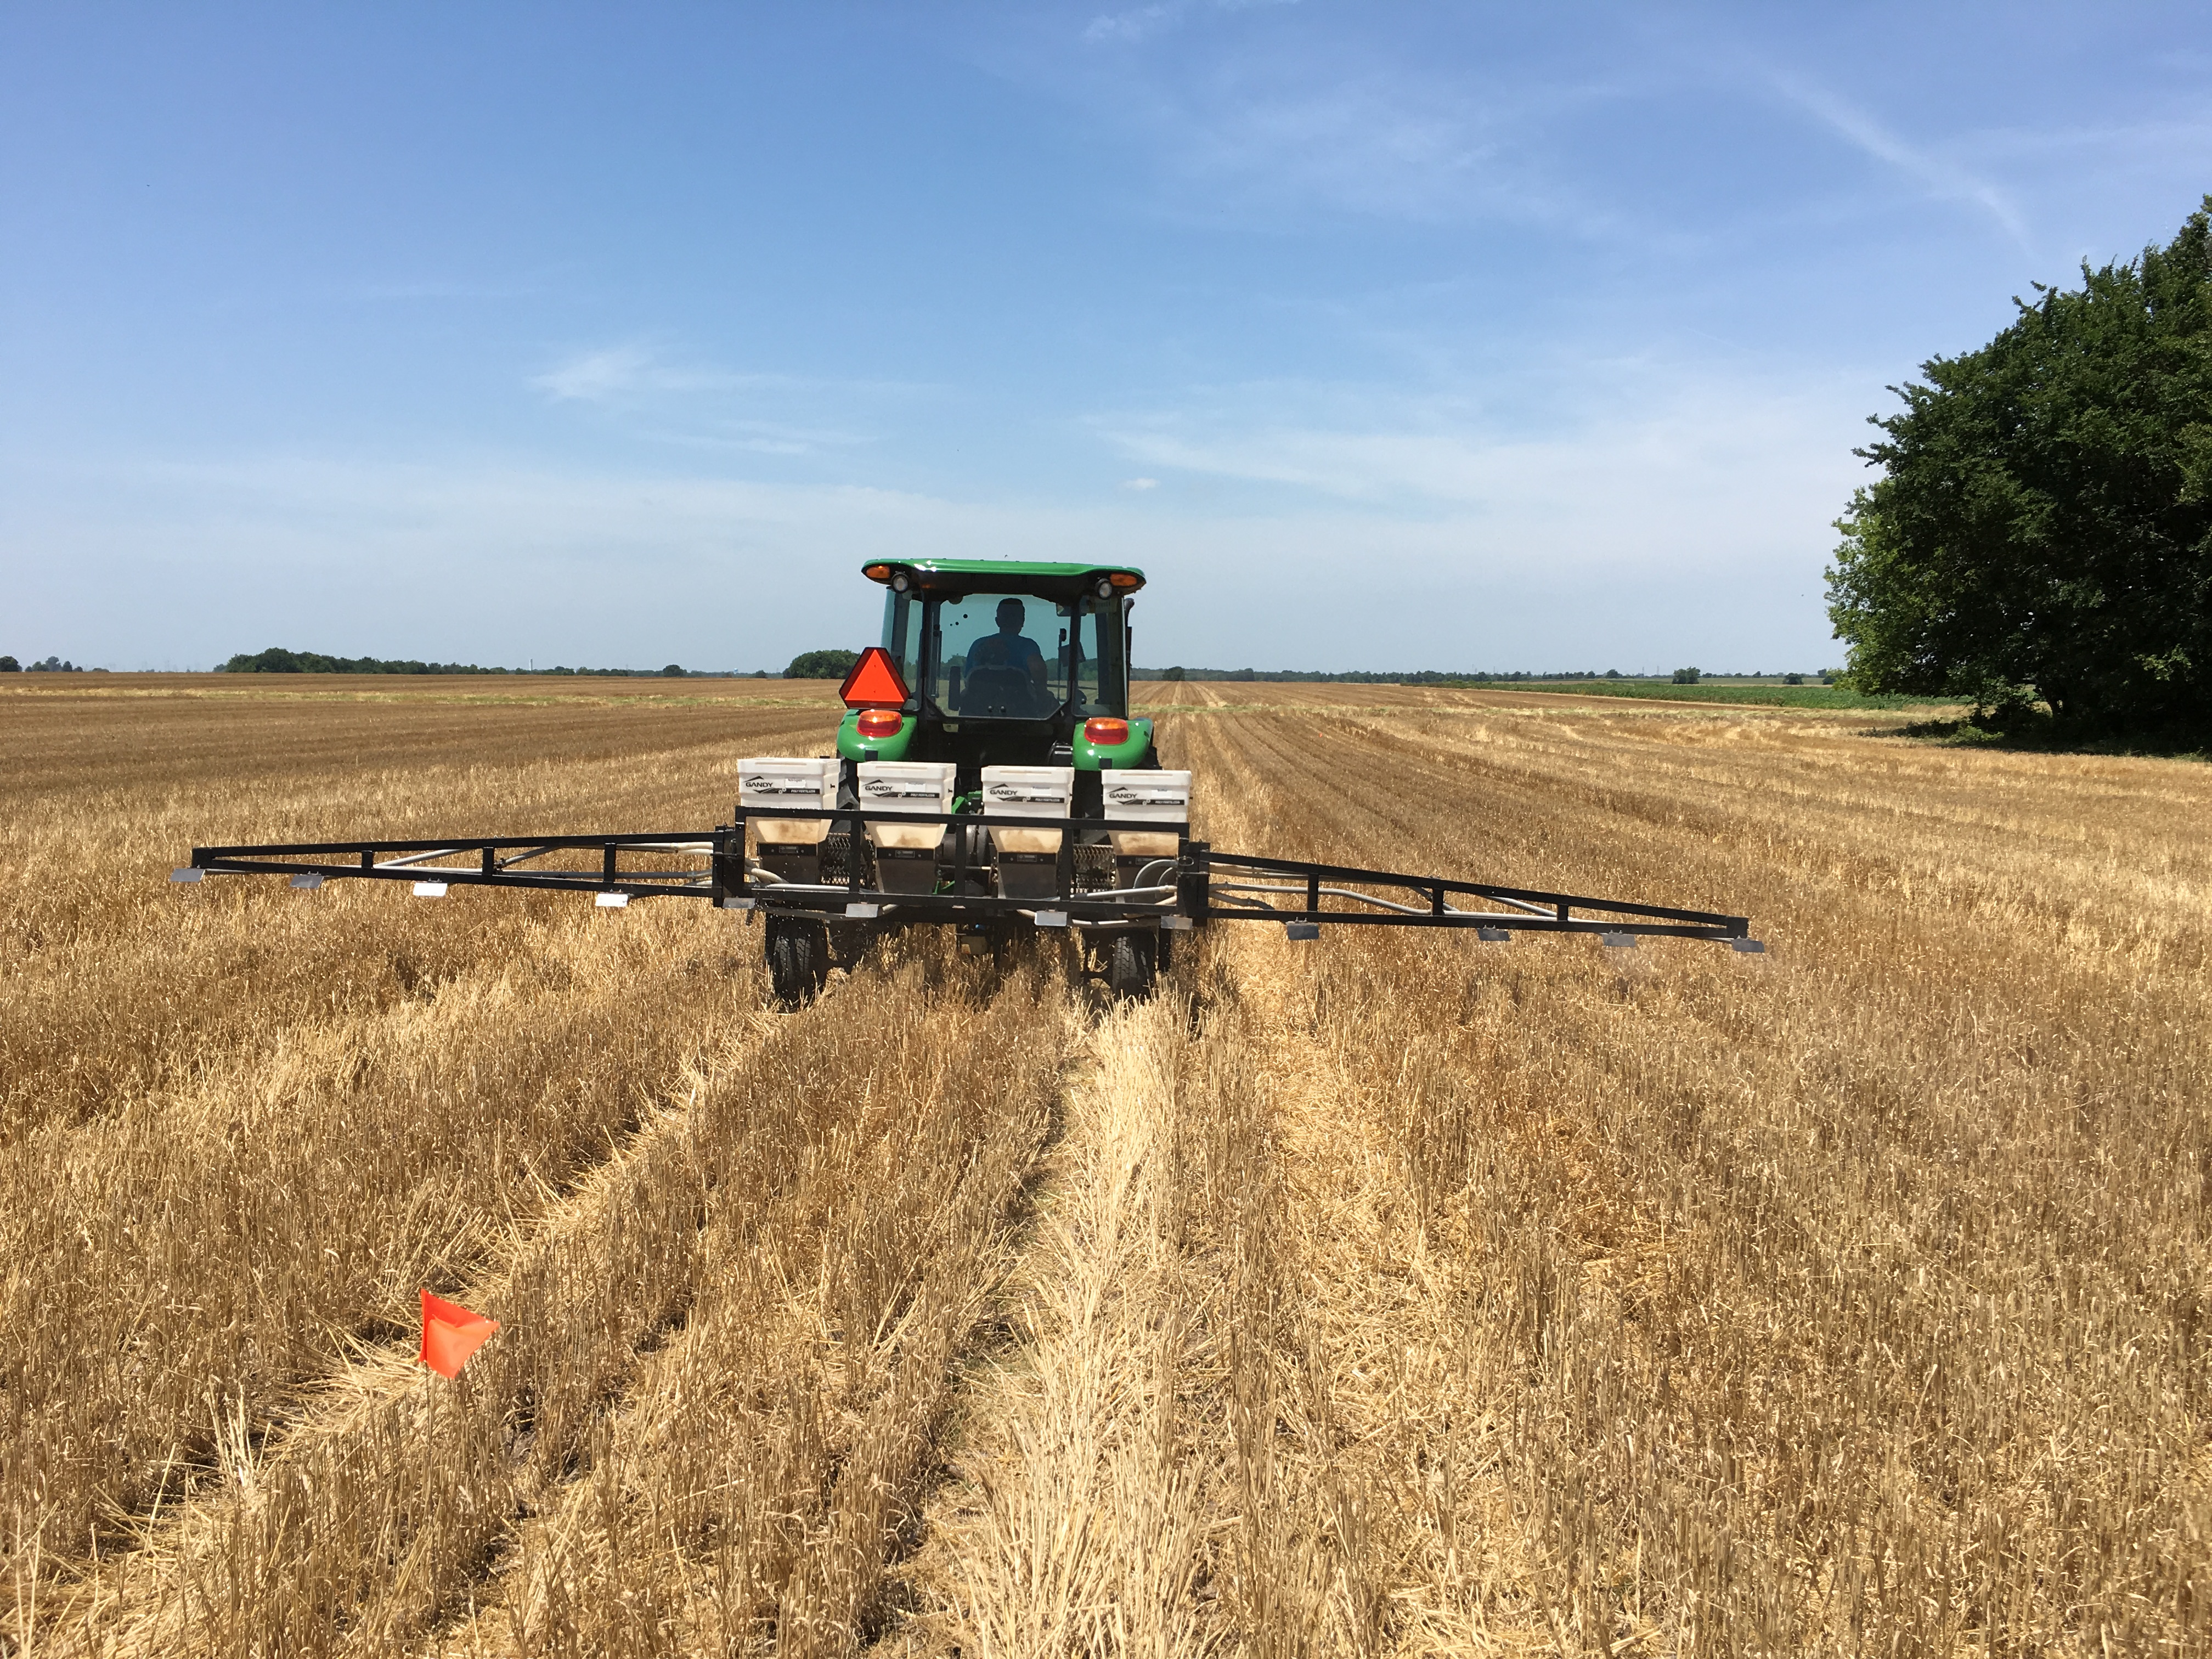
NPKS Strip Applicator. This ground driven 3pt rig uses Gandy boxes to deliver fertilizer into tubes which is then blown, by a PTO driven fan, out into strips 6 feet wide, per box. This applicator was putting out 200 lbs of Urea, 0-46-0, potash, and gypsum out per acre.
Much like with the wheat-NPKS study 75% of the locations did not respond to additional fertilizer. Twenty treatment comparisons of the 244 made across all 61 locations (50 soybean, 7 grain sorghum, 4 sunflower) yielded a statistically significant change in yield due to the addition of N-P-K-or S. For this report, a comparison was the yield of each nutrient versus the non-treated check, therefore there were four comparisons made per location. Seventeen of the twenty positive responses were found in soybean, three with grain sorghum, and no responses were found in sunflower plots. Lack of response from grain sorghum and sunflower locations is contributed to small amount of grain sorghum and sunflower fields in the study.
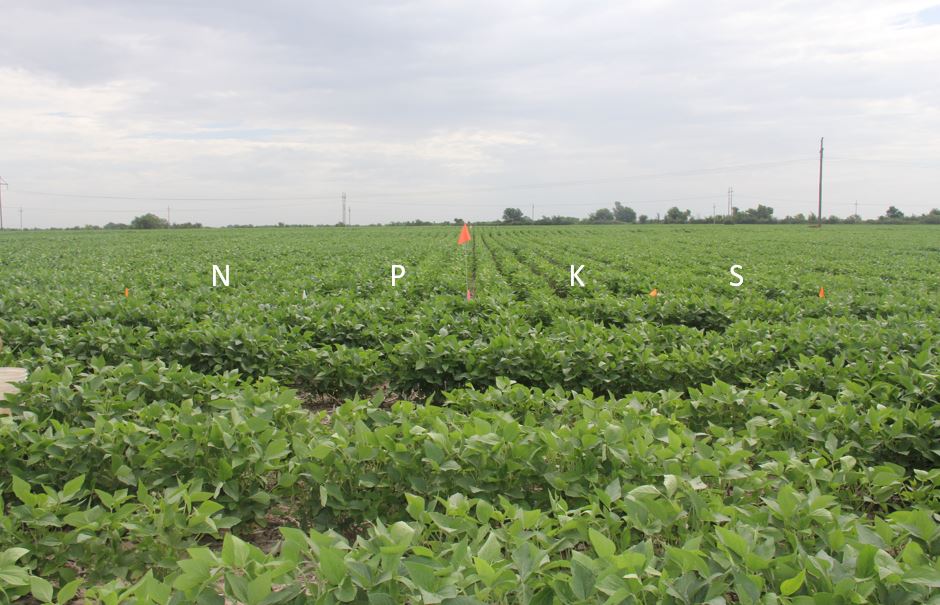
Double crop soybeans in Ottawa County with strips of nitrogen, phosphorus, potassium, and sulfur applied post plant.
Nitrogen rates, for non-legumous crops, are yield driven, meaning the higher yielding a crop, the higher amount of N required. Both grain sorghum and sunflower crops, due to neither being legumes, were expected to see N response, especially to those locations that applied little to no N to begin with. A yield response from the addition of N was found in one grain sorghum location, where the producer application was not enough to maximize yield, and the additional N pushed the yields. As expected, there were no soybean locations that responded to the addition of N.
Phosphorus and potassium are both sufficiency based, not yield driven. This means that if the soil is at 100% sufficiency, the crop will produce at its highest rate achievable, based on that nutrient. 100% sufficiency for P and K are approximately 65 STP and 250 STK, respectively. Phosphorus and potassium strips yielded the most results, especially in soybean locations. Of 20 responses, five responses were due to P, ten due to K, and four due to S. Locations that responded to the addition to P were locations that either had low levels of STP (approx. 80% sufficiency or less), or had low pH, which leads to less availability of P (pH>5.0).
Potassium yielded the most positive results, with ten responsive locations, as well as the most interesting results, with only three sites falling below 100% sufficiency. The other responses were attributed to having low Cl levels (Cl, as in Chloride, which while responses are rare, is a necessary nutrient, and sometimes can lead to losses in yield, especially in sandy environments), as well as drought stress conditions. Potassium has been shown to have a vital role in nutrient uptake and water retention, as it is found to be critical for root growth, and these are displayed highest in crops found in drought like conditions. One hypothesis for the K response is related to root growth. The later planted DC will spend less resources in root development before going reproductive. Soybean is a heavy user of K, combine smaller roots, typically hot drier soils, and high K demand it is not surprising to find this occurrence.
Sulfur, while not wide-spread reported in Oklahoma, has recommendations by OSU built on a yield driven scale. There were four responsive locations found in this project. While one location had low soil test S values there were located areas that received high rainfall events during the growing season, and therefore the response was attributed to leaching of S.
So, after all that, what is the bottom line? Here is our observations:
- Producers maximized yield 75% of the time, with 25% of locations responding to any additional nutrient.
- The 20 responses to additional nutrients occurred across 15 locations, four locations had responses to more than one nutrient
- By nutrient: Note for P and K, due to site variability it was not expected to observe statistic yield increase due to P or K unless soil test was below 70% sufficiency, of which no location had soil test P or K below 70%.
- 38 locations were below 100% sufficiency of phosphorus, with five observed responses
- Seven locations were below 100% sufficiency of potassium, two observed responses. An additional eight locations responded that were not predicted by soil test
- Based on pre-plant soil test there were no sites expected to respond to the addition of Sulfur, 4 locations did respond.
- Soil test results were adequate in correctly identifying locations that would not respond to the addition of nutrients (93.5% accurate), while not as accurate at predicting sites that would respond.
- For K, soil testing was less accurate, as eight of the ten responsive locations had soil test values above 250 soil test K (125 ppm or 100% sufficiency). For this reason, we are currently doing work evaluating K recommendations for soybeans.
This work confirms that of the fields we evaluated, the majority was not yield limited by N, P, K or S. However, as with anything, we have more work to do in order to further refine our recommendations, and always looking to learn more about how to aid producers.
Now may not be the time for Replacement
For phosphorus (P) and potassium (K) fertilizer management there are three primary schools of thought when it comes to rate recommendations. The three approaches are Build-up, Maintenance/Replacement, and Sufficiency. There is a time and place for each one of the methods however the current markets are making the decision for the 2016-16 winter wheat crop a very easy one. The OSU factsheet PSS-2266 goes in-depth on each of these methods. For the rest of the blog I will use P in the conversation but in many scenarios K should/could be treated the same.
Build-up is when soil test is below a significant amount of fertilizer, about 7.5 lbs P2O5 per 1 ppm increase, is added so that soil test values increase. This method is only suggested when grain price is high and fertilizer is relatively cheap. Given the market, this is a no go. The two most commonly used methods of recommendation are Replacement and Sufficiency. In the replacement approach if the soil is at or below optimum P2O5 rate it based upon replacing what the crop will remove. The sufficiency approach uses response curves to determine the rate of P that will maximize yield. These two values are typically quite different. A good way you boil the two down is that replacement feeds the soil and sufficiency feeds the plant.
Oklahoma State Universities Soil, Water, and Forage Analytical Lab (SWFAL) provides recommendations utilizing sufficiency only while many private labs and consultants use replacement or a blended approach. Some of this is due to region. Throughout the corn belt many lease agreement contain clauses that the soil test values should not decrease otherwise the renter pays for replacement after the lease is over. For the corn belt both corn and soybean can be expected to remove 80 to 100 pounds of P per year. Conversely the Oklahoma state average wheat crop removes 17 lbs P a year. In areas where wheat yields are below 40 bushel per acre (bpa) using the sufficiency approach for P recs can increase soil test P over time.

This conceptual soil test response curve is divided into categories that correspond with below opti-mum, optimum and above optimum soil test values. The critical level is the soil test level, below which a crop response to a nutrient application may be expected, and above which no crop response is expected. At very high soil test levels crop yield may decrease.
*Rutgers Cooperative Extension Service FS719
Back to subject of this blog, consultants, agronomist, and producers need to take a good look at the way P recs are being made this year. Profitability and staying in the black is the number 1, 2, and 3 topic being discussed right now. The simple fact is there is no economic benefit to apply rate above crop need, regardless of yield level. The figures above demonstrate both the yield response to fertilizer based upon soil test. At the point of Critical level crop response / increase in yield is zero. What should also be understood is that in the replacement approach P fertilizer is still added even when soil test is in Optimum level. This also referred to as maintenance, or maintaining the current level of fertility by replacing removal. If your program is a replacement program this is not a recommendation to drop it completely. Over a period of time of high removal soil test P levels can and will be drawn down. But one year or even two years of fertilizing 100 bpa wheat based on sufficiency will not drop soil test levels. On average soils contain between 400 and 6000 pounds of total phosphorus which in the soil in three over arching forms plant available, labile, and fixed. Plant available is well plant available and fixed is non plant available. The labile form is intermediate form of P. When P is labile it can be easily converted to plant available or fixed. When a plant takes up P the system will convert labile P into available P. When we apply P fertilizer the greatest majority of was is applied makes it to the labile and fixed forms in a relatively short period of time. For more in-depth information on P in the soil you can visit the SOIL 4234 Soil Fertility course and watch recorded lectures Fall 2015 10 26-30 Link .
How to tell if your P recs have a replacement factor, not including calling your agronomist. First replacement recs are based on yield goal, so if you change your yield goal your rate will change. The other and easier way is to compare your rates to the table below. Most of the regional Land Grant Universities have very similar sufficiency recs for wheat. Another aspect of the sufficiency approach is the percent sufficiency value itself. The sufficiency can provide one more layer in the decision making process for those who are near the critical or 100% level. Response and likelihood of response to P is not equal. At the lowest levels the likelihood of response is very high and the yield increase per unit of fertilizer is the greatest. As soil test values near critical (32.5 ppm or 65 STP) the likelihood of response and amount of yield increase due to fertilizer P decreases significantly. At a STP of 10 the crop will only produce 70% of its environmental potential if P is not added while at a STP of 40 the crop will make 90% of its potential. The combination of % sufficiency and yield goal can be used to determine economic value of added P.

*From Oklahoma State University Soil Test Interpretations. Fact Sheet PSS-2225
*Based on Mehlich 3
*PPM (parts per million) is used by most labs
*STP (soil test P) is a conversion used by some Universities. Equivalent to pounds per acre.
* for a 0-6” in soil sample PPM * 2 = STP.
This data is available from OSU in multiple forms from the Factsheet PSS-2225, the SWFAL website, Pete Sheets quick cards, and the Field Guide App.

This year with margins tight soil testing is more important than ever before. Knowing the likelihood of response and appropriate amount of fertilizer to apply will be critical maximizing the return on fertilizer invest while maximizing the quality and amount of grain we can produce. Visit with your consultant or agronomist to discuss what the best approach is for your operation. Lets ride this market out, get the most out of every input and come out of this down cycle strong.
Feel free to contact me with any questions you may have.
Brian
b.arnall@okstate.edu
DAP vs MAP, Source may matter!
Historically the two primary sources of phosphorus have had different homes in Oklahoma. In general terms MAP (11-52-0) sales was focused in Panhandle and south west, while DAP (18-46-0) dominated the central plains. Now I see the availability of MAP is increasing in central Oklahoma. For many this is great, with MAP more P can be applied with less material. which can over all reduce the cost per acre. There is a significant amount of good research that documents that source of phosphorus seldom matters. However this said, there is a fairly large subset of the area that needs to watch what they buy and where they apply it.
If you are operating under optimum soil conditions the research shows time and time again source does not matter especially for a starter. In a recent study just completed by OSU multiple sources (dry, liquid, ortho, poly ect ect) of P were evaluated. Regardless of source there was no significant difference in yield. With the exception of the low pH site. The reason DAP was so predominate in central Ok, soil acidity. See an older blog on Banding P in acidic soils.
Figure 1. The cover of an extension brochure distributed in Oklahoma during the 1980s.
When DAP is applied, the soil solution pH surrounding the granule will be alkaline with a pH of 7.8-8.2. This is a two fold win on soil acidity aka aluminum (Al) toxicity. The increase in pH around the prill reduces Al content and extends the life of P, and as the pH comes back down the P ties up Al and allows the plant to keep going. However, the initial pH around the MAP granule ranges from an acid pH of 3.5-4.2. There is short term pH change in the opposite direction of DAP, however the the Al right around the prill becomes more available and in theory ties up P even faster.
Below is a table showing the yield, relative to untreated check, of in-furrow DAP and MAP treatments in winter wheat. The N401 location had a ph 6.1 while Perk (green) has a pH of 4.8. At Perkins in the low pH, both forms of P significantly increased yeild, almost 20 bushel on the average. DAP however was 5 bushel per acre better than MAP. At the N40 site the yield difference between the two sources was 1 bushel.
Relative yield winter wheat grain yield MAP and DAP both applied at equal rates of P (32 lbs P2O5 ac) when compared to a untreated check.
In general it can be said that in acid soils DAP will out preform MAP while in calcareous high pH soils MAP can out preform DAP. So regarding the earlier statement about the traditional sales area of MAP or DAP if you look at the soil pH of samples went into the Oklahoma State University Soil, Water, and Forage Analytical lab the distribution makes since.
Average soil pH of samples sent into OSU soil water forage analytical lab by county.
In the end game price point and accessibility drives the system. In soils with adequate soil pH levels, from about 5.7 to around 7.0, get the source which is cheapest per lbs of nutrient delivered and easiest to work with. But if you are banding phosphorus in row with your wheat crop because you have soil acidity, DAP should be your primary source.
Results from 1st year of Soybean Starter Work
In the spring of 2014 we initiated what was to be the first year of a three year project evaluating starter fertilizers for soybean production in the southern Great Plains. The first and second year was and is being funded by the Oklahoma Soybean Board.
Year one was a bit experimental in that with so many products on the market we needed some initial work to help focus the direction for years two and three. I also added a treatment which I knew would have significant negative impact, for extension reasons. Keep in mind two locations in a single year does not make an experiment nor provide enough information to draw a definite conclusion. It is however enough to learn some lessons from and for us to plan for our 2015 trials.
The 2014 trial consisted of 12 treatments, Figure 1 and Figure 2. In these treatments I wanted to see the impact of a standard practice, see if a specific nutrient may be more so beneficial, and evaluate a few popular products. The spring of 2014 started out dry so at one of our two locations we pre-watered. This was done by hauling water to the Lake Carl Blackwell (LCB) 1000 gallons at a time and pumping through sprinklers. The other site, Perkins, we delayed planting until we had moisture.

Treatment Structure and rates for the 1st year of the Soybean Starter Study.

List of fertilizers and products used.

Image taken while planting the Soybean Starter study at Perkins. A CO2 system was used to deliver starter fertilizers with seed.
The two locations were also selected due to differences in soil fertility. The LCB site is has good soil fertility, with exception of phosphorus (P), and the Perkins site pH was an issue. I would have expected a benefit from adding P at both of these locations. Figure 4 shows the soil test results.

Soil Test results from LCB and Perkins.
At LCB as expected some of the treatments (Thio-Sul) reduced stand, some unexpectedly reduced stand (Fe) and others had less impact on stand (APP 5.0) than expected. The growth at LCB was tremendous, the 30 in rows covered over very quickly and the majority of the treatments hit me waist high by early August (I am 6’0”). Many of the treatments showed greater growth than check. But when it comes down to it, grain pays and green does not. Statistically there were no treatments that out preformed the un-treated check, however the K-Leaf and 9-18-9 did make 3 and 2 bpa more than the check respectively. What I am hypothesizing at this site is that the added nutrients, especially those with high P levels, significantly increased vegetative grown and these big plants were delayed into going reproductive and they started setting pods later in much hotter weather. While riding in the combine I could see that the plots with compact plants with clearly defined rows out yielded those were the vines had crossed over and we harvested through more of a solid mat of mature plants. A hot August is not uncommon and I am curious on whether this trend repeats itself. If it does this may direct us into research evaluating ways to force/promote the reproductive stage to start in these big plants. Even if we can force flowering to start earlier, it’s unknown whether yields will increase or not.
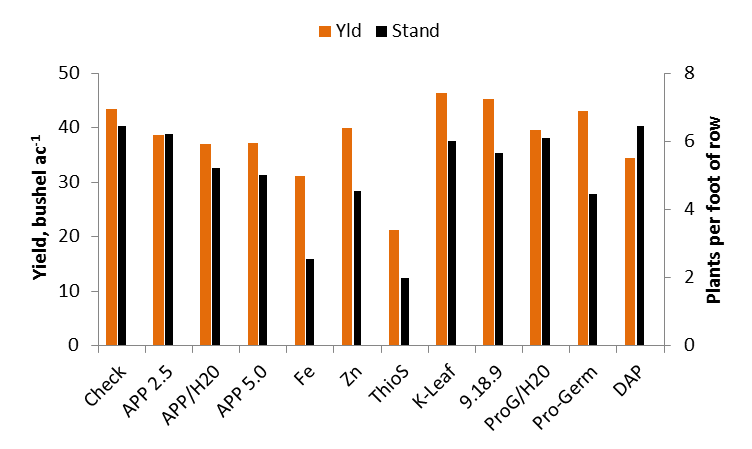
Yield and Stand counts from the 2014 LCB Soybean Starter Study.

The Check plot at LCB were plants noticeably a bit smaller and more yellow than the neighbors with phosphorus.

Soybeans at LCB on August 4th.
The same trends in treatments reducing stand can be seen at Perkins, however the impact was less extreme. Perkins being planted later due to waiting on moisture forced a later flowering date and I believe reduced overall yields. But the addition of P at this low pH site definitely made a difference. While again no treatments were statistically greater than the un-treated check the 2.5 gpa APP, DAP broadcast, APP/H2O, and Pro-Germ/H20 treatments increased yield by 5.6, 4.2, 3.8 and 1.7 bpa respectively.

Yield and Stand Counts from the Perkins 2014 Soybean Starter Study.
Take home from year one was that at LCB the addition of a starter fertilizer had little benefit and if done wrong could cost you yield while at the low pH site of Perkins an addition 2.5 gallons of APP did get a 5 bpa bump, but do to variability in the trial the increase was not statistically significant. This year we will drop some of the treatments and incorporate a few new treatments. Based on the current weather we look to potentially being able to start with better soil moisture at planting. Again do not take this work and significantly adjust any plans you have for your 2015 soybean crop. This is however some interesting findings that I wanted to share and make everyone aware of. Finally thank you to the Oklahoma Soybean Board for providing funding for this work. www.oksoy.org/
