Home » Posts tagged 'Oklahoma'
Tag Archives: Oklahoma

How Much Nitrogen Does Double Crop Corn Need in Oklahoma?
Kelby Linn, MS Precision Nutrient Management
Emily Staton, MS Precision Nutrient Management
Josh Lofton, Cropping Systems Management
Brian Arnall, Precision Nutrient Management
Double crop (DC) corn is gaining attention in Oklahoma as producers look for opportunities to increase productivity following wheat harvest. While DC soybeans and sorghum remain common options, corn can serve as an alternative when planting windows are missed or when producers want to diversify their rotation. In Oklahoma systems, it is suggested DC corn is followed by a full season soybean crop the next year. This allows producers to maintain an intensive cropping system while maximizing land use. However, managing fertility in DC corn can be challenging because the crop is grown under a different environment than full season corn. One of the questions producers ask is how much nitrogen (N) is needed to maximize returns. Nitrogen is typically the largest fertilizer expense in corn production, but applying more N does not always result in higher yields. Recent Oklahoma research suggests DC corn may require less N than many would expect.
Understanding the System
To evaluate N requirements under Oklahoma DC conditions, field trials were conducted across 11 site years during the 2024 and 2025 growing seasons (Table 1). Corn was planted directly into wheat residue following harvest, creating a true DC production system. Nitrogen was applied as urea (46-0-0) at 13 rates ranging from 0 to 180 lbs N/acre in 15 lb N increments. The following data was collected: biomass production, grain yield, and grain quality responses across environments. The goal was to identify how much N is needed to maximize yield and profitability in Oklahoma DC corn.
Table 1. Field study locations for the 2024 and 2025 double crop corn trials in Oklahoma. Each location is listed with respective planting dates, corn varieties, planting populations and harvest date.
| Location | Planting | Variety | Population | Harvest |
| Perkins | 6/28/2024 | DK119-30 | 20k | 11/9/2024 |
| 7/11/2025 | DKC117-27RIB | 20k | 11/14/2025 | |
| Stillwater | 6/30/2024 | DK119-30 | 20k | 11/11/2024 |
| 7/12/2025 | DKC117-27RIB | 20k | 11/13/2025 | |
| Perry | 6/28/2024 | DK119-30 | 20k | 11/16/2024 |
| 7/7/2025 | DKC117-27RIB | 20k | 11/12/2025 | |
| Perry (Irrigated) | 7/7/2025 | DKC117-27RIB | 28K | 11/12/2025 |
| Lahoma | 7/9/2025 | DKC117-27RIB | 20k | 11/18/2025 |
| Fort Cobb (Irrigated) | 7/2/2025 | DKC117-27RIB | 28K | 11/15/2025 |
Yield Response: Nitrogen Helped, But Only to a Point
Across all harvested site years, N applications significantly influenced grain yield when environment was not the limiting factor. Average yields ranged from 40 to 94 bu/ac, demonstrating how variable DC corn performance can be from year to year and field to field (Staton, 2026) (Figure 1). While some locations responded positively to N fertilizer, others showed little response even when rates reached 180 lbs N/ac. The consistent finding was yield responses often plateaued around 60 lbs N/ac. Once this point was reached, additional fertilizer rarely produced enough additional grain to justify the added cost. Across two Oklahoma studies representing 11 site-years, unfertilized double-crop corn averaged approximately 52 bu/ac. That finding highlights just how much nitrogen can be supplied by the soil through residual nitrate and mineralization before fertilizer is applied. These results suggesting existing soil N and nutrient mineralization contributed significantly to crop demand (Staton, 2026).
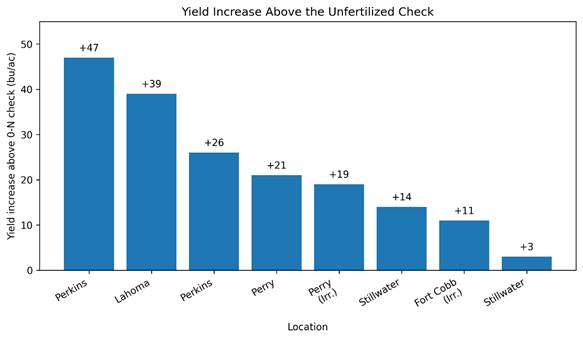
Figure 1. Increase in yield of the highest yielding treatment as compared to the non-fertilized check yields of each location. Adapted from Staton (2026)
The Real Story: Return on Investment
While producers naturally focus on maximizing yield, these fertilizer decisions should be based on profitability. Average economic return peaked near 60 lb N/ac. Beyond that rate, additional fertilizer consistently reduced profit (Figure 2). Although individual economic returns varied among environments, the agronomic data suggest producers should approach DC corn fertility programs with realistic yield expectations. Unlike high yielding full season corn, DC systems often encounter environmental limitations that reduce the return on additional fertilizer investment.
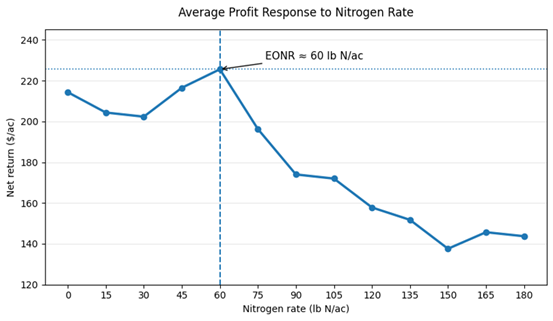
Figure 2. Average profit response to nitrogen rate in US dollars (USD)/ac. Adapted from Staton (2026).
What This Means for Oklahoma Producers
The results from this study closely align with previous Oklahoma research evaluating N response in DC corn. Wyma (2022) reported approximately one additional bushel of grain for every 1.8 lbs N applied above the unfertilized control, similar to Staton (2026) who observed one additional bushel for every 1.7 lbs N in responsive environments. Together these studies suggest Oklahoma DC corn requires approximately 1.75 lbs N for every additional bushel of expected yield above 50 bu ac-1.
The goal of nitrogen management is not to apply the most fertilizer, it is to apply the right amount. Two independent Oklahoma studies now indicate that double-crop corn often requires substantially less N than full-season corn. Matching N rates to realistic yield potential can improve profitability while reducing unnecessary fertilizer costs.
Take Home
- Double crop corn is a economically viable option in Oklahoma.
- Use lower total N rates than full-season corn.
- Across two independent studies’, the unfertilized corn averaged about 50 bushels per acre.
- 1.75 lb N per expected additional bushel above the unfertilized expectation.
- Base final N rates on realistic yield potential and expected moisture.
- Consider residual soil nitrate following wheat before increasing fertilizer rates.
- Avoid applying N beyond expected crop demand.
References
Alcoz, Mercedes M., Frank M. Hons, and Vincent A. Haby. 1993. “Nitrogen Fertilization Timing Effect on Wheat Production, Nitrogen Uptake Efficiency, and Residual Soil Nitrogen.” Agronomy Journal 85(6):1198–1203. doi:10.2134/agronj1993.00021962008500060020x.
Chang, Jen-Hu. 1981. “Corn Yield in Relation to Photoperiod, Night Temperature, and Solar Radiation.” Agricultural Meteorology 24:253–62. doi:10.1016/0002-1571(81)90049-2.
Kravchenko, Anatoliy G., and Kurt D. Thelen. 2007. “Effect of Winter Wheat Crop Residue on No-Till Corn Growth and Development.” Agronomy Journal 99(2):549–55. doi:10.2134/agronj2006.0192.
Liu, Zheng, Jia Gao, Fei Gao, Shuting Dong, Peng Liu, Bin Zhao, and Jiwang Zhang. 2018. “Integrated Agronomic Practices Management Improve Yield and Nitrogen Balance in Double Cropping of Winter Wheat-Summer Maize.” Field Crops Research 221:196–206. doi:10.1016/j.fcr.2018.03.001.
Staton, Emily. 2026. “Nitrogen Management in Double Crop Corn” M.S., Oklahoma State University, United States — Oklahoma.
Wyma, Rhiannon Nichole. 2022. “Corn Grain Yield Response to Nitrogen Rate and Plant Population in Full and Double-Crop Systems.” M.S., Oklahoma State University, United States — Oklahoma.
Bigger Isn’t Always Better: The Relationship Between Plant Size, Yield Potential, and Yield Stability in Summer Crops
Josh Lofton, Cropping Systems Specialist
In the last several years, warmer springs and higher/widespread rainfall have resulted in summer crops reaching with a high amount of vegetative growth. This season has been quite different for the most part, cooler temperatures and more sporadic rainfall has resulted in much smaller plants. So that begs the question, are larger or smaller plants better for yield in Oklahoma. While many that have spent time in Oklahoma will probably have a preference, there is no direct answer to this question.
Larger plants generally have more leaves, more stems, more branches, and more overall biomass. They often appear healthier and more productive throughout the growing season.
In higher rainfall and lower stress environments, this assumption is true. Greater vegetative growth can support higher yield potential because larger plants capture more sunlight, accumulate more photosynthates, and develop a greater capacity to support grain or seed production.
However, in Oklahoma and throughout the Southern Great Plains, yield potential and yield stability are not always the same thing.
The challenge facing producers across this region is that crops must balance the opportunity to maximize yield with the risk of running short on water during critical reproductive growth stages. As a result, the plant with the greatest theoretical yield potential is not always the plant that produces the most grain across a range of environmental conditions.
The Tradeoff Between Yield Potential and Yield Stability
Many may have heard of this difference. Even you if have not directly of these concepts, most in Oklahoma will be familiar with the trade-offs
Yield potential refers to the maximum yield a crop can achieve when environmental conditions are favorable, and resources are not limiting.
Yield stability refers to a crop’s ability to maintain performance across varying environmental conditions, including drought, heat stress, and erratic rainfall.
These two characteristics are often related, but they are not always aligned.
High vegetative growth frequently possesses greater yield potential because they can intercept more sunlight and support more reproductive structures. However, those same plants often require greater amounts of water throughout the season.
In contrast, plants with more moderate growth habits may have slightly lower maximum yield potential, but they often maintain more consistent performance when environmental stresses occur.
So the difference between excessive, adequate, and too low vegetative production is not consistent and is impacted by a part of the year not yet experienced.
For producers in the Southern Great Plains, where growing conditions can change dramatically from one season to the next, yield stability can be just as important as maximum yield potential.
Why More Growth Often Means More Yield Potential
The relationship between vegetative growth and yield begins with photosynthesis.
More leaves generally mean:
- Greater sunlight interception
- Greater photosynthetic capacity
- More carbohydrate production
- More potential reproductive sites
And when we are talking about farming, what we are often farming is the sunlight indirectly through the crops we are growing. Therefore, the higher amount of sunlight that can be captured, this higher potential yield can be.
In soybean, larger plants often produce more nodes and branches, creating additional locations for pod formation.
In grain sorghum, larger canopies can support greater grain production when moisture remains adequate through grain fill.
In corn, larger plants often contribute to greater kernel production and kernel weight under favorable conditions.
Because of these relationships, management practices that encourage vigorous growth are frequently associated with high yield environments.
The key phrase, however, is under favorable conditions.
The Hidden Cost of Large Plants
Every leaf that captures sunlight also loses water.
As plant size increases, so does transpiration demand. Larger plants require more water simply to maintain normal physiological activity.
This creates a challenge in many Oklahoma production environments.
Rainfall is often adequate during early vegetative development, allowing crops to establish large canopies and accumulate substantial biomass (often during the months of April and early May). However, the period from flowering through grain fill frequently coincides with:
- Higher temperatures
- Greater evaporative demand
- Less reliable rainfall
- Increasing soil moisture depletion
This can be a two-fold issue. One, higher vegetative production early could have utilized and drained total surface and subsurface moisture, which is now not available during reproductive growth. However, it also increased daily moisture demand. This can result in with similar soil moisture and rainfall, a smaller plant will have a lower moisture demand than a larger plant.
The consequence is often a reduction in grain or seed production precisely when yield is being determined.
Soybean: A Classic Example
Soybean perhaps provides the best illustration of this concept.
When moisture is abundant, larger soybean plants can be extremely productive. Additional nodes and branches create opportunities for greater pod production, and large canopies intercept significant amounts of sunlight.
However, soybean also possesses one of the longest reproductive periods among major summer crops.
A soybean crop must successfully retain flowers, maintain pods, and fill seeds over an extended period. Water stress at any point during this process can reduce yield.
Large soybean plants often consume considerable amounts of water during vegetative growth. If drought develops during pod set or seed fill, those plants may experience:
- Increased flower abortion
- Increased pod abortion
- Reduced seed size
- Premature canopy senescence
In contrast, a more moderate-sized soybean plant may use less water during early development and preserve soil moisture for reproductive growth.
While that plant may possess fewer nodes or branches and therefore slightly lower maximum yield potential, it may be better positioned to maintain yield under stressful conditions.
Seeing this in practice
As shown in Figure 1, plant growth regulation substantially reduced soybean height compared to untreated plants. Three weeks after treatment implementation, regulated plants ranged from 5–10 inches shorter than untreated plants. These reductions in height were accompanied by fewer mainstem nodes, but plants compensated by producing more branch nodes and increasing canopy coverage. The response was relatively consistent across both growing seasons, demonstrating that soybean plants can modify their growth habit when mainstem development is restricted.
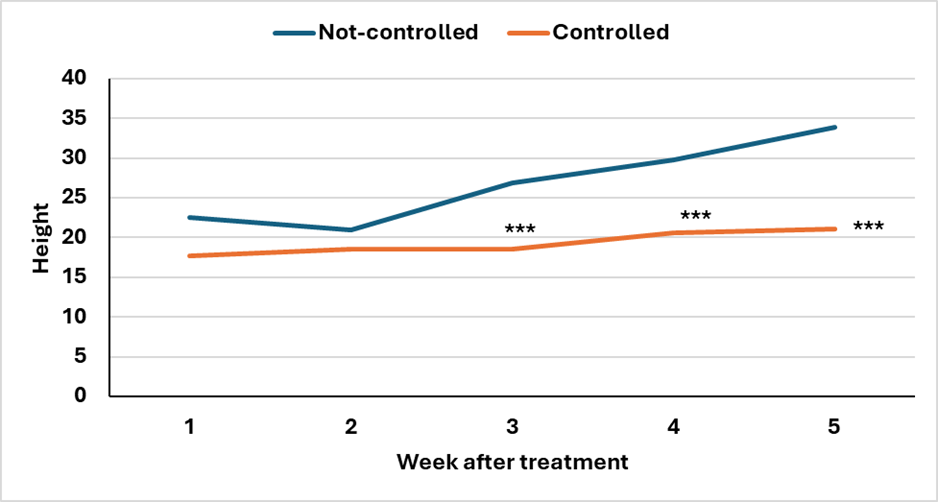
Figure 1. Impact of plant growth regulation (physical removal) on soybean plant height compared to untreated plants. Data were collected across the 2022 and 2023 growing seasons.
While reduced plant size altered canopy architecture, the impact on yield differed substantially between years (Figure 2). In 2022, when environmental conditions were generally favorable and resources were less limiting, plant growth regulation did not improve yield. In fact, yields were slightly lower than the untreated control. This response likely reflects the reduced yield potential associated with smaller plants, as larger soybean canopies often intercept more light, accumulate greater biomass, and support higher seed production when adequate moisture is available throughout the season.
However, the response was markedly different during 2023, when moisture became increasingly limiting later in the growing season. Under these conditions, regulated plants significantly outyielded the untreated plants. The smaller canopy likely reduced seasonal water use and delayed soil moisture depletion, leaving more water available during critical reproductive growth stages. In contrast, larger untreated plants developed greater vegetative biomass and therefore higher water demand earlier in the season. Although these larger plants possessed greater theoretical yield potential, they were more susceptible to late-season drought stress when water availability became limited.
These results illustrate an important principle for summer crop production systems in water-limited environments. Larger plants often possess higher yield ceilings because of their greater vegetative growth and capacity to capture resources. However, that same vegetative growth can increase transpiration demand and accelerate soil water depletion, increasing the risk of yield loss if drought develops later in the season. Smaller plants may not achieve the same maximum yield potential in favorable years, but they often provide greater yield stability by reducing water demand and preserving resources for reproductive development. Consequently, the optimal plant size is often a balance between maximizing yield potential and minimizing drought risk, particularly in environments such as Oklahoma where late-season moisture stress is common.
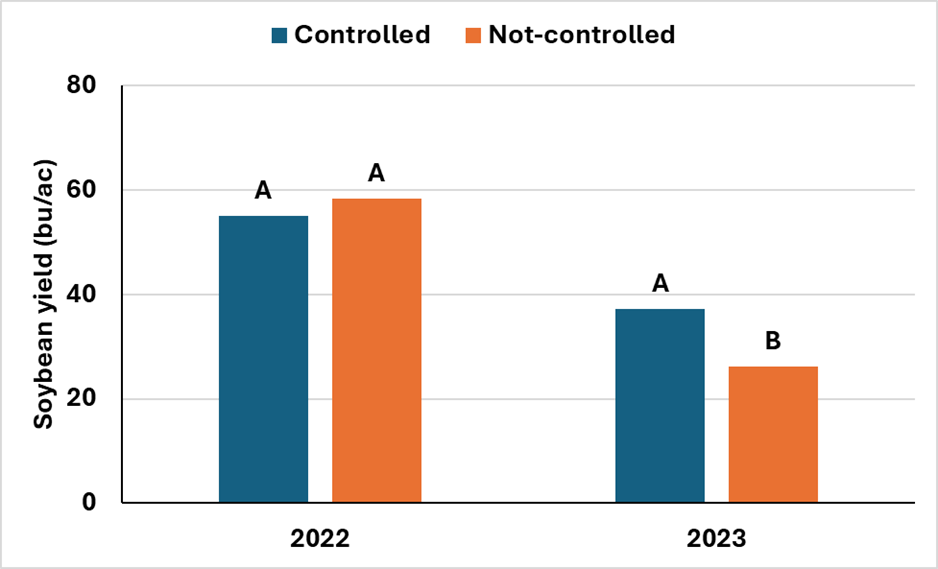
Figure 2. Impact of plant height regulation on soybean yield during the 2022 and 2023 growing seasons. Yield responses differed between years, highlighting the tradeoff between maximum yield potential and yield stability under water-limited conditions.
Lessons from Grain Sorghum
Grain sorghum offers another excellent example.
One reason sorghum has traditionally been viewed as a drought-adapted crop is its ability to regulate water use throughout the season. Traits such as leaf rolling, reduced transpiration, and stay-green characteristics help preserve plant function during grain fill.
Many of these mechanisms do not necessarily maximize growth early in the season. Instead, they improve the likelihood that the crop can complete grain development under stressful conditions.
This strategy may occasionally sacrifice maximum yield potential in highly favorable years, but it often improves yield stability across multiple growing seasons.
Managing for Consistency Versus Chasing Maximum Yield
One of the most important questions growers must answer is whether they are managing for maximum yield potential or maximum yield consistency.
In highly productive environments with irrigation or reliable rainfall, encouraging aggressive vegetative growth may be appropriate because water limitations are less likely to restrict grain fill.
In contrast, dryland production systems throughout much of Oklahoma often reward a more balanced approach.
The goal is not necessarily to produce the largest crop canopy possible. Rather, it is to produce enough canopy to efficiently intercept sunlight while preserving sufficient water to support reproductive growth later in the season.
Bigger Isn’t Always Better—Especially in Dryland Systems
This does not mean smaller plants are inherently superior.
A very small plant may lack sufficient leaf area to fully utilize available sunlight and may never achieve high yield potential regardless of rainfall conditions.
The ideal crop is rarely the smallest or the largest plant in the field.
Instead, the most successful crops are often those that achieve a balance between vegetative growth and resource conservation.
They develop enough biomass to support high levels of photosynthesis while avoiding excessive water consumption before reproduction begins.
Final Thoughts
Across Oklahoma and the Southern Great Plains, crop production is often a matter of managing risk as much as maximizing yield.
Larger plants frequently possess greater yield potential because they capture more sunlight and produce more biomass. However, that potential comes with increased water demand. When rainfall becomes limiting during flowering, grain fill, pod set, or seed development, those larger plants can become more vulnerable to stress.
Smaller or more moderately sized plants may not always produce the highest yields in ideal environments. However, they often provide greater yield stability because they conserve resources and maintain reproductive growth when environmental conditions deteriorate.
For soybean in particular, this tradeoff is frequently observed. The largest plants in July are not always the highest-yielding plants in October. More often, the most successful plants are those that balance growth with resource conservation, preserving enough water to support reproduction when it matters most.
In the Southern Great Plains, where late-season drought remains one of the greatest limitations to crop production, understanding the difference between yield potential and yield stability may be just as important as understanding yield itself.
Corn Leafhopper Detected in Southwest Oklahoma – What Growers Need to Know to Reduce Risk of Corn Stunt Disease
Maíra R. Duffeck: OSU Field Crops Extension Pathologist, Department of Entomology and Plant Pathology
Ashleigh Faris, OSU Field Crops Extension Entomologist, Department of Entomology and Plant Pathology
On June 5, 2026, the first corn leafhoppers of the year were detected in a corn field near Fort Cobb in Caddo County, Oklahoma. The insects were collected from grain corn by Dr. Maira Duffeck’s Row Crop Pathology team, and its identification was subsequently confirmed by Dr. Ashleigh Faris, OSU State Extension Entomologist for Cropping Systems.
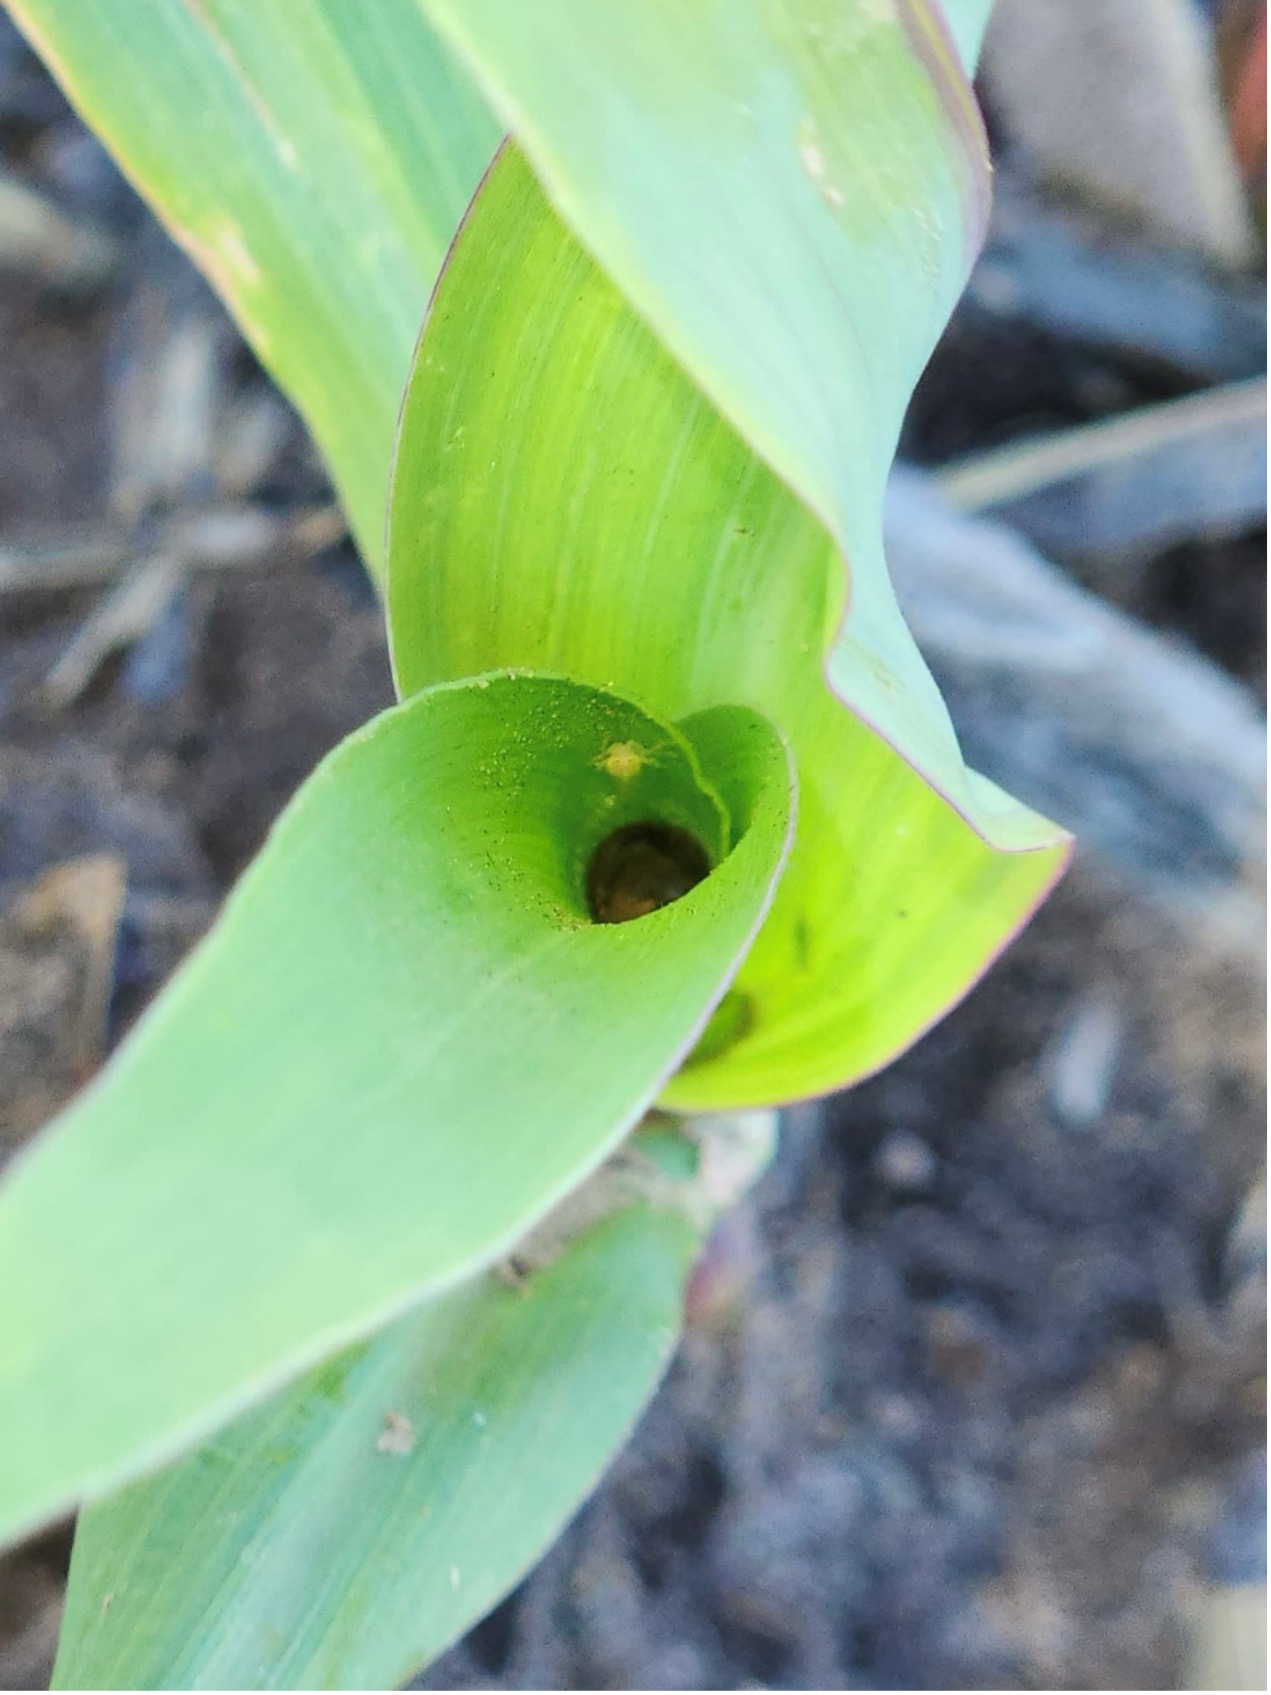
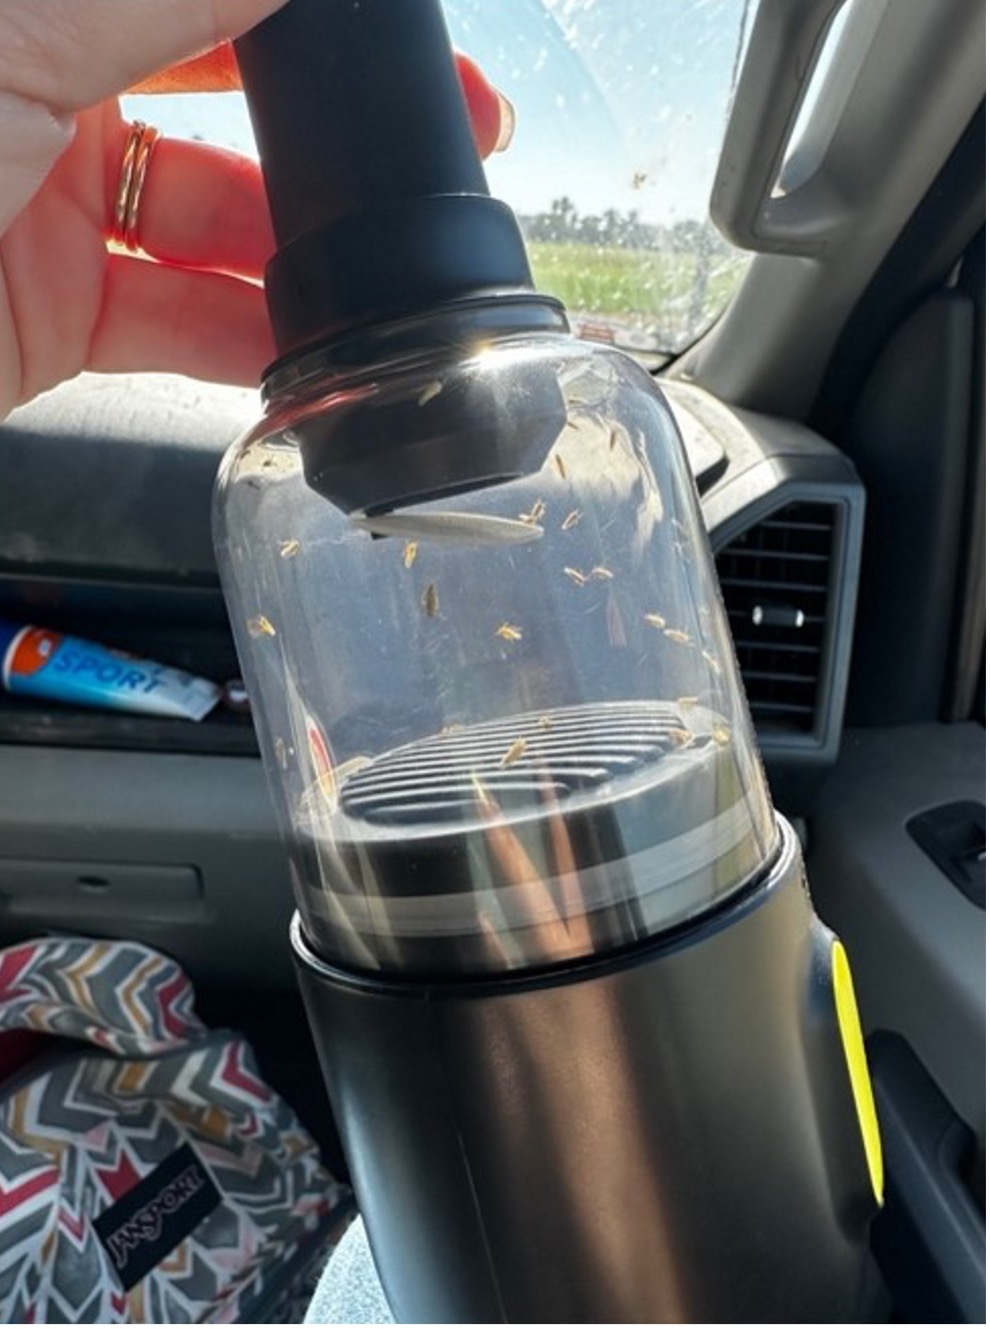
The two corn leafhoppers specimens were collected from within the whorls of V6-stage corn plants during routine field scouting. Specimens were collected using a cordless vacuum for identification and documentation. In addition, one corn leafhopper was captured on a yellow sticky trap installed at the edge of the field. The trap has been monitored and replaced weekly since planting as part of ongoing surveillance efforts.
This 2026 detection occurred 18 days earlier than the first corn leafhopper detection reported in Oklahoma during 2025. Due to delayed planting associated with drought conditions, much of the corn across the state is currently at vegetative growth stages compared to this same time last year. This situation raises concerns about the potential transmission of corn stunt pathogens by corn leafhoppers.
Research outside of the U.S. has shown that corn plants are most susceptible to infection by corn stunt pathogens during the vegetative growth stages, from emergence (VE) through tasseling (VT). However, infection can also occur during the early reproductive stages. Early infection can result in significant yield losses because affected plants have a longer period to develop symptoms and experience reductions in growth and grain production.
It is not yet known if the corn leafhoppers detected in Oklahoma are carrying corn stunt pathogens, therefore growers should assume that any corn leafhopper has the potential to be infectious. Consequently, management efforts should focus on early detection and suppression of corn leafhopper populations, particularly in fields with corn at vulnerable vegetative growth stages. Regular scouting and timely management decisions will be critical for reducing the risk of corn stunt development during the 2026 growing season.
The Insect Identification
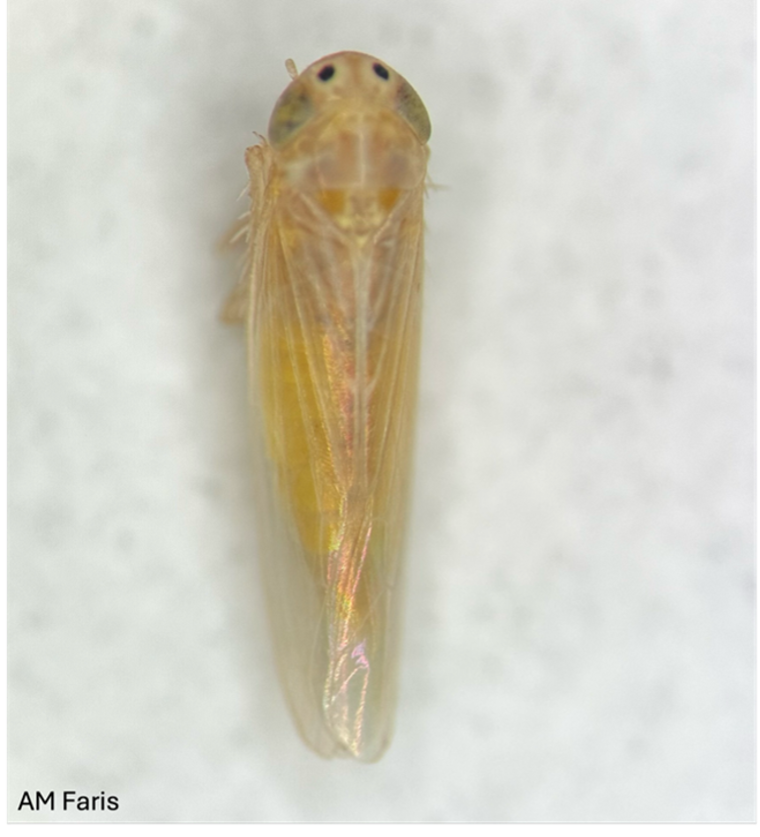
The corn leafhopper is a small insect, approximately 1/8 inch long (about the size of a grain of rice), with a yellow to tan body color. Adults are characterized by two small black spots surrounded by lighter-colored halos located between the eyes (Figure 1), as well as a clean face meaning there are no additional markings on the head or body. It is important to note that many leafhopper species also possess two spots between their eyes, however, these other leafhoppers will also have other dark marks on their head and/or face.
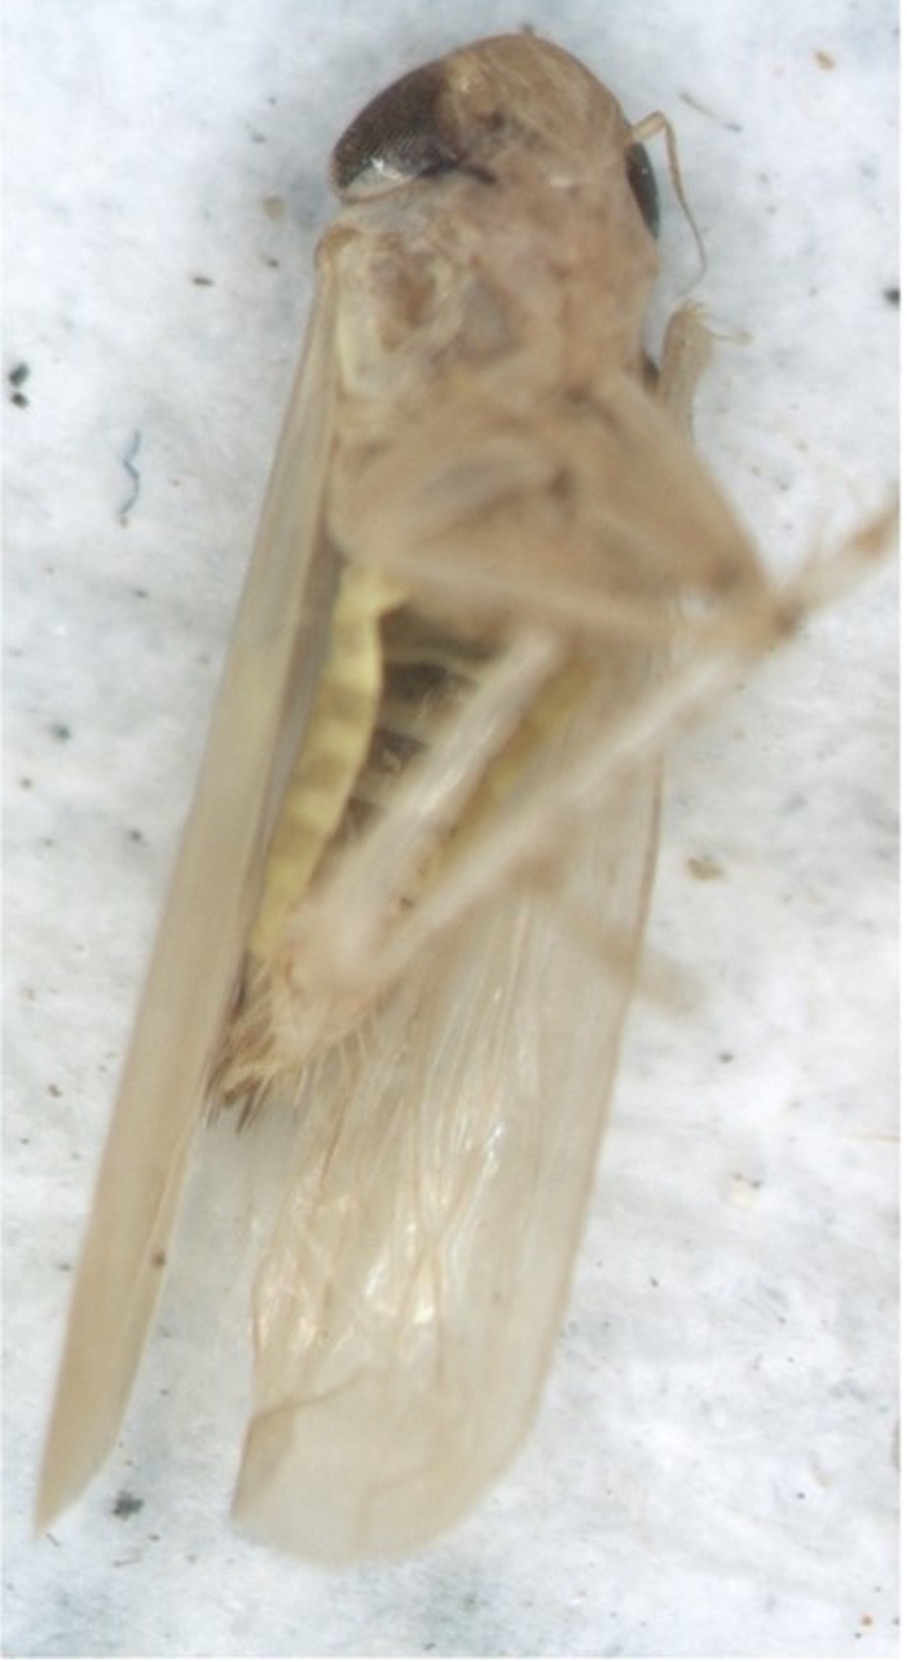
To distinguish corn leafhoppers from other leafhopper species, look for the combination of the two black spots with halos and the absence of additional markings. Corn leafhoppers do not have spots, stripes, or other markings on their wings, back, abdomen, face, or the top of the head (Figure 2). For mor information on how to distinguish the corn leafhopper from other commonly occurring leafhoppers see OSU e-Pest Alert EPP-25-24.
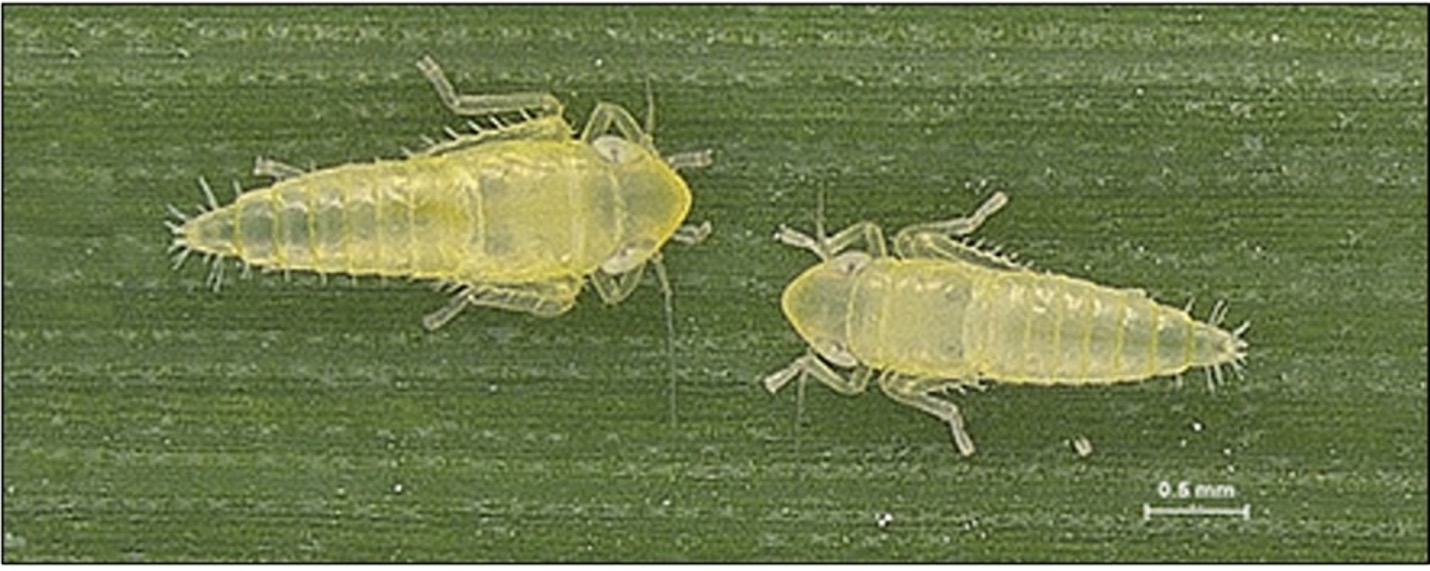
The immature or nymphal stage is wingless and resembles a smaller version of the adult. Nymphs may also lack the characteristic black spots and halos found on adults (Figure 3), making identification more challenging.
For additional information on corn leafhopper identification, biology, life cycle, and its role in transmitting corn stunt pathogens, see OSU E-Pest Alert EPP-23-17 and OSU e-Pest Alert EPP-25-29.
Scouting Tips and Guidance
Corn leafhoppers can be difficult to detect due to their small size, preference for hiding deep within the whorls of developing corn plants, and their rapid darting movement when disturbed. Because of these behaviors, effective scouting requires a combination of methods, including vacuum sampling, sweep net sampling, and direct visual inspection. Check the borders and edges of corn fields first as this is where most early migrators will be found.
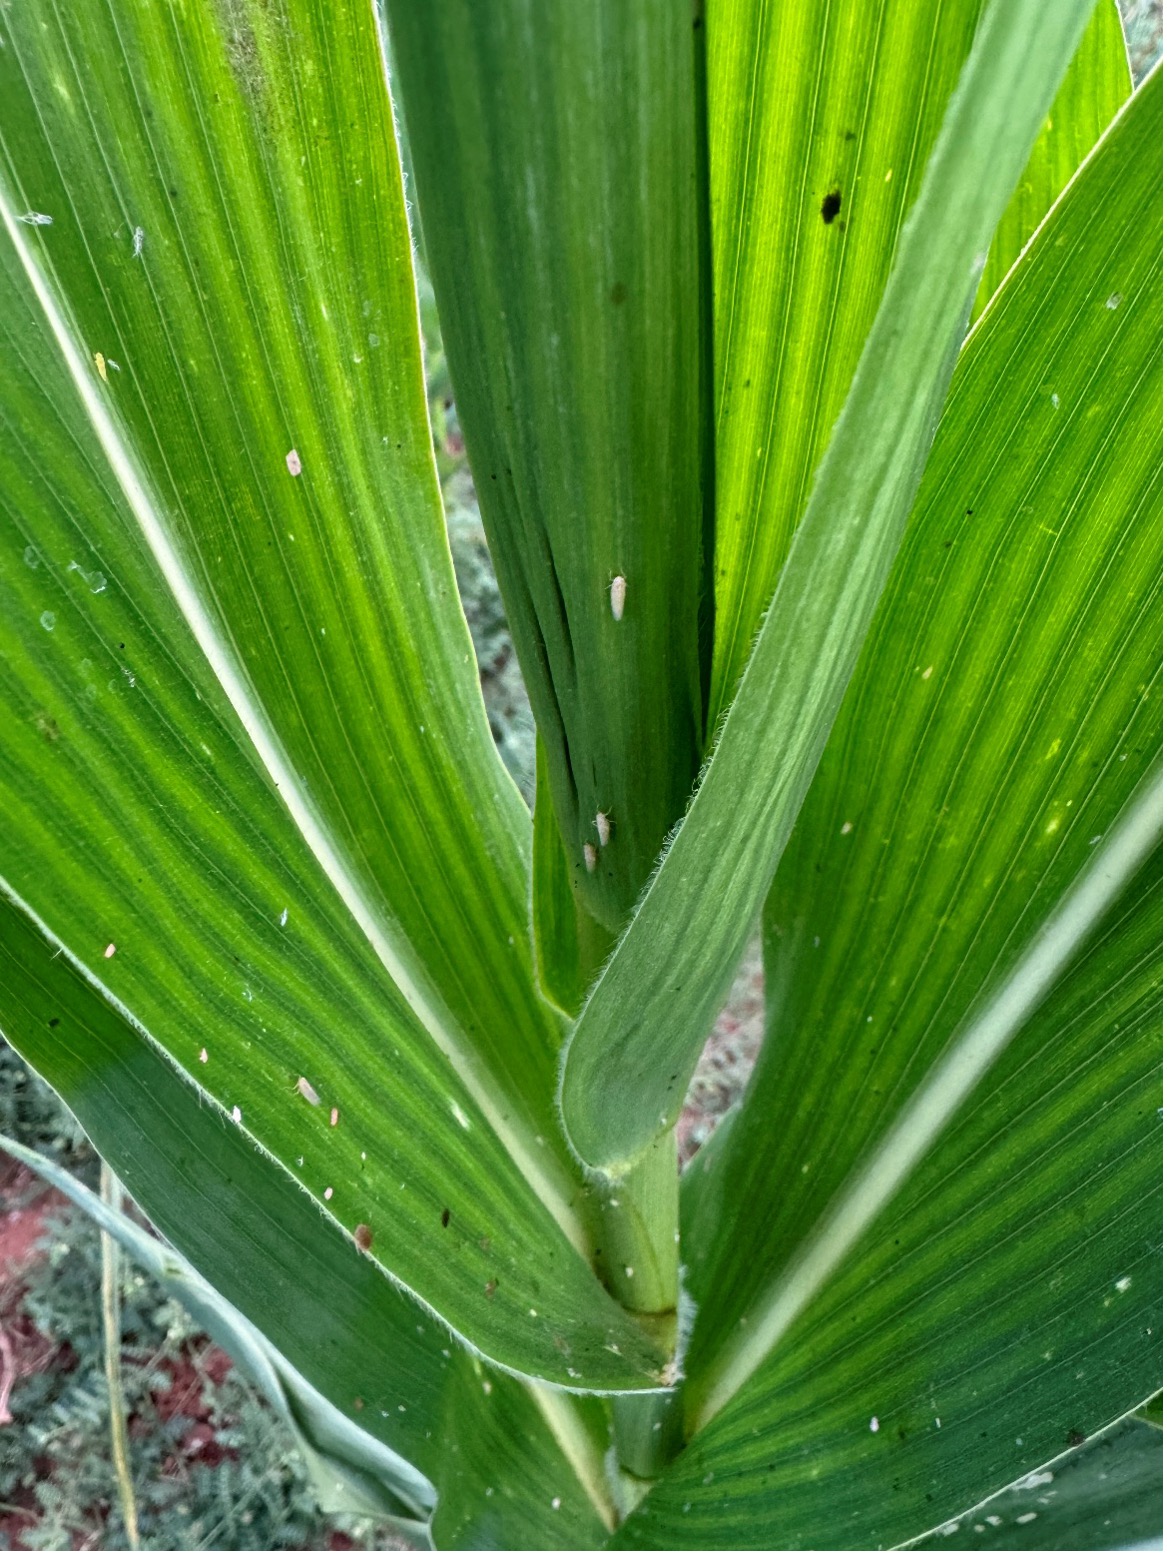
During vegetative growth stages, plants should be carefully examined by inspecting the whorls, where corn leafhoppers often remain concealed (Figure 4 and 5). Individuals may be dislodged from the whorl using a cordless vacuum (Figure 6) or cordless leaf blower equipped with thigh high stockings to capture collected leafhoppers. Vacuum several whorls, randomly at the field borders, moving into the interior of the field.
Sweep net sampling is another useful scouting tool. When walking through corn rows, the net should be swept side-to-side in a figure-eight motion over the canopy and across plants on both sides of the row. After several sweeps, the net should be carefully closed, and contents slowly examined for the presence of corn leafhoppers. As the crop transitions into reproductive stages, sweep netting should be adjusted to target the lower portion up to through the upper and mid-canopy by sweeping up and down along the sides of the corn plants.
Visual inspection remains an important component of scouting throughout both vegetative and reproductive stages. In vegetative corn, focus on whorl inspection. As the canopy closes and plants reach reproductive stages, examine the underside of leaves where leafhoppers may congregate. Check the underside of lower leaves for nymphs. When entering a field, pause periodically to allow leafhoppers to settle, then slowly observe surrounding plants before moving forward.
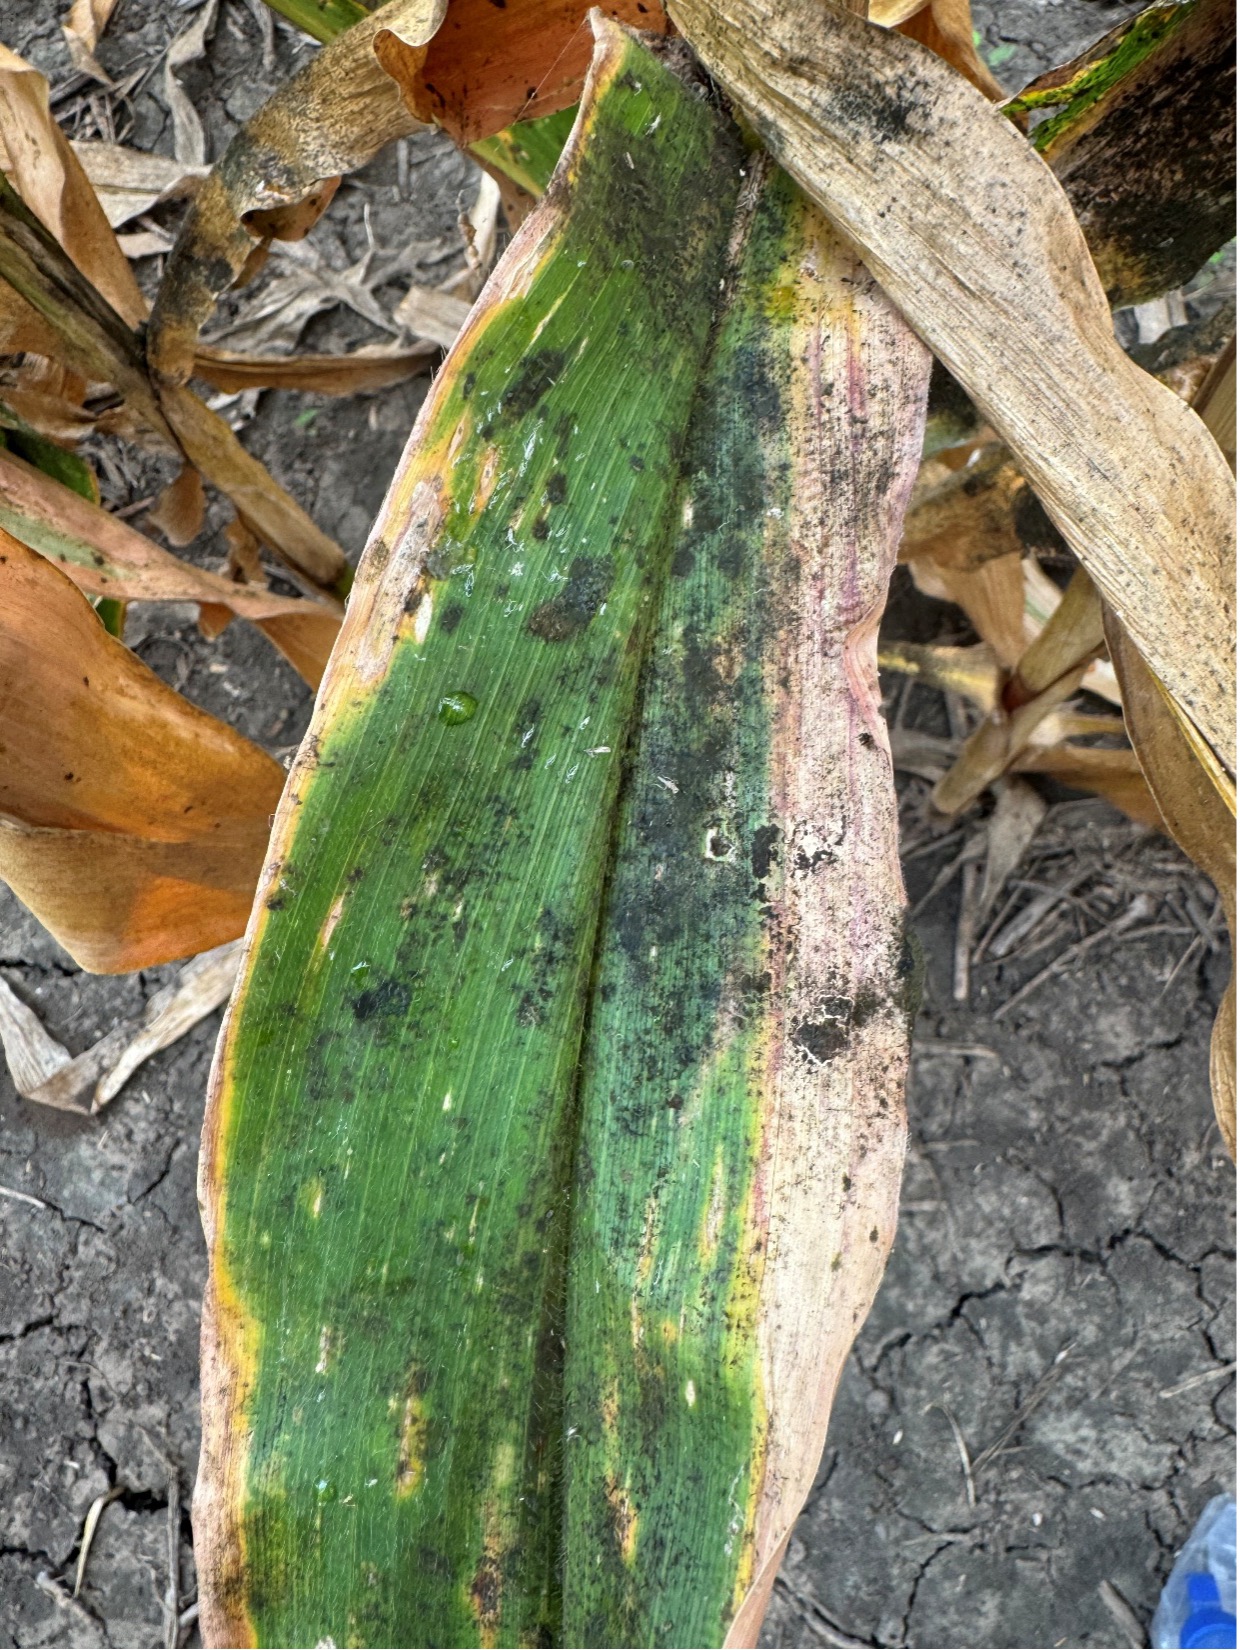
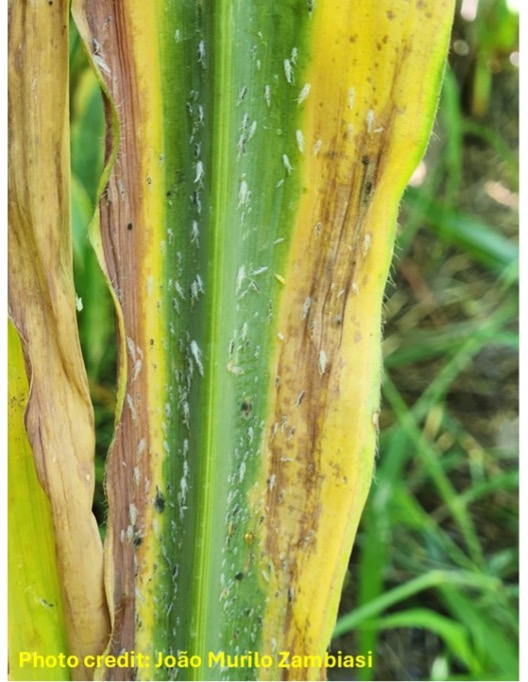
In addition to the insects themselves, other indicators of corn leafhopper presence include honeydew deposits, which appear shiny and feel sticky, the development of black sooty mold growing on honeydew (Figure 7), and the presence of white or translucent cast skins (exuviae) resulting from molting (Figure 8).
Current Integrated Pest Management (IPM) Guidance for Corn Leafhoppers
Pre-planting and Planting Decisions
There are currently no known corn stunt resistant hybrids available on the U.S. market. In areas where volunteer corn is present, growers should remove it as this vegetation serves as a reproductive resource for the insect and a potential reservoir for corn stunt pathogens. When possible, growers are encouraged to plant corn early, as this will help reduce the likelihood of corn being planted when corn leafhoppers are present. In areas where corn leafhoppers will be present at planting, growers should use a high insecticide seed treatment containing Cruiser® Corn 1250 or Poncho® 1250 to allow for protection of early vegetative stages. Trials conducted by Texas A&M AgriLife Research and Extension indicate that 500 and 1250 rates of the insecticide seed treatments suppress corn leafhopper adults through V5 and suppress nymphs (or egg laying) at least until V10. The higher 1250 rates of insecticide seed treatment outperformed the lower 500 rates.
Scout for the Corn Leafhopper
Follow the scouting guidance outlined above to monitor for the insect. Due to the efficiency of corn leafhoppers in transmitting pathogens associated with corn stunt disease, no economic threshold has been established at this time. As a result, growers are encouraged to manage corn leafhopper populations when they are detected in the field.
At present, the exact corn growth stage at which scouting should cease is not known. Previous guidance suggested continuing scouting through the V8 growth stage; however, based on past observations by state Extension personnel, recommendations have been extended to encourage growers to continue managing corn leafhopper populations through the R1 or R2 growth stages. More research is needed to determine the cutoff point for insect management under U.S. crop production conditions.
Chemical Control Options
Results from foliar insecticide efficacy trials conducted in 2025 by Dr. Ashleigh Faris at Oklahoma State University, and by personnel at Texas A&M AgriLife Research and Extension, provide insight into current foliar management options for corn leafhopper.
In these studies, pyrethroid insecticides and dimethoate were largely ineffective against corn leafhoppers. Foliar applications of indoxacarb at 8 – 10 fl. oz./A rate and flupyradifurone at 7 fl. oz./A rate provided up to 14 days of suppression for corn leafhopper nymphs. Thiamethoxam and lambda-cyhalothrin at 10 fl. oz./A rate provided similar nymph suppression for 14 days. If applying a foliar insecticide prior to tassel, applicators should not use a non-ionic surfactant (NIS) as an adjuvant. An NIS applied pre-tassel, particularly mid to late vegetative stages (V6-VT) can result in arrested ear development which causes “baby” or stunted ears/cobs with reduced or absent kernels, underdeveloped husks, poor or absent silk emergence and reddish/purple leaves These symptoms can appear like corn stunt disease symptoms; however, confirmation of corn stunt disease pathogens can only be done through molecular testing.
When selecting an insecticide, growers should prioritize products that are not broad-spectrum and that are less disruptive to beneficial arthropods, to preserve natural biological control in the agroecosystem. Insecticide applications should only be made when corn leafhoppers are confirmed to be present in the field being treated. As with all pest management decisions, the insecticide label must be followed; the label is the law.
Integrated pest management (IPM) recommendations for corn leafhopper will continue to evolve as additional research becomes available under Oklahoma growing conditions. Growers are encouraged to stay updated through future OSU Pest e-Alerts and to follow Cropping Systems Extension Entomologist Dr. Ashleigh Faris (@OSU_crop_insects) and OSU Field Crops Pathologist Dr. Maira Duffeck (@osu.plantpath) on Instagram for ongoing updates on corn leafhopper and corn stunt disease distribution in the state and results from 2026 insecticide efficacy trials.
Banding P for Acidic Soils: Its not the time to be paying for poor practice.
I am bringing this topic back to the surface now with the current outlook on phosphorus fertilizer. If you have heard its not only becoming more expensive but the supply is short and will likely stay short through summer into the fall, which wont help prices. So this year’s wheat crop, we need to be prepared to be smart with Phosphorus, and applying an extra 30lbs to band aid for soil acidity should not be in the cards. Look at it this way, if the phosphorus was at $0.66 a lb that $20 that could be spent on a ton of lime. That lime will last 3-5 years, while that P needs to be added every year. Not only that, but the lime will help root growth (better when we dry up), produce significantly more biomass, and make the phosphorus you’ve applied in the past available again for plant uptake. So make the plans now to soil sample as soon as this crop is off, you can get a soil test recommendation and plan for the lime trucks. This is also not the year to just apply phosphorus for the sake of applying. Soil tests are inexpensive relative to buying excess fertilizer.
Current quotes on 4.24.26 are at $0.54 + per lbs P2O5 with DAP at $830 a ton.
Quick Fertilizer Price Calculation:
Urea at $860 a ton means N is $0.93 a lbs.
DAP at $830 has $334 worth of $0.93 nitrogen and $495 of phosphorus at $0.54 a lb.
Banding P as a band-aid for soil acidity, not so cheap now.
Original Blog Posted in 2021
Whoi Cho, PhD student Ag Economics advised by Dr. Wade Brorsen
Raedan Sharry, PhD Student Soil Science advised by Dr. Brian Arnall
Brian Arnall, Precision Nutrient Management Extension.
In 2014 I wrote the blog Banding P as a Band-Aid for low-pH soils. Banding phosphate to alleviate soil acidity has been a long practiced approach in the southern Great Plains. The blog that follows is a summary of a recent publication that re-evaluated this practices economic viability.
Many Oklahoma wheat fields are impacted by soil acidity and the associated aluminum (Al) toxicity that comes with the low soil pH. The increased availability of the toxic AL3+ leads to reduced grain and forage yields by impacting the ability of the plant to reach important nutrients and moisture by inhibiting root growth. Aluminum can also tie up phosphorus in the soil, further intensifying the negative effects of soil acidity. More on the causes and implication of soil acidity can be found in factsheet PSS-2239 or here (https://extension.okstate.edu/fact-sheets/cause-and-effects-of-soil-acidity.html). The acidification of many of Oklahoma’s fields has left producers with important choices on how to best manage their fields to maximize profit.

Two specific management strategies are widely utilized in Oklahoma to counter the negative impacts of soil acidification: Lime application and banding phosphorus (P) fertilizer with seed. While banding P with seed ties up Al allowing the crop to grow, this effect is only temporary, and application will be required every year. The effects of liming are longer lasting and corrects soil acidity instead of just relieving Al toxicity. Historically banding P has been a popular alternative to liming largely due to the much lower initial cost of application. However, as P fertilizers continue to increase in cost the choice between banding P and liming needed to be reconsidered.
A recent study by Cho et al.,2020 compared the profitability of liming versus banding P in a continuous wheat system considering the impacts that lime cost, wheat price and yield goal has on the comparison. This work compared the net present value (NPV) of lime and banded P. The study considered yield goal level (40 and 60 bu/ac) as well as the price of P2O5 fertilizer and Ag Lime. The price of P2O5 used in this study was $0.43 lb-1 while lime price was dictated by distance from quarry, close to quarry being approximately $43 ton-1 and far being $81 ton-1. For all intents and purposes these lime values are equivalent to total lime cost including application. Wheat prices utilized in the study were $5.10 bu-1 and $7.91 bu-1. It is important to note that baseline yield level was not considered sustainable under banded P management in this analysis. This resulted in a decrease in yield of approximately 3.2 bu ac-1 per year. This is attributable to the expected continued decline in pH when banding P is the management technique of choice.
The analysis in this work showed that lime application is cost prohibitive in the short term (1 year) when compared with banding P regardless of lime cost, yield goal level, and wheat value (within the scope of this study). This same result can be seen over a two-year span when yield is at the lower level (40 bu ac-1). While in the short-term banding P was shown to be a viable alternative to liming, as producers are able to control ground longer lime application becomes the more appealing option, especially when producers can plan for more than 3 years of future production. In fact, under no set of circumstances did banding P provide greater economic return than liming regardless of crop value, yield, or liming cost when more than 3 years of production were considered and only under one scenario did banded P provide a higher NPV in a 3-year planning horizon.
While historically banding P was a profitable alternative to lime application for many wheat producers the situation has likely drastically changed. At the time of writing this blog (09/17/2021) Diammonium Phosphate (DAP) at the Two Rivers Cooperative was priced at $0.78 lb-1. of P2O5. This is a drastic increase in P cost over the last year or so since Cho et al. was published in 2020. With P fertilizer prices remaining high it will be important for producers to continue to consider the value of liming compared to banded P. This is particularly crucial for those producers who can make plans over a longer time frame, especially those more than 3 years.
Addendum: As fertilizer prices have continued to rise a quick analysis utilizing the $0.78 lb-1 of P2O5was completed to consider the higher P fertilizer cost. Under this analysis an estimated decrease in NPV of approximately $38 an acre for P banding occurred. When considering this change in NPV, lime application becomes the more profitable option for alleviation of soil acidity symptoms even in the short term (assuming lime price values are equivalent to the previous analysis). This underlines the fact that it is imperative to consider the impact on profitability of the liming vs. banding P decision in the current economic climate for agricultural inputs.
Link to the Open Access Peer Reviewed publication “Banding of phosphorus as an alternative to lime for wheat in acid soil” https://doi.org/10.1002/agg2.20071
Green Peach Aphids Are Showing Up in Oklahoma Canola
Ashleigh Faris, Cropping Systems Extension Entomologist
Josh Lofton, Cropping Systems Extension Agronomist
Recent reports from growers in north central Oklahoma indicate increased green peach aphid activity in winter canola. Although green peach aphid is often overshadowed by cabbage aphid and turnip aphid, it can cause significant damage through direct feeding and by transmitting plant viruses. Given current field reports and ongoing dry conditions, producers should scout fields now and determine whether treatment thresholds have been reached.
Green Peach Aphid Identification
Accurate identification is the first step in management because green peach aphid behaves differently than other aphid species and is often more resistant to certain insecticides.
Appearance: Green peach aphids are small, about 1.5 to 2.5 mm long, and vary in color from pale green to yellow or pinkish. Unlike cabbage aphids, they do not have a thick, waxy or powdery covering. One of the most important identifying features is the presence of prominent swellings at the base of the antennae, that point inward and create a distinct “W” or “U” shape between the antennae (Figure 1). Their cornicles (tailpipes) are relatively long and usually match body color, although the tips may appear slightly darker.

Figure 1. Green peach aphid adult and nymphs. Image courtesy invasive.org.
Differentiating Green Peach Aphid from Other Aphid Species
Cabbage aphids are typically covered in a grayish-white waxy bloom (Figure 2) and often form dense, crusty colonies on the youngest leaves and flower stalks. Turnip aphids are light green and lack the waxy bloom seen on cabbage aphids. They often have dark bands across the abdomen (Figure 3).
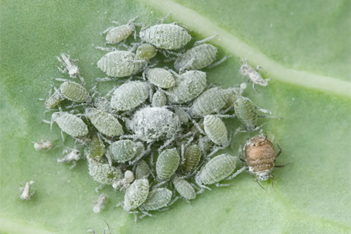
Figure 2. Cabbage aphid adults and nymphs. The brown, globular aphid in the bottom right has been parasitized (aphid mummy). Image courtesy biologicalservices.com/au.
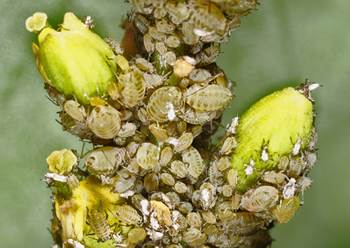
Figure 3. Turnip aphid adults and nymphs. Image courtesy Claude Pilon.
Green Peach Aphid Scouting and Distribution
Green peach aphids typically colonize the undersides of lower leaves first. This differs from cabbage aphids, which more often infest terminal buds and flower stalks.
Where to look: Focus on the undersides of leaves in the mid- to lower canopy. Green peach aphids are often solitary or found in small, scattered groups rather than the large, tight colonies commonly associated with cabbage aphids.
Sampling: Examine 5 to 10 plants in at least 10 different areas of the field.
Signs of injury: Watch for yellowing (chlorosis), leaf curling, or stunted growth, which are common symptoms of green peach aphids feeding.
Green Peach Aphid Management and Thresholds
Because canola can compensate for some early-season feeding injury, insecticide applications should be based on established thresholds.
Economic threshold: Treatment is generally recommended when populations reach 50 to 100 aphids per plant before flowering. Use the lower end of that range when the crop is moisture stressed. From budding to early bloom, treatment may be justified when 20% of racemes are infested with 25 to 50 or more aphids. For cabbage aphid, the comparable threshold is 15% infested racemes. Oklahoma State University research suggests that an average of one turnip aphid or one green peach aphid per plant during reproductive stages may result in approximately 0.5 lb/acre of yield loss. Treatment decisions should always be weighed against crop value and application cost.
Biological control: Before spraying, check for beneficial insects such as lady beetles, lacewings, and parasitic wasps. Aphid mummies are a good indicator of parasitism. When temperatures are warm enough for beneficials to remain active, they can substantially reduce aphid populations.
Chemical Control for Green Peach Aphid and Resistance Warning
Green peach aphids are well known for developing resistance to several insecticide classes, especially older pyrethroids and organophosphates.
Product Selection: Several insecticides are labeled for aphids in canola, but products containing sulfoxaflor (Transform WG) or flupyradifurone (Sivanto Prime) have generally shown strong efficacy against green peach aphid while being relatively less disruptive to beneficial insects. Be aware that some products have restrictions related to bloom timing, petal fall, and preharvest intervals. Always read and follow the label. For a list of registered insecticides and rates, refer to CR-7667: Management of Insect and Mite Pests in Canola.
Coverage: Because green peach aphid commonly feeds on the undersides of lower leaves, thorough coverage is critical. Use high carrier volumes of at least 10 to 15 gallons per acre for ground applications. For aerial applications, at least 10 gallons per acre is recommended.
The information given herein is for educational purposes only. Reference to commercial products or trade names is made with the understanding that no discrimination is intended and no endorsement by the Cooperative Extension Service is implied.
Mechanisms of Soil Fertility: Looking at Biologicals and MOA
Brian Arnall, Oklahoma State University Precision Nutrient Management
The use of biological products in commercial agriculture has expanded rapidly, with large corporations entering a space once dominated by smaller groups. This has created an arms race, with nearly every company offering a biological product. Over the past twenty years, I have had the opportunity to test products from the biggest groups with billions in backing, to solutions raised in stock tanks delivered in Braums milk jugs. It is critical to understand what is in the jug and the biological function it is expected to perform. Like herbicides, knowing the mode of action determines whether the product fits the intended purpose. No different than herbicides and knowing mode of actions. It’s important to know and understand that if you are trying to kill ryegrass 2.4-D, a broadleaf herbicide is not the right answer.
So what are we working with that’s in these products?
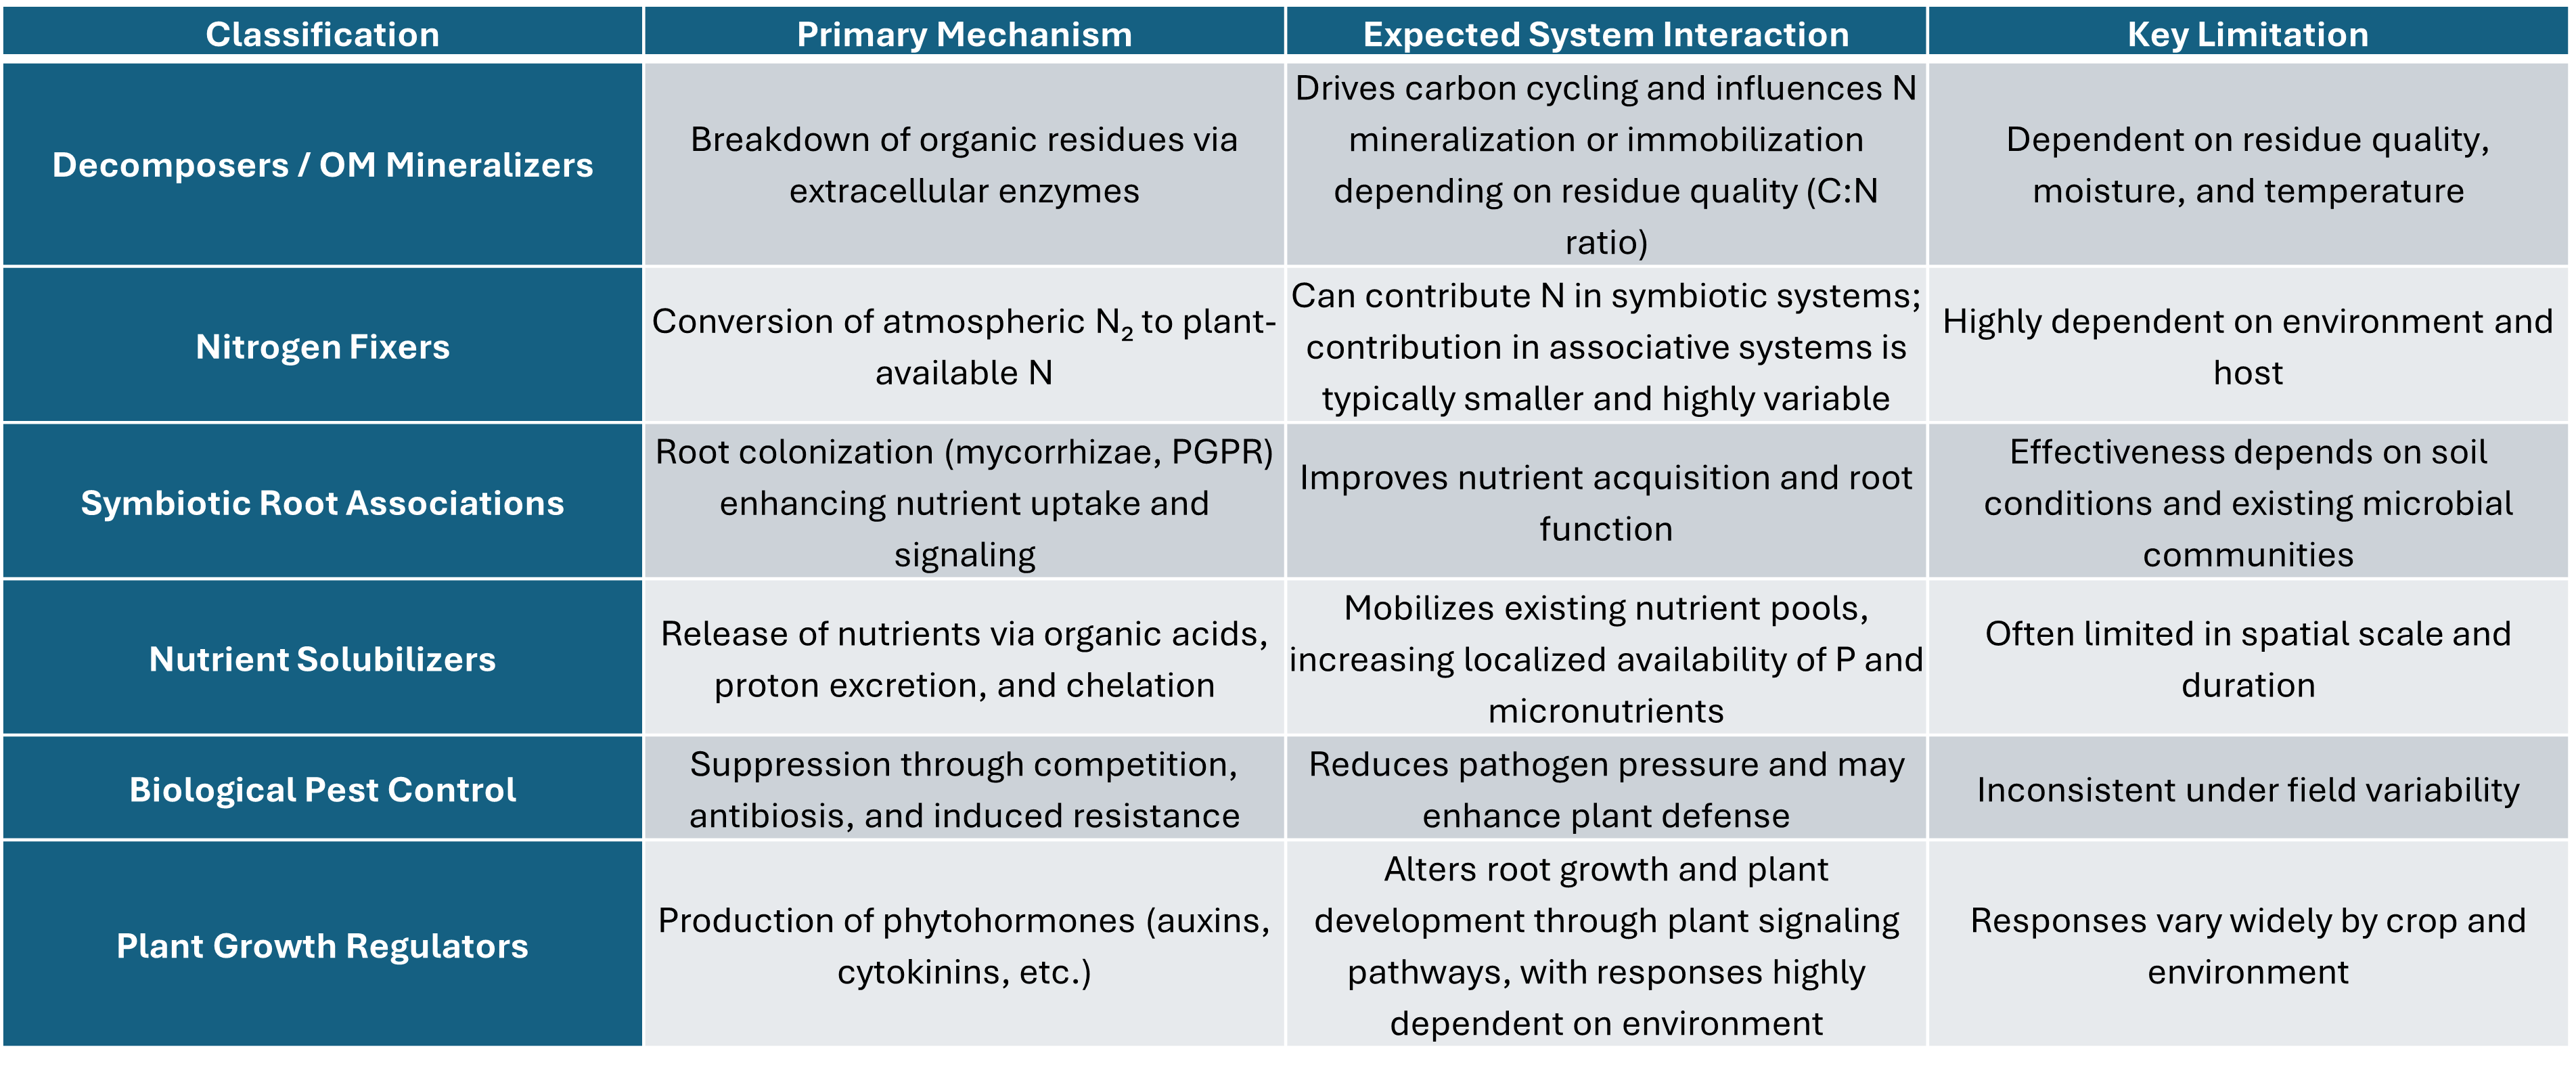
My approach has been to classify the products by operation not by species or genre. Doing so I have grouped products into five biological classifications and a sixth group, which is often in concluded in conversations.
Decomposers / Organic Matter Mineralizers
Nitrogen Fixers (Symbiotic and Associative)
Symbiotic Root Associations (Mycorrhizae, PGPR)
Nutrient Solubilizers
Biological Pest Control
Plant Growth Regulators (Hormonal Effects)
So, let’s dig into each of the mechanisms.
Decomposers / Organic Matter Mineralizers
Decomposition is carried out by a diverse group of organisms including fungi (e.g., Trichoderma, Aspergillus), bacteria (e.g., Bacillus, Pseudomonas), and actinomycetes (e.g., Streptomyces), each contributing to the breakdown of organic materials through different enzymatic pathways. This process of decomposing organic matter releases the nutrients tied up into plant available forms. The release of nitrogen is usually first thought, but this process adds significant amounts of potassium, calcium, and magnesium.
The process occurs both in the soil and on the soil surface. While it seems simple in application though this is a complex process. Let’s start with the soil pool, triggering decomposition of a system where the previous crop was wheat is significantly different than following corn. Following wheat, the carbon nitrogen ratio will be very high (see sugar blog), so while decomposition will release cations such as potassium and calcium, it is very likely to immobilize and residual nitrogen in the system. However, in fields that previously had corn the carbon to nitrogen ratio is much closer and the probability of seeing nitrogen release is much higher (Kuzyakov & Blagodatskaya, 2015). The process is similar for surface residues, but the rate is heavily controlled by rainfall. While both the soil and surface systems require moisture for the process to progress, the surface moisture is much more dynamic with frequent wetting and drying. Rain or irrigation is also needed to move the nutrients into the root zone.
One aspect of increasing decomposition of OM that I do not have a handle on is the long-term impact of expediting OM breakdown in and on the soil, especially in the central plains. As mentioned in the sugar blog, you would hope that the increase in nutrients from OM decomposition would increase plant growth enough to replenish the OM that was burned up. One caveat to this is that the decomposition would have to add nutrients that are deficient. Otherwise, there is no increase in plant growth and hypothetically the system is not net negative on OM. When it comes to decomposing surface residue, I have always been a bit hesitant in Oklahoma as I see having surface coverage to preserve soil moisture typically has a greater value than the nutrients from the residue.
Nitrogen Fixers (Symbiotic and Associative)
Nitrogen fixation is carried out by both symbiotic organisms such as Rhizobium and Bradyrhizobium, which form nodules on plant roots and supply significant nitrogen, and associative organisms such as Azospirillum and Azotobacter, which reside in the rhizosphere and contribute smaller, more variable amounts of nitrogen. Symbiotic nitrogen fixation, such as we have come to expect from legumes, is tightly regulated by the plant, with carbon supplied to the microbe in exchange for fixed nitrogen, making it one of the most efficient biological nitrogen inputs in agriculture.
Associative nitrogen fixation is not directly coupled to plant demand, and nitrogen contributions are typically limited by carbon availability and environmental conditions (Kennedy et al., 2004). While these organisms possess the ability to fix atmospheric nitrogen, the magnitude of nitrogen contribution, particularly from non-symbiotic systems, is highly variable and often limited under field conditions. We know that in soybean nodulation is greatly reduced when excess nitrogen is present in the soil, basically the plant does not need rhizobia, so it does not trigger symbiosis. I expect that as we move symbiotic fixation out of legumes that this mechanism does not change. Finally fixed N is no different than fertilizer N, if you add more then the crop needs, its lost. Therefore, if I am planning to use a N fixer, I would significantly reduce the amount of fertilizer N apply well below crop demand. Otherwise, the money spent on the N fixer is a waste. The only argument I have heard for this is the security blanket, making sure that if more is needed than normally the system is covered. But I circle back to the question about a system with high levels of residual N and rhizobium nodulation.
Symbiotic Root Associations (Mycorrhizae, PGPR)
Symbiotic root associations include arbuscular mycorrhizal fungi (e.g., Rhizophagus, Funneliformis) that extend the effective root system and improve nutrient uptake, particularly phosphorus, as well as plant growth-promoting rhizobacteria (e.g., Pseudomonas, Bacillus) that influence root development and plant signaling through multiple biochemical pathways (Smith & Read, 2008). In my visits with soil microbiologist, I have been left with the understanding that these relationships are not generic, but quite specific. There is significant influence of genotype and environment. And even more interesting is that the majority expect that the plant needs to signal for this relationship to happen.
The effectiveness of these associations is highly dependent on soil conditions, existing microbial communities, and nutrient availability, with responses often diminishing in systems where nutrients are not limited or where native populations are already established. I was able to follow along with some work down at OSU a few years back that was working with sorghum looking for symbiotic relationships to improve water and nutrient uptake specifically phosphorus. The work was successful, the researchers were able to identify a AMF that created a symbiotic relationship with sorghum, with a few caveats. First land race cultivars had a much higher incidence of symbiosis. For the landraces it worked well in extremely nutrient depleted soils and any additions of N or P reduced forage yield over the none. In the end the researchers were able to show improved the grain yield in landraces above fertilized, but these yields did equal fertilized hybrids. This work had great impact on small holders in developing counties with limited resources.
Nutrient Solubilizers
Nutrient solubilization is carried out by organisms such as Bacillus, Pseudomonas, and Aspergillus, which increase nutrient availability through mechanisms including organic acid production, proton release, and chelation, allowing nutrients like phosphorus and micronutrients to become more accessible in the rhizosphere.
Phosphorus-solubilizing fungi, such as Aspergillus and Penicillium, function similarly to bacterial solubilizers but are often more effective at producing strong organic acids. These acids can lower pH in localized zones and release phosphorus from mineral-bound forms, particularly in soils with high fixation capacity. Fungal systems can operate across a wider range of environmental conditions and may play a larger role in longer-term phosphorus cycling. However, as with bacterial systems, these effects are generally localized and dependent on soil chemistry (Richardson et al., 2009). I tend to see these having the greatest benefits in systems that have historically received manures or long-term applications of fertilizer P. I do not believe this is a good fit for soils with limited available phosphorus, as it is trying to focus the soil into something, it does not want to do or have too spare.
Potassium-solubilizing organisms, including species such as Bacillus mucilaginosus and Frateuria aurantia, contribute to the release of potassium from primary minerals like feldspars and micas. These microbes facilitate mineral weathering through acidification and chelation processes that slowly break down mineral structures. While the mechanism is well understood, the rate of potassium release is typically slow relative to crop demand. As a result, these organisms are more influential in long-term soil development than in short-term fertility management (Sheng & He, 2006).
Micronutrient-mobilizing organisms, particularly Pseudomonas and Bacillus species, enhance availability through the production of siderophores and other chelating compounds. These molecules bind metals such as iron and zinc, increasing their solubility and facilitating uptake in the rhizosphere. This process is especially important in soils where micronutrients are present but not readily available due to chemical constraints. However, the impact is typically limited to the immediate root zone and depends on both microbial activity and soil conditions (Ahmed & Holmström, 2014).
Biological Pest Control
Biological pest control organisms, including species such as Bacillus, Pseudomonas, and Trichoderma, function by suppressing pathogens through several well-documented mechanisms. These include the production of inhibitory compounds, competition for space and nutrients, direct antagonism of pathogens, and the activation of plant defense systems through induced systemic resistance. While these mechanisms are well established under controlled conditions, their effectiveness in field environments is highly dependent on environmental conditions, pathogen pressure, and the ability of the organism to persist and colonize the soil or plant surface (Lugtenberg & Kamilova, 2009).
I’ve been working with a lot of folks from Brazil who historically make four to six nemacide applications in soybean, but utilizing Pseudomanas they have been able to reduce that number by half or more. The caveat, as I understand, the application rates needed are significantly higher than anything I have seen in the US. If you look through the literature, you are seeing more and more documentation of this such as Li et al. 2022. But as Spescha et al. (2023) documented, different biological control agents operate through complementary mechanisms, including infection, toxin production, and host targeting. However, effectiveness depended on environmental conditions and interactions among organisms, reinforcing that biological control outcomes are system-dependent rather than universally consistent.
Plant Growth Regulators (Hormonal Effects)
This group differs slightly, as the primary effect is not direct nutrient cycling but modification of plant physiological response. This group is one I hold the greatest expectations for. I mean we have been using PGRs in crop production for decades, we just did not have an inkling of how many PGRs exist.
Plant growth regulator effects are associated with organisms such as Azospirillum, Bacillus, and Pseudomonas, which can influence plant development through the production of phytohormones and related compounds. These microbes produce substances such as auxins, cytokinins, and gibberellins that alter root architecture and plant growth patterns, and in some cases reduce stress responses through enzymes like ACC deaminase. Rather than supplying nutrients directly, these organisms modify how plants respond to their environment and utilize available resources. However, just like everything previously discussed the magnitude of response is often subtle and highly dependent on environmental conditions and crop system interactions (Glick, 2012).
Final thoughts.
There is one situation that pops up that I do not agree with, based upon my limited understanding of soil microbiology. Its adding more of what is already there. The soil system is a dynamic system. While there are population booms and bust, it supports what it is able to. Adding more of what is already there is like dropping a million rabbits into a prairie that has rabbits already. The current population is where it is because that is what the system can support. Adding means one of two things, a lot of rabbits die immediately, or they overwhelm the system and another animal species dies off due to lack of resources. Also, most microbiologists tell me the system is amazing at signaling and finding what it wants. It may take a season, but it will be there, in the quantities that soil needs, just given time.
So, the final slide in all my biological additives talks ends with this statement. My experiments show one thing. The impact of adding these products on crop yields is very consistently inconsistent. I’ve had many show a significant positive response, once. I have struggled to ever get repeated successes. It is my belief that I will have more success improving the soil biome by managing the soil (no-till, crop rotation, cover crops) than I will ever have with adding a product.
Final comment, Read the label. Many of the biological products I have tested are not singularly pure species. There are many blends of species and organisms which encompass many of the modes. A lot of these blends also contain extras such as humics, fulvics, carbohydrates, and sugars, see previous blogs.
Take-Home Messages
- Biological products function through specific mechanisms, not as broad “boosters,” and understanding that mechanism is critical to proper use.
- The presence of a biological function does not guarantee a yield response, outcomes are driven by soil, crop, and environmental conditions
- Decomposers and carbon-driven systems can immobilize or mineralize nitrogen, depending largely on residue quality and system balance
- Mycorrhizae and PGPR improve access to existing nutrients, not total nutrient supply
- Nutrient-solubilizing organisms mobilize nutrients already present in the soil
- Plant growth regulators influence plant signaling and development
- Adding biological organisms to soil does not guarantee establishment or persistence, as soil systems can regulate microbial populations.
- Management practices such as no-till, crop rotation, and cover crops are effective at improving soil biological function
- Across all biological products, mechanism exists, but response depends on the system
Any questions or comments please reachout to me @ b.arnall@okstate.edu
Citations
Ahmed, E., & Holmström, S. J. M. (2014). Siderophores in environmental research: Roles and applications. Microbial Biotechnology, 7(3), 196–208.
Glick, B. R. (2012). Plant growth-promoting bacteria: Mechanisms and applications. Scientifica, 2012, 963401
Kennedy, I. R., Choudhury, A. T. M. A., & Kecskés, M. L. (2004).
Non-symbiotic bacterial diazotrophs in crop-farming systems. Plant and Soil, 266, 65–79.
Kuzyakov, Y., & Blagodatskaya, E. (2015).
Microbial hotspots and hot moments in soil. Soil Biology and Biochemistry, 83, 184–199.
Lugtenberg, B., & Kamilova, F. (2009). Plant-growth-promoting rhizobacteria. Annual Review of Microbiology, 63, 541–556.
Richardson, A. E., Barea, J. M., McNeill, A. M., & Prigent-Combaret, C. (2009). Acquisition of phosphorus and nitrogen in the rhizosphere and plant growth promotion by microorganisms. Plant and Soil, 321(1–2), 305–339.
Sheng, X. F., & He, L. Y. (2006). Solubilization of potassium-bearing minerals by a wild-type strain of Bacillus edaphicus and its mutants and increased potassium uptake by wheat. Canadian Journal of Microbiology, 52(1), 66–72. https://doi.org/10.1139/w05-117
Smith, S. E., & Read, D. J. (2008).
Mycorrhizal symbiosis. Academic Press.
Spescha, A., Weibel, J., Wyser, L., Brunner, M., Hess Hermida, M., Moix, A., Scheibler, F., Guyer, A., Campos-Herrera, R., Grabenweger, G., & Maurhofer, M. (2023). Combining entomopathogenic Pseudomonas bacteria, nematodes and fungi for biological control of a below-ground insect pest. Agriculture, Ecosystems & Environment, 348, 108414.
Ye S, Yan R, Li X, Lin Y, Yang Z, Ma Y and Ding Z (2022) Biocontrol potential of Pseudomonas rhodesiae GC-7 against the root-knot nematode Meloidogyne graminicola through both antagonistic effects and induced plant resistance. Front. Microbiol. 13:1025727. doi: 10.3389/fmicb.2022.1025727
The Mechanics of Soil Fertility: Use of Sugar in Field Crops
Jolee Derrick, Precision Nutrient Management Ph. D. Student
Grace Williams, Soil Microbiology Ph. D. Candidate
Brian Arnall, Precision Nutrient Management Specialist
Recently, there has been increased interest in adding sugar to spray tank mixes, whether for post-emergence weed control or foliar nutrient applications. While there is limited work on impact of sugar inclusion in herbicide applications, some papers have posed potential enhancement (Devine and Hall, 1990). But since this is coming from a soil science group, we will only focus on soil impact. Following up the last blog, unlike humic substances, which represent more complex and relatively stable carbon forms, sugar is a highly labile carbon source. This rapid utilization of simple carbon sources is well documented to stimulate microbial activity and growth (Kuzyakov and Blagodatskaya, 2015). The general idea of utilizing sugar applications is that sugar has the capacity to improve spray performance, stimulate biological activity, increase organic matter mineralization, and ultimately result in improved yields.
Sugar additions can influence soil processes differently depending on system conditions. In systems with higher residual nitrogen and organic matter, responses may differ from those observed in Oklahoma production environments, where soils are typically lower in organic matter and microbial activity can occur for much of the year. Understanding how sugar functions in these systems requires a basic discussion of carbon dynamics. Sugar itself is almost entirely carbon and is readily consumed by microbes. It’s a simple molecule, which allows it to dissolve easily in water and be quickly utilized in the soil system. Crop residues, like wheat straw, are also carbon-rich but much more complex. They contain cellulose, hemicellulose, and lignin which are long carbon chains that take time to break down because microbes need specialized enzymes to access them.
For the sake of simplicity, we can group carbon into two key pools: labile carbon and particulate organic matter (POM). Labile carbon includes easily decomposed materials, which include the previously mentioned simple sugars that microbes can metabolize rapidly. These pools differ in turnover time and microbial accessibility, with labile carbon driving short-term microbial responses (Cotrufo et al. 2013). POM breaks down more slowly and serves as a longer-term nitrogen source through residue breakdown.
Soil microorganisms require both carbon and nitrogen to grow and maintain biomass, typically at a ratio of approximately 24 parts carbon to 1 part nitrogen. When readily available carbon is abundant, but nitrogen is limited, microbes increase their nitrogen demand and begin scavenging nitrogen from the surrounding soil. This process, better known as nitrogen immobilization, temporarily reduces nitrogen availability to crops. Additions of readily available carbon sources have consistently been shown to increase microbial nitrogen immobilization in soil systems (Recous et al. 1990).
In systems where sufficient nitrogen is present, microbial populations can expand rapidly. Fast-growing microbial species may dominate, continuing to immobilize nitrogen within their biomass. Eventually, when nitrogen becomes limiting, microbial populations decline to levels the system can support. This boom-and-bust cycle can disrupt nitrogen availability during critical stages of crop growth. These rapid shifts in microbial population and activity following carbon inputs are commonly observed in soil systems receiving easily decomposable substrates (Blagodatskaya and Kuzyakov, 2008).
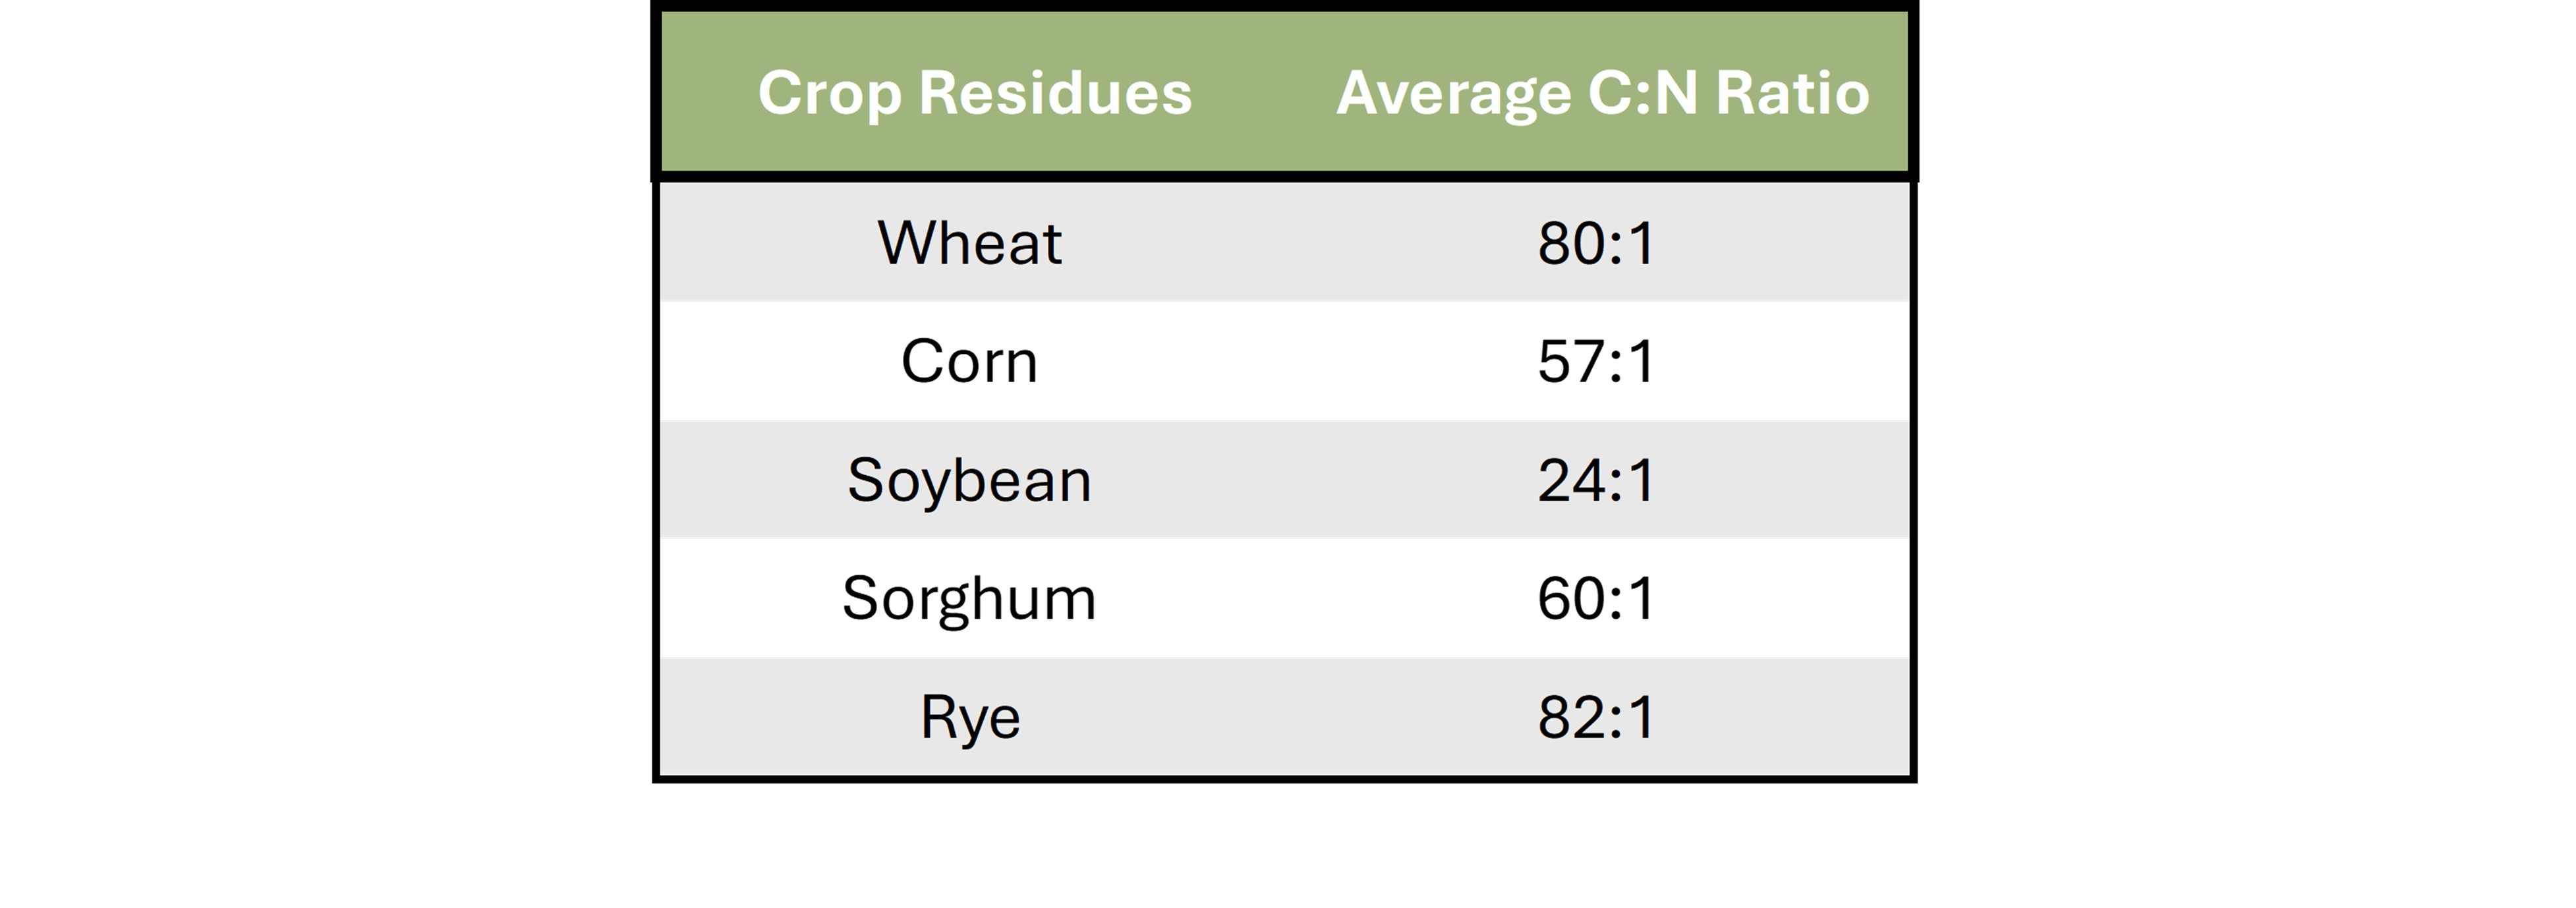
This dynamic becomes especially relevant when considering residue management practices common in Oklahoma. Under no-till or limited-tillage systems, the crop residues have wide carbon-to-nitrogen (C:N) ratios, creating conditions where nitrogen immobilization can occur during the growing season.
Table 1 provides approximate C:N ratios for several crops commonly grown in Oklahoma. When additional carbon is introduced into these systems without accompanying nitrogen, the likelihood of microbial immobilization increases. While immobilization is not bad, it does create a question mark as Oklahoma’s variable climate means the following release of nutrients will be unpredictable.
Table 1. Table depicting the range of C:N ratios for residues of commonly utilized crops in Oklahoma. Ratios were obtained from Brady, N. C., & Weil, R. R. (2017). The Nature and Properties of Soils (15th ed.)
Now consider conventional tillage systems. In Oklahoma, no-till systems typically contain 2 to 3 percent organic matter, which is relatively high given our climate and extended periods of microbial activity. Conventional tillage systems often fall between 0.75 and 2.25 percent organic matter. Because soil organic matter is approximately 58 percent carbon, this represents a substantial difference in the soil carbon pool.
Tillage can temporarily enhance microbial access to both previously mentioned carbon pools. When tillage exposes previously protected carbon, microbial activity increases rapidly. This initial flush can temporarily increase nitrogen mineralization as organic nitrogen is converted to plant-available forms. However, this phase is short-lived. As microbial populations expand, nitrogen demand increases, leading to immobilization and reduced nitrogen availability.
Hypothetically, increased microbial growth and activity would rapidly mineralize organic matter, trigger a surge in NO₃⁻, deplete soil organic matter, and as resources become limiting and the environment can no longer sustain elevated microbial populations, this boom would be followed by a population crash. This relationship is ultimately driven by the soil C:N ratio, which introduces an interesting additional complexity of residue. Different residues bring very different carbon-to-nitrogen balances into the system, and microbes respond accordingly. High carbon residues give microbes plenty of energy but very little nitrogen, so they pull N out of the soil to meet their needs. Residues with lower C:N ratios (soybean, alfalfa, etc.) do opposite, releasing nitrogen as they break down. Now the real question becomes where the critical point sits, and when does management push the system from the threshold of immobilization and mineralization.
These hypotheses form the foundation for new research currently underway through the Precision Nutrient Management Program. Initial proof-of-concept work has already been completed, providing a necessary steppingstone to address these questions.
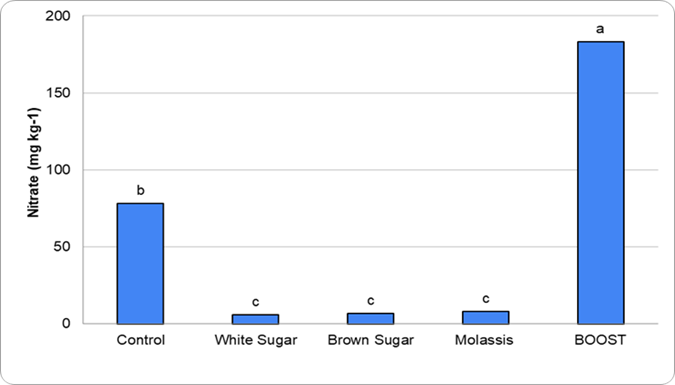
Figure 1. Graph depicting the different concentrations of nitrate leached corresponding to applied treatments in the proof-of-concept work
The preliminary work (Figure 1) evaluated different sugar sources applied alongside a high-nitrogen product to assess the extent of nitrogen immobilization. Although these studies were conducted using potting soils, clear trends were apparent. Treatments containing sugar consistently showed greater nitrogen immobilization compared to treatments without sugar. This response is consistent with studies showing that additions of simple carbon substrates stimulate microbial growth and increase nitrogen immobilization (Dendooven et al. 2006). Building on this work, an active field-based research project is underway to evaluate how sugar additions influence nitrogen availability and microbial dynamics under real-world Oklahoma production conditions.
From an agronomic standpoint, sugar functions primarily as a readily available carbon source that stimulates microbial growth. In nitrogen-limited systems, this response increases the likelihood that nitrogen will be incorporated into microbial biomass rather than remaining immediately available for crop uptake.
Finally, we conclude with a conceptual consideration. If increased OM mineralization leads to greater plant biomass, this process may partially offset losses of OM. Greater biomass production could return more residues to the soil, contributing to the OM pool in the upper soil profile. Therefore, the system may compensate for OM mineralization through the rebuilding of organic matter via plant inputs. However, the stabilization of this carbon depends on microbial processing and physical protection within the soil matrix (Cotrufo et al. 2015)
However, while the underlying logic is sound, this concept has not been extensively studied within Oklahoma cropping systems. This blog does not address the impact of sugar applications on residue breakdown, and the potential impact of such. Future research through the Precision Nutrient Management Program will further investigate the mineralization process to better understand carbon dynamics within these systems.
Take Home:
- Oklahoma production systems generally have lower residual N and high carbon residues, creating conditions conducive to N immobilization
- Adding sugar increases microbial growth, creating population booms that will momentarily increase mineralization, but then immediately immobilize residual nitrogen.
- Tillage can amplify the negative effects of sugar by exposing more carbon and reducing soil organic matter
- Proof-of-concept work shows sugar triggered a net nitrogen immobilization in a carbon heavy environment
- Proof-of-concept work also suggests that when additional nitrogen is present, sugar additions may shift the system toward net mineralization rather than immobilization.
Work Cited:
Blagodatskaya, E., & Kuzyakov, Y. (2008). Mechanisms of real and apparent priming effects. Biology and Fertility of Soils, 45, 115–131.
Brady, N. C., and R. R. Weil. “The Nature and Properties of Soils, 15th Edn (eBook).” (2017).
Cotrufo, M. F., Wallenstein, M. D., Boot, C. M., Denef, K., & Paul, E. (2013). The Microbial Efficiency-Matrix Stabilization (MEMS) framework. Global Change Biology, 19, 988–995.
Cotrufo, M. F., Soong, J. L., Horton, A. J., Campbell, E. E., Haddix, M. L., Wall, D. H., & Parton, W. J. (2015). Formation of soil organic matter via biochemical and physical pathways of litter mass loss. Nature Geoscience, 8(10), 776–779.
Dendooven, L., Verhulst, N., Luna-Guido, M., & Ceballos-Ramírez, J. M. (2006). Dynamics of inorganic nitrogen in nitrate- and glucose-amended alkaline–saline soil. Plant and Soil, 283(1–2), 321–333.
Devine, M. D., & Hall, L. M. (1990). Implications of sucrose transport mechanisms for the translocation of herbicides. Weed Science, 38(3), 299–304.
Kuzyakov, Y., & Blagodatskaya, E. (2015). Microbial hotspots and hot moments in soil: Concept & review. Soil Biology and Biochemistry, 83, 184–199.
Recous, S., Mary, B., & Faurie, G. (1990). Microbial immobilization of ammonium and nitrate in cultivated soils. Soil Biology and Biochemistry, 22, 913–922.
Small Pest, Big Problems: Wheat Curl Mites and Wheat Streak Mosaic Virus Detected in Oklahoma
Ashleigh Faris, Cropping Systems Entomologist, IPM Coordinator
Meriem Aoun, Wheat Pathologist
Department of Entomology & Plant Pathology,
Oklahoma State University
Wheat Curl Mite (WCM) activity has been confirmed in Washita County, located in western Oklahoma. While the mites themselves are difficult to see, they can have a considerable impact on wheat health, primarily due to their role as vectors for several viral diseases such as wheat streak mosaic virus (WSMV). The Plant Disease and Insect Diagnostic Laboratory (PDIDL) has confirmed WSMV in the sample where WCM were detected in Washita County. This week, the PDIDL has also confirmed infection by WSMV in Blaine County (Canton, OK), McCurtain County (Garvin, OK), and Cleveland County (Noble, OK).
Identification
The Wheat Curl Mite is nearly invisible to the naked eye. At approximately 1/100 of an inch long, these pests require a 10x – 20x hand lens for proper identification.
- Appearance: They are white or cream-colored, cigar-shaped (cylindrical), and possess only four legs located near the head (Figure 1).
- Behavior: They are typically found in the protected areas of the plant, such as developing, youngest leaves or the furrows of the leaf surface. As the leaf unfurls, the mites migrate to the next emerging leaf.
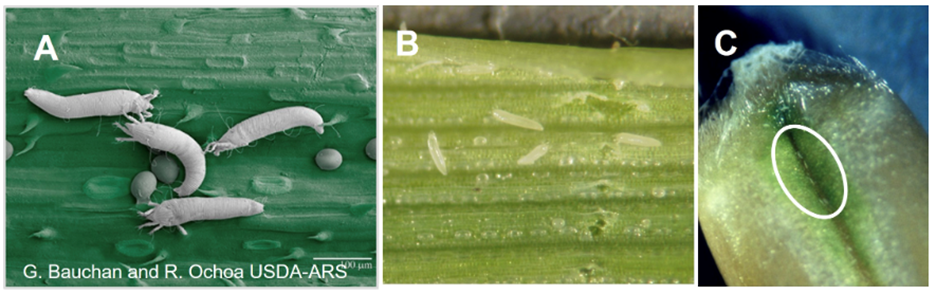
Figure 1. Wheat curl mites and eggs on a wheat leaf (A, B), and mites on a maturing wheat kernel (C). Images courtesy G. Bauchan and R. Ochoa, USDA-ARS.
Biology and Life Cycle
Understanding the WCM life cycle is critical for preventative management:
- Rapid Reproduction: Under optimal temperatures (75° – 85°F), a WCM can complete its life cycle in 7 to 10 days. This allows populations to explode rapidly during warm autumns or springs.
- Dispersal: WCMs cannot fly; they rely entirely on wind currents to move from plant to plant or field to field. They crawl to the tips of leaves and hitchhike on the wind.
- Survival (The Green Bridge): WCMs are obligate parasites, meaning they require living green tissue to survive and reproduce. They persist through the summer on volunteer wheat and various perennial or annual grasses. This is known as the green bridge. If this bridge is not broken, mites move into the newly planted crop in the fall.
Damage and Virus Transmission
WCMs cause two types of damage:
- Direct Feeding: Mites suck sap from the leaf cells. This causes the edges of the leaf to roll inward (the curl part of WCM) (Figure 2). This curling provides a protected microclimate for the mites to reproduce. Heavy infestations can cause stunting and a slowed appearance in growth.
- Viral Vector (Primary Concern): The WCM is the sole vector for Wheat Streak Mosaic Virus (WSMV), High Plains Wheat Mosaic Virus (HPWMoV), and Triticum Mosaic Virus (TriMV).
- Symptoms: Infected plants show yellowing, mottled or streaked leaves, and severe stunting (Figures 3 & 4).
- Impact: If infection occurs in the fall, yield loss can be up to 100%. Spring infections are generally less damaging.
Scouting Techniques
Because the mites are so small, scouting focuses on leaf symptoms and having a hand lens:
- Check your Fields: Examine the youngest leaves of the wheat plant. Look for the characteristic inward rolling of the leaf edges (Figure 2).
- Use Magnification: Slowly unroll a suspect leaf and use a hand lens to look for tiny, white, slow-moving specks in the leaf furrows.
- Pattern of Infestation: Wind-dispersed mite infestations often start at the edge of a field (particularly edges adjacent to volunteer wheat or CRP land) and move inward in the direction of prevailing winds. Areas with infestations may show signs of yellowing and appear as patches distributed at random across the field (Figure 4).
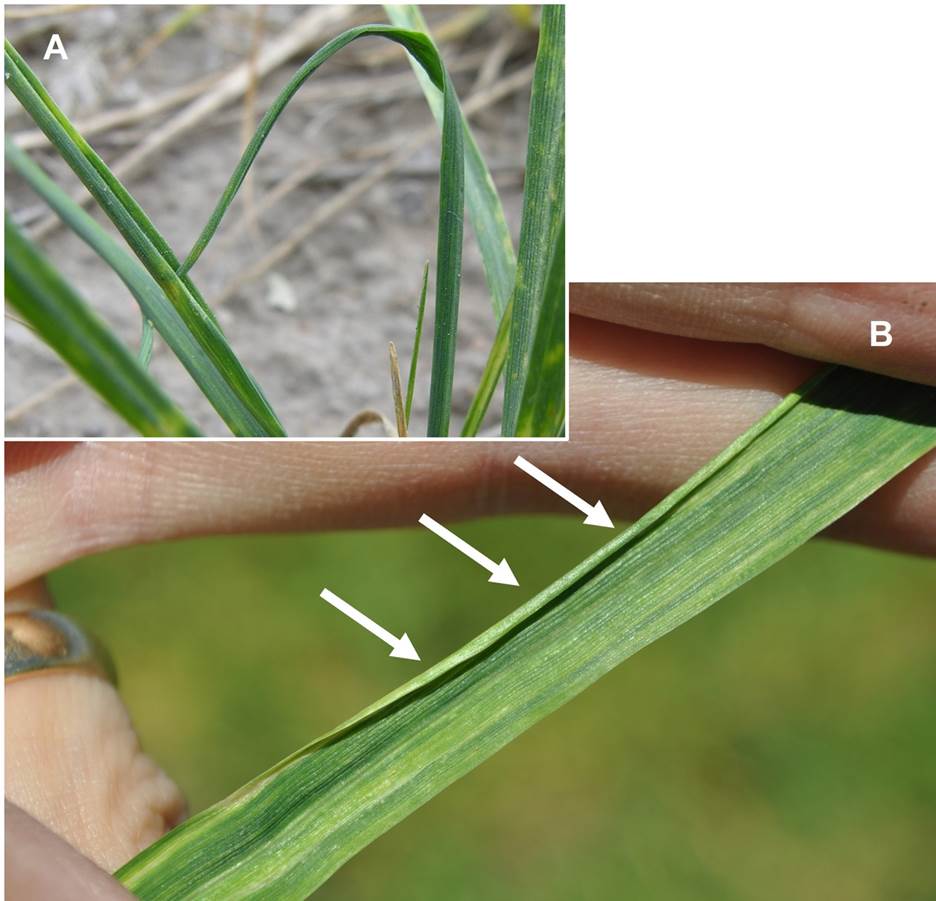
Figure 2. Infestation of wheat curl mites on wheat results in tightly curled leaves and entrapment of subsequent leaves within the curl (A). After full leaf emergence, a tight curl at the leaf edge remains (B). Images courtesy of UNL Extension.
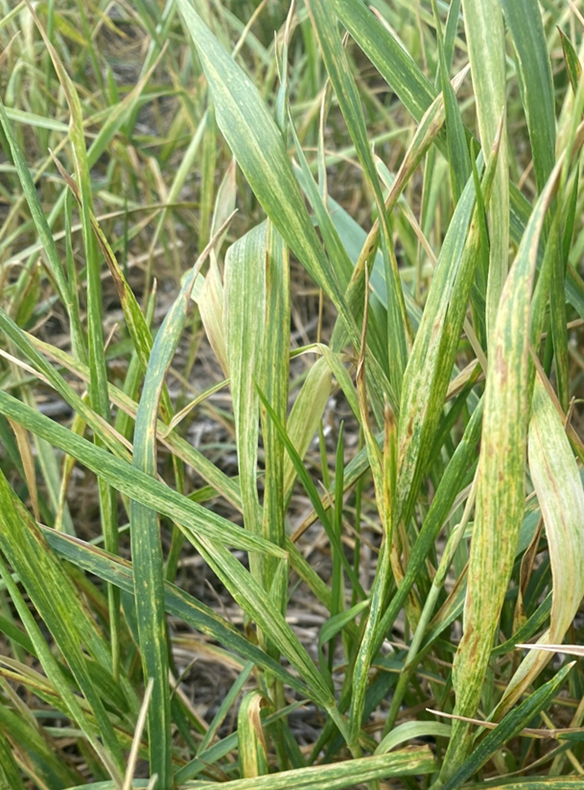
Figure 3. Wheat streak mosaic virus (WSMV) symptoms includeyellowing, mottled or streaked leaves. Image courtesy of Meriem Aoun, Oklahoma State University.
Figure 4. Plants at field margins, neighboring a wheat curl mite source, are the first to become infected with viruses of the Wheat Streak Mosaic Virus (WSMV) complex and develop symptoms, such as yellowing and streaking. Notice the gradient in color from the field edge (left) toward the center of the wheat field. Image courtesy of UNL Extension.
Management Recommendations
Currently, there are no effective rescue chemical treatments for WCM once symptoms appear in the field. Miticides generally do not reach the mites hidden inside the curled leaves. Management must be proactive:
- Manage volunteer wheat and grassy weeds: This is the most effective management tool to break the green bridge. Ensure all volunteer wheat and grassy weeds are completely dead (via tillage or herbicide) at least two weeks prior to planting the new crop. WCMs will starve within days without a living host.
- Delayed Planting: Planting wheat later in the fall reduces the window of time that mites must migrate into the crop and slows their reproduction rate as temperatures drop.
- Variety Selection: Some wheat varieties offer resistance or tolerance to WCM or WSMV. Consult the latest OSU variety trial data to select adapted varieties for north-central Oklahoma that carry these traits. Currently, Breakthrough is the most resistant OSU variety, which carries the WSMV resistance gene, Wsm1.
Brown Wheat Mite Activity in North Central Oklahoma
Ashleigh Faris, Cropping Systems Entomologist, IPM Coordinator
Department of Entomology & Plant Pathology,
Oklahoma State University
Following a period of dry weather, wheat growers in central Oklahoma are reporting activity of the Brown Wheat Mite (BWM). Unlike many other wheat pests, BWM thrives in drought conditions, and its damage can often be mistaken for moisture stress or nutrient deficiency.
Identification
The Brown Wheat Mite is small—about the size of a needle point—but is generally easier to spot than the Wheat Curl Mite because it is active on the leaf surface.
- Appearance: BWM has a dark red to brownish-black, oval-shaped body (Figure 1).
- Distinguishing Feature: Its front legs are significantly longer than its other three pairs of legs.
- Behavior: They are most active during the day, particularly in the afternoon, and will quickly drop to the ground if the plant is disturbed (Figure 2).
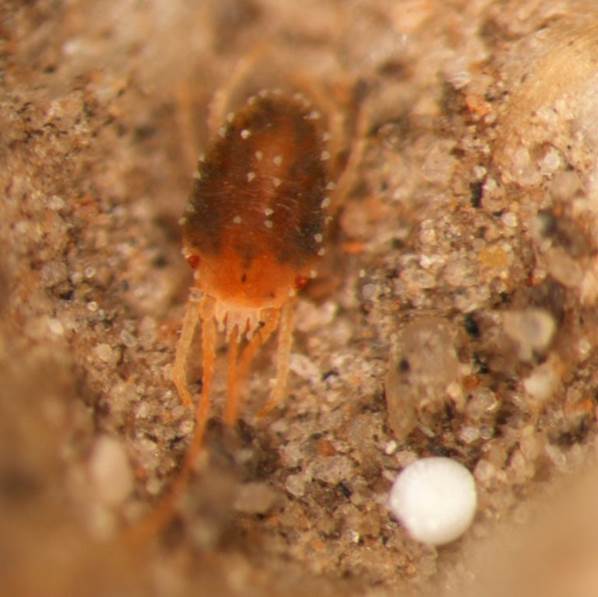
Figure 1. Brown wheat mite (BWM).
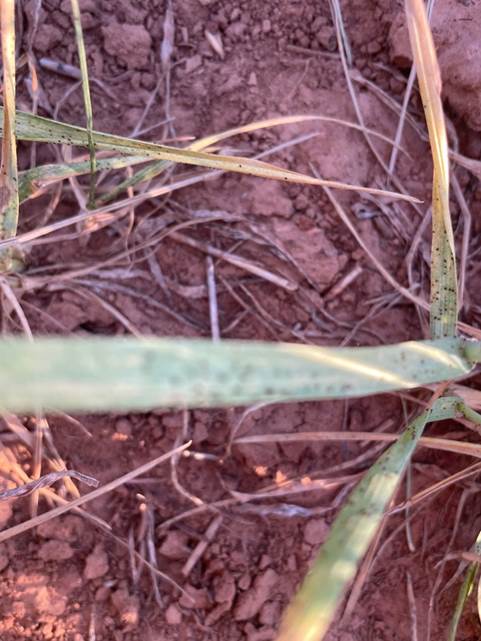
Figure 2. Brown wheat mites (BWM) on wheat. Image courtesy L. Galvin, OSU Extension.
Biology and Life Cycle
BWM populations consist entirely of females that produce offspring without mating (parthenogenesis), allowing for extremely rapid population growth under dry conditions. The BWM has a unique life cycle in that it can lay two types of eggs. Environmental conditions dictate when these two types of eggs are laid:
- Red Eggs: Laid during the growing season and hatch in about a week when conditions are favorable.
- White (Diapause) Eggs: Laid as temperatures rise and the crop matures. They are highly resistant and allow the population to survive the summer heat, hatching only when cooler, wetter weather arrives in the fall.
Damage
BWM damage is caused by the mites piercing plant cells and sucking out the plant nutrients.
- Symptoms: Initial damage appears as “stippling” (fine white or yellow spots) on the leaves. As feeding continues, leaves take on a silvery or bronzed appearance (Figure 3).
- Tipping: Heavy infestations cause the tips of the leaves to turn brown and die.
- Weather Interaction: Damage is most severe when plants are already under drought stress. Because both BWM damage and drought cause yellowing/browning, it is essential to confirm the presence of mites before treating.
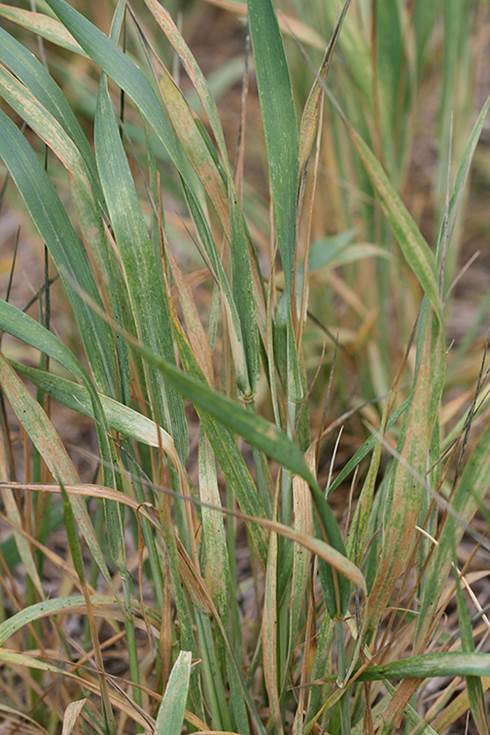
Figure 3. Brown wheat mite (BWM) damage.
Scouting
Because BWM is highly mobile and drops when disturbed, careful scouting is required:
- Timing: Scout during the warmest part of the day when mites are most active on the upper leaves.
- The Paper Test: Gently but quickly shake or tap wheat plants over a white piece of paper or a white clipboard. Look for tiny dark specks moving across the surface.
- Economic Threshold: While thresholds vary based on crop value and moisture stress, research suggests a treatment threshold of 25 to 50 brown wheat mites per leaf in wheat that is 6 inches to 9 inches tall is economically warranted. An alternative estimation is “several hundred” per foot of row. If the wheat is severely stressed, the lower end of that threshold should be used.
Management Recommendations
- The “Rain” Factor: A significant, driving rain is often the most effective control for BWM. Rain can physically knock mites from the plant and promote fungal pathogens that naturally reduce the population.
- Chemical Control: If populations exceed the threshold and no rain is in the forecast, chemical intervention may be necessary. Know the cost of the treatment and value of your wheat so you can determine if an application is a worth return on investment.
- Effective Ingredients: Organophosphates (such as Dimethoate) have historically provided better control than many pyrethroids, as the latter can sometimes result in mite “flaring” or simply fail to provide adequate residual control.
- Coverage: High water volume is critical to ensure the insecticide reaches the mites, especially if they have moved toward the base of the plant.
- Pre-harvest Intervals & Grazing Restrictions: Always read and follow the label guidelines. For more on acaricides that can be applied in wheat see the Oklahoma State University Fact Sheet “Management of Insect and Mite Pests in Small Grains” (CR-7194).
- Cultural Practices: Since BWM thrives in dry, dusty conditions, maintaining good soil moisture and vigorous plant growth can help the crop tolerate feeding. Here’s to hoping for some rain soon in the forecast; we could really use it for lots of reasons in Oklahoma.
Corn Hybrids’ Yield Response to Limited Well Capacities in the Central High Plains
Macie McPeak: M.S in Irrigation and Water Management
Sumit Sharma : Extension Specialist for High Plains Irrigation and Water Management
Background
The Central High Plains, which include the Oklahoma Panhandle, Southwest Kansas, Southeast Colorado, and Northern Texas Panhandle, is a heavily farmed semi-arid region that depends on the Ogallala Aquifer for irrigation to ensure stable crop yields. However, the continuous decline of the Ogallala Aquifer has resulted in increased need for irrigation strategies that conserve water while maintaining crop profitability. Corn remains the most water consuming crop with highest productivity per unit of irrigation applied, and strong economic returns in the Central High Plains region. However, corn is also the most sensitive to water stress among all the existing cropping systems (including sorghum, cotton, and sunflower, soybeans and wheat). Declining water table has reduced the well capacities in many areas in the region, which cannot meet crop water demand, making it a growing challenge for corn production. Therefore, there is a need for research in irrigation strategies and agronomic choices such as drought tolerant hybrids, seeding rate, planting date, and hybrid maturity for sustainable and profitable corn production with reduced well capacities in the region. This blog discusses the yield response of different corn hybrids to limited well capacities in the Oklahoma Panhandle area of the Central High Plains.
Limited well capacities only meet partial crop water demand, which in general leads to yield declines especially in high water demanding crops such as corn. Several previous studies suggest that crop productivity does not significantly decrease as long as irrigation is maintained at approximately 75–80% of full evapotranspiration (ET) replacement (Su et al., 2022; Klocke et al., 2007; Zhao et al., 2019). However, when irrigation levels are more restricted, such as under reduced well capacities, there can be substantial yield losses and diminished economic returns. The magnitude of yield reduction varies with region, hybrids, and growth stage at which water stress occurred. For example, in the Central High Plains the corn ET demand is highest in Texas Panhandle and decreases as we move north towards Nebraska. Zhao et al. (2019) found that applying 75% ET in the Texas Panhandle produced corn yields equivalent to full irrigation, whereas reducing irrigation to 50% caused significant yield reductions. Similarly, Klocke et al. (2007) reported that limited irrigation at roughly 50% of full ET replacement in Nebraska achieved 80–90% of fully irrigated yields across multiple crop rotations. Therefore, the irrigation strategies which work in one region may not work the same way in other regions with different crop water demand and must be tested for the region-specific climatic conditions.
The current study was conducted in 2025 at the Oklahoma Panhandle Research and Extension Center in Goodwell, OK. Four Pioneer brand corn hybrids including P13777 (113 day maturity), P10625 (110 day maturity), P05810 (105 day maturity), and P14346 (114 days maturity) were planted at 22,000 and 28,000 seeds per acre. The hybrids were irrigated with a center pivot fitted with variable rate irrigation system at 200, 300, 400, and 500 GPM well capacities. The well capacities were simulated by adjusting the frequency of irrigation events.
Results & Discussion
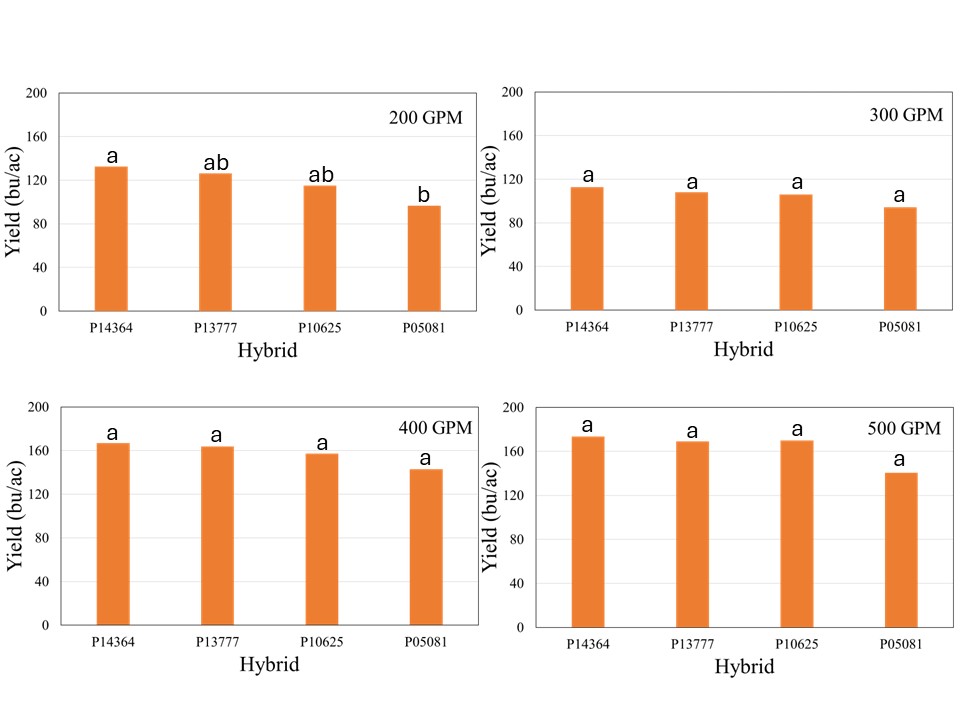
The crop received 12.1 inches of rain from planting until physiological maturity, while total rainfall from April till September was over 15 inches. Manual probing of the field showed near 4 feet soil profile at the time of planting which can hold up to 2 inches of plant available water per foot. The well capacities 200, 300, 400, and 500 GPM treatments received 7.4, 8.9, 10.8, and 12.0 inches of irrigation, respectively. The data showed no significant effect of population on corn yield across hybrids for any well capacity. However, the hybrids showed significant interaction with well capacities, which indicated that hybrid yield response varied at different capacities (Figure 1). In general, the average yield declined from longest maturity to shortest maturity hybrids irrespective of the well capacity, but was only statistically significant at for 200 GPM (Figure1). At this irrigation level, the shortest maturity hybrid P05081 yielded significantly lower yield than longest maturity hybrid P14364, while P13777 and P10625 were not different from either of these two hybrids.
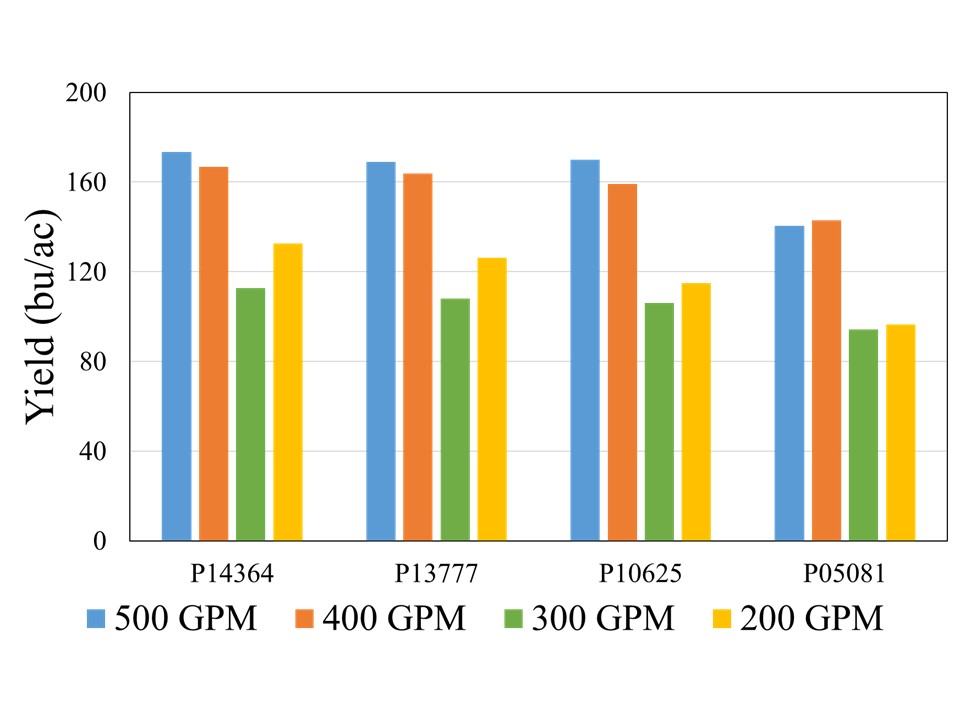
Although there was no statistical difference among the hybrids at 500, 400, and 300 GPM, when compared across well capacities, yield reductions were most pronounced at the 200 and 300 GPM irrigation levels for each individual hybrid, indicating that irrigation capacity was the primary yield limiting factor under restricted water availability (Figure 2). While the exact causes of this abrupt decline are not yet understood, as mentioned in the beginning of this blog, previous literature has suggested that severe yield decline in corn can be expected when irrigation is reduced to 60% ET replacement in the study region. Both 300 and 200 GPM well capacities met 60 and 65% crop ET demand, while 400 and 500 GPM met 71 and75% crop ET demand, respectively. More data will be needed to ascertain these threshold levels of well capacities for corn production in this region.
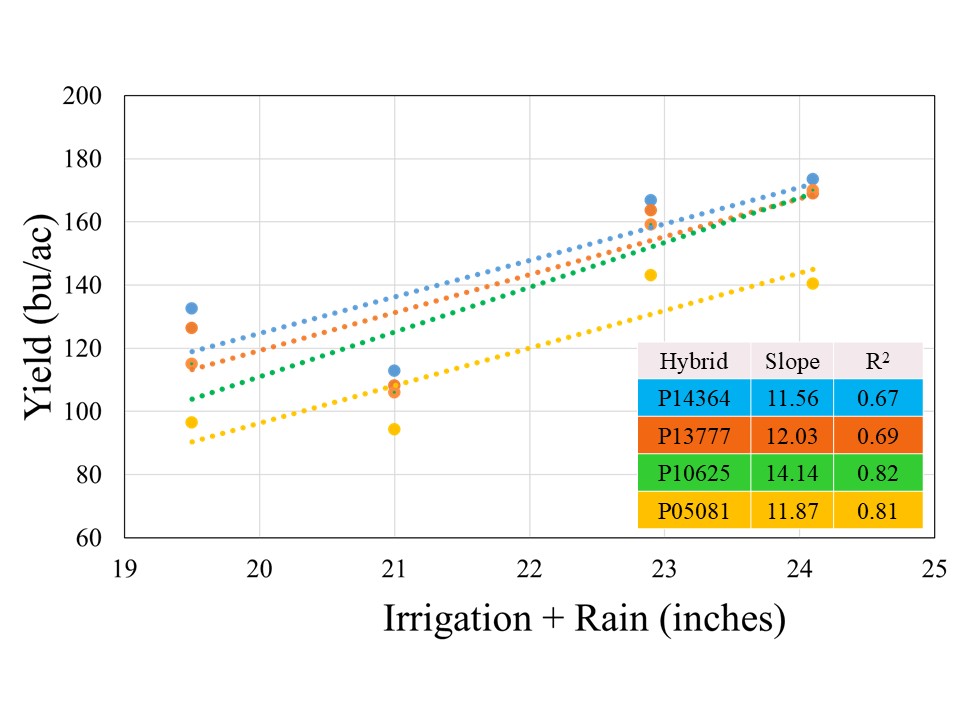
All the hybrids showed a positive yield response to Irrigation+Rain with different yield gains per inch of water applied (Figure 3). Hybrid P10625 registered highest yield gain of 14.1 bushel per inch of water applied, followed by P13777 (12.0 bu), P05081 (11.9 bu), and P14364 (11.6 bu). The stronger coefficient of regression (>80%) for two short maturity varieties indicated that irrigation was stronger yield limitation factor for these hybrids, in comparison to 114 and 113-day maturity hybrids for irrigation explained on 67 and 69% variability, respectively. This suggests that besides irrigation there might be other factors which could contribute to filling the yield gaps for given irrigation levels in longer maturity hybrids.
Planting population did not significantly affect grain yield across irrigation capacities. When pooled across the hybrids for individual planting populations, 28,000 seeding rates resulted in gain of 0.1, 2.6, 5, and 12 bushels per acre for 200, 300, 400, and 500 GPM, respectively. This indicates that higher planting populations at well capacities of 400 or above should be considered, while reducing population at 300 GPM or lower might be more cost-effective option.
Take Home
- Irrigation capacity remains the primary determinant of yield potential under limited well capacities in the Central High Plains.
- Pre-irrigation and recharging the soil profiles will be critical to support crop water demand for limited well capacities.
- Short maturity hybrids appeared to have consistently lower average yield and more vulnerable for yield losses at limited irrigation. However, one must consider that the growing conditions were more conducive for corn production in 2025 which generally favor long maturity hybrids. Therefore, long-term data will be required to assess the performance of short maturity hybrids during inclement growing seasons.
- Even though population didn’t significantly influence the grain yield. The 28,000 seeding rates overall had higher average yield at 400 and 500 GPM. Therefore, producers should consider the higher population at these well capacities or more.
- Overall, irrigation is the most important factor for yields, but there is a need for long-term agronomic data on hybrid maturity and population along with economic analysis to ascertain these findings.
