Home » Posts tagged 'ndvi'
Tag Archives: ndvi

NDVI, Its not all the same.
With the most recent FAA UAV announcement my phone has been ringing with excited potential UAV users. Two points always comes up in the conversation. NDVI (normalized difference vegetation index) and image resolution. This blog will address the use of NDVI, resolution will come later. Before getting into the discussion, what NDVI is should be addressed. As described by Wikipedia, NDVI is a simple graphical indicator that can be used to analyze remote sensing measurements, typically but not necessarily from a space platform, and access whether the target being observed contains live green vegetation or not. NDVI is a mathematical function of the reflectance values of two wavelengths regions, near-infrared (NIR) and visable (commonly red).

Calculation for NDVI. Any visible wavelegnth can be substituted for the red wavelength.
The index NDVI has been tied to a great number of crop factors, the most important being biomass. Biomass being important as most things in the plant world impact biomass and biomass is related to yield. The most challenging issue with NDVI is it is highly correlated with biomass and a plants biomass is impacted by EVERYTHING!!!! Think about it, how many things can impact how a plant grows in a field.

Image showing the impact of nitrogen on a potted plants spectral reflectance pattern. The yellow line has 0 Nitrogen and the orange line had 100 lbs. The higher the line the more that wavelength is reflected. Note Photosynthetic wavelength are absorbed more (reflected less) when the plant is bigger but the NIR (right side) is absorbed less by the healthier plants.

The kicker that most do not know is that all NDVI’s values are not created equal. The source of the reflectance makes a big difference.
Measuring reflectance requires a light source, this is where the two forms of NDVI separate. Passive sensors measure reflectance using the sun (natural light) as a light source while active sensors measure the reflectance from a known light source (artificial light). The GreenSeeker is a good example of a active sensor, it emits its own light using LEDs in the sensor while satellite imagery is the classic passive sensor.

Picture representation of satellite remote sensing. http://www.crisp.nus.edu.sg/~research/tutorial/optical.htm

Graphic of how a active sensor emits light and detects light.
The challenge with passive remote sensing lies within the source of the light. Solar radiation and the amount of reflectance is impacted by atmospheric condition and sun angle to name a few things. That means without constant calibration, typically achieved through white plate measurements, the values are not consistent over time and space. This is the case whether the sensor is on a satellite or held held. In my research plots where I am collecting passive sensor data, so that I can measure all wavelength, I have found it necessary to collected a white plate calibration reading every 10 to 15 minutes of sensing. This is the only way I can remove the impacts of sun angle and cloud cover. When using the active sensors as long as the crop does not change the value is calibrated and repeatable.
What does this mean for those wanting to use NDVI collected from a passive sensor (satellite, plane, or UAV)? Not much if the user wants to distinguish or identify high biomass and low biomass areas. Passive NDVI is a great relative measurement for good and bad. However many who look at the measurements over time notice the values can change significantly from one day to the next. The best example I have for passive NDVI is a yield map with no legend. Even the magnitude of change between high and low is difficult to determine.

Passive un-calibrated NDVI is a relative value. Providing relative highs and lows.
Passive NDVI in the hands of an agronomist or crop scout can be a great tool to identify zones of productivity. It becomes more complicated when decisions are made solely upon these values. One issue is this is a measure of plant biomass. It does nothing to tell us why the biomass production is different from one area to the next. That is why even with an active sensor OSU utilizes N-Rich Strips (N-Rich Strip Blog). The N-Rich Strip tells us if the difference is due to nitrogen or some other variable. We are also looking into utilizing P, K, and lime strips throughout fields. Again a good agronomist can utilize the passive NDVI data by directing sampling of the high and low biomass areas to identify the underling issues creating the differences.
OkState has been approached by many UAV companies to incorporate our nitrogen rate recommendation into their systems. This is an even greater challenge. Our sensor based nitrogen rate calculator (SBNRC blog) utilizes NDVI to predict yield based upon a model built over that last 20 years. That means to correctly work the NDVI must be calibrated and accurate to a minimum of 0.05 level (NDVI runs from 0.0 to 1.0). To date none have been able to provide a mechanism in which the NDVI could be calibrated well enough.
Take Home
NDVI values collected with a passive sensor, regardless of the platform the sensor is on, has agronomic value. However its value is limited if the user is trying to make recommendations. As with any technology, to use NDVI you should have a goal in mind. It may be to identify zones or to make recommendations. Know the limitations of the technology, they all have limitations, and use the information accordingly.
Sensing the N-Rich Strip and Using the SBNRC
Original Post:
With the significant swing in temperature over the last few weeks many are chomping at the bit to get outside. The wheat is starting to respond to the good weather and N-Rich Strips are showing up around the state. Over the past week I have had several calls concerning the impact of the cold weather on the N-Rich Strips. Many of the fields either are still small due to limited days of warm weather and growth or may have a good deal of damage to the foliage. If the field of concern has only a little or no damage and the strip is visible, the time to go is NOW, but if you cannot see the strip and your field has tissue damage or is small, similar to the first two images, then you will need to wait a week or two for sensor based recommendations. Another situation fits with the third image, the field has freeze damage but the N-Rich Strip is also visible. In this case the predicted yield level would be reduced do to the dead tissue making the N rate recommendation a little off. I still however recommend using the sensor and online SBNRC (http://www.soiltesting.okstate.edu/SBNRC/SBNRC.php) to make or base top-dress N rate. Even if the recommendation is a little off it will still be much more accurate than just guessing. However you must look at the SBNRC and ensure that it makes agronomic sense, if it does not consult your county educator or myself. This is discussed in more detail in my earlier blog about freeze damage. Keep in mind no matter what, if you can see the N-Rich Strip, everything outside of the strip is suffering from nitrogen deficiency. Decisions and fertilizer applications need to be made soon, to maximize yield.
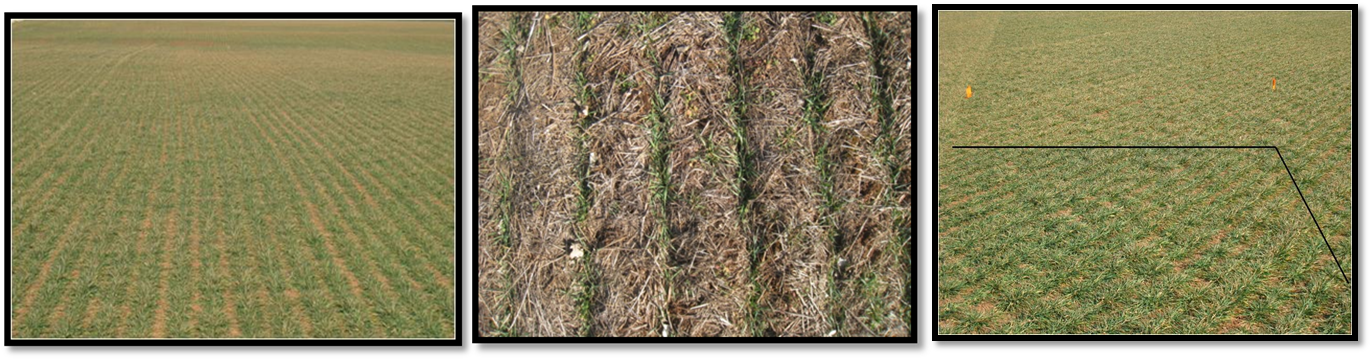
Winter Wheat and Nitrogen Rich Strips.
Regardless of whether or not the strip is visible you should be planning to sense with the GreenSeeker Handheld very soon. Remember the sensor has the ability to detect differences before your eyes can. To sense the N-Rich Strip and Farmer Practice the user should carry the sensor approximately 30 to 40 inches above the crop canopy while holding the sensor level over the crop. While you are walking the two area the trigger should be held the entire time. I recommend walking at minimum 100 paces for each. The average NDVI value seen on the screen will only stay on the screen for a few seconds. Therefore it is critical you have a method of recording the number for later use. The sensor has limited memory so it will time out is the trigger is held for an extended period of time. If you wish to collect more NDVI readings just do it in multiple trigger pulls recording each. Once you have the average NDVI for the N-Rich Strip and Farmer Practice you can go to the SBNRC site mentioned above to retrieve the N rate recommendation. Once in the calculator, for those in Oklahoma, choose the “within Oklahoma” option in the bottom left hand corner of the screen. This will allow the calculator to access the Oklahoma Mesonet to determine growing degree days. After the location is picked from the options you will need to enter Planting Date and Date Prior to Sensing. Additional information requested is the expected grain and fertilizer prices. While these inputs will provide some economic evaluations they will not impact recommended N rate.
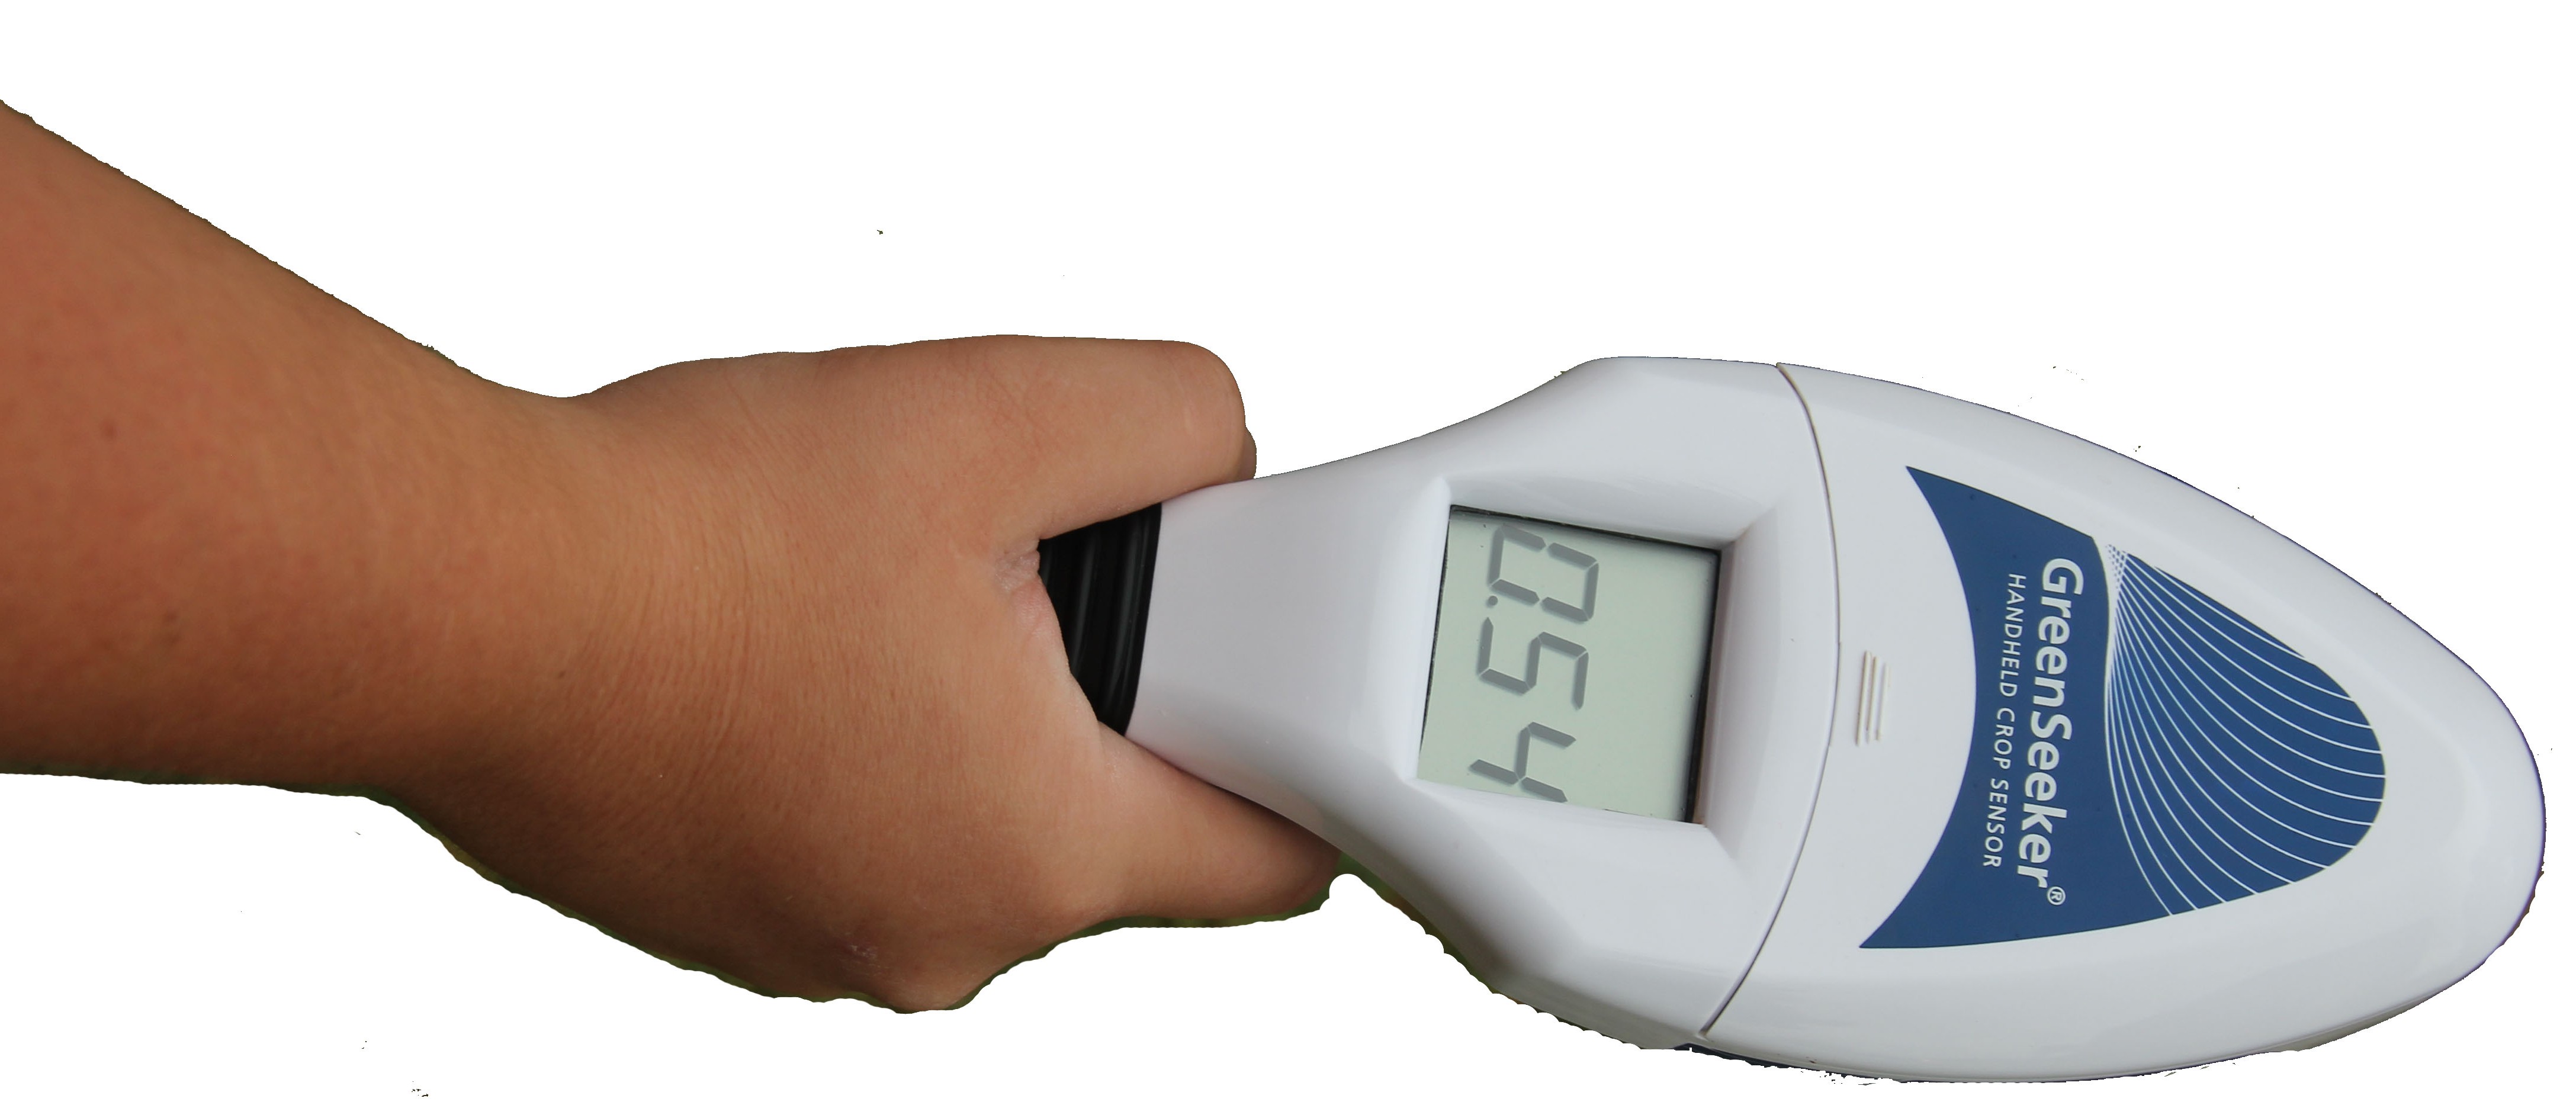
GreenSeeker HandHeld NDVI Sensor
Below is a YouTube video in which I describe how to use the GreenSeeker to collect NDVI readings, describe the data needed to complete the online calculator, and how to interrupt the calculators output.
Freeze Injury and N-Rich Strips,
Dr. Jeff Edwards “OSUWheat” wrote about winter wheat freeze injury in a receive blog on World of Wheat, http://osuwheat.com/2013/12/19/freeze-injury/. As Dr. Edwards notes injury at this stage rarely impact yield, therefore the fertility requirements of the crop has not significantly changed. What will be impacted is how the N-Rich Strip and GreenSeeker™ sensor will be used. This not suggesting abandoning the technology in fact time has shown it can be just as accurate after tissue damage. It should be noted GreenSeeker™ NDVI readings should not be collected on a field that has recently been damaged.
A producer using the N-Rich Strip, GreenSeeker™, Sensor Based N-Rate Calculator approach on a field with freeze damage will need to consider a few points. First there need to be a recovery period after significant tissue damage; this may be one to two weeks of good growth. Sense areas that have had the same degree of damage as elevation and landscape position often impacts the level of damage. It would be misleading to sense a area in the N-Rich strip that was not significantly damaged but an area in the Farmer Practice that took a great deal of tissue loss.
Finally we must consider how the SBNRC, available online at http://nue.okstate.edu/SBNRC/mesonet.php, works. The calculator uses NDVI to estimate wheat biomass, which is directly related to grain yield. This predicted grain yield is then used to calculate nitrogen (N) rate. So if biomass is reduced, yield potential is reduced and N rate reduced. The same issue is seen in dual purpose whet production. So the approach that I recommend for the dual purpose guys is the same that I will recommend for those who experienced significant freeze damage. This should not be used for wheat with just minimal tip burn.
To account for the loss of biomass, but not yield, planting date needs to be adjusted to “trick” the calculator into thinking the crop is younger and has greater potential. Planting date should be move forward 7 or 14 days dependent For example the first screen shot shows what the SBNRC would recommend using the real planting date. In this case the potential yield is significantly underestimated.
The second and third screen shots show the impact of moving the planting date forward by 7 and 14 days respectively. Note the increase in yield potential, which is the agronomically correct potential for field considering soil and plant condition, and increase in recommended N-rate recommendation. Adjust the planting date, within the 7 to 14 day window, so that the yield potential YPN is at a level suitable to the field the yield condition and environment. The number of days adjusted is related to the size and amount of loss. The larger the wheat and or greater the biomass loss the further forward the planting date should be moved. In the example below YPN goes from 37 bu ac on the true planting date to 45 bu ac with a 14 day correction. The N-rate changes from 31 lbs to 38 lbs, this change may not be as much as you might expect. That is because YP0, yield without additional N, also increases from 26 to 32 bushel.
 Image 1. Planting date 9/1/2013. YPN 37 bu ac-1 and N-Rec 31 lbs ac-1.
 Image 2. Planting date 9/8/2013. YPN 40 bu ac-1 and N-Rec 34 lbs ac-1.
 Image 3. Planting date 9/15/2013. YPN 45 bu ac-1 and N-Rec 38 lbs ac-1.
This adjustment is only to be made when tissue has been lost or removed, not when you disagree with the yield potential. If you have any questions about N-Rich Strips, the GreenSeeker™, or the online SBNRC please feel free to contact me at b.arnall@okstate.edu or 405.744.1722.
