Home » Posts tagged 'food'
Tag Archives: food

Brown Wheat Mite Activity in North Central Oklahoma
Ashleigh Faris, Cropping Systems Entomologist, IPM Coordinator
Department of Entomology & Plant Pathology,
Oklahoma State University
Following a period of dry weather, wheat growers in central Oklahoma are reporting activity of the Brown Wheat Mite (BWM). Unlike many other wheat pests, BWM thrives in drought conditions, and its damage can often be mistaken for moisture stress or nutrient deficiency.
Identification
The Brown Wheat Mite is small—about the size of a needle point—but is generally easier to spot than the Wheat Curl Mite because it is active on the leaf surface.
- Appearance: BWM has a dark red to brownish-black, oval-shaped body (Figure 1).
- Distinguishing Feature: Its front legs are significantly longer than its other three pairs of legs.
- Behavior: They are most active during the day, particularly in the afternoon, and will quickly drop to the ground if the plant is disturbed (Figure 2).
Figure 1. Brown wheat mite (BWM).
Figure 2. Brown wheat mites (BWM) on wheat. Image courtesy L. Galvin, OSU Extension.
Biology and Life Cycle
BWM populations consist entirely of females that produce offspring without mating (parthenogenesis), allowing for extremely rapid population growth under dry conditions. The BWM has a unique life cycle in that it can lay two types of eggs. Environmental conditions dictate when these two types of eggs are laid:
- Red Eggs: Laid during the growing season and hatch in about a week when conditions are favorable.
- White (Diapause) Eggs: Laid as temperatures rise and the crop matures. They are highly resistant and allow the population to survive the summer heat, hatching only when cooler, wetter weather arrives in the fall.
Damage
BWM damage is caused by the mites piercing plant cells and sucking out the plant nutrients.
- Symptoms: Initial damage appears as “stippling” (fine white or yellow spots) on the leaves. As feeding continues, leaves take on a silvery or bronzed appearance (Figure 3).
- Tipping: Heavy infestations cause the tips of the leaves to turn brown and die.
- Weather Interaction: Damage is most severe when plants are already under drought stress. Because both BWM damage and drought cause yellowing/browning, it is essential to confirm the presence of mites before treating.
Figure 3. Brown wheat mite (BWM) damage.
Scouting
Because BWM is highly mobile and drops when disturbed, careful scouting is required:
- Timing: Scout during the warmest part of the day when mites are most active on the upper leaves.
- The Paper Test: Gently but quickly shake or tap wheat plants over a white piece of paper or a white clipboard. Look for tiny dark specks moving across the surface.
- Economic Threshold: While thresholds vary based on crop value and moisture stress, research suggests a treatment threshold of 25 to 50 brown wheat mites per leaf in wheat that is 6 inches to 9 inches tall is economically warranted. An alternative estimation is “several hundred” per foot of row. If the wheat is severely stressed, the lower end of that threshold should be used.
Management Recommendations
- The “Rain” Factor: A significant, driving rain is often the most effective control for BWM. Rain can physically knock mites from the plant and promote fungal pathogens that naturally reduce the population.
- Chemical Control: If populations exceed the threshold and no rain is in the forecast, chemical intervention may be necessary. Know the cost of the treatment and value of your wheat so you can determine if an application is a worth return on investment.
- Effective Ingredients: Organophosphates (such as Dimethoate) have historically provided better control than many pyrethroids, as the latter can sometimes result in mite “flaring” or simply fail to provide adequate residual control.
- Coverage: High water volume is critical to ensure the insecticide reaches the mites, especially if they have moved toward the base of the plant.
- Pre-harvest Intervals & Grazing Restrictions: Always read and follow the label guidelines. For more on acaricides that can be applied in wheat see the Oklahoma State University Fact Sheet “Management of Insect and Mite Pests in Small Grains” (CR-7194).
- Cultural Practices: Since BWM thrives in dry, dusty conditions, maintaining good soil moisture and vigorous plant growth can help the crop tolerate feeding. Here’s to hoping for some rain soon in the forecast; we could really use it for lots of reasons in Oklahoma.
One Well-Timed Shot: Rethinking Split Nitrogen Applications in Wheat production
Brian Arnall, Precision Nutrient Management Specialist
Samson Abiola, PNM Ph.D. Student.
Nitrogen is the most yield limiting nutrient in wheat production, but it’s also the most unpredictable. Apply it too early, and you risk losing it to leaching or volatilization before your crop can use it. Apply it too late, and your wheat has already determined its yield potential; you’re just feeding protein at that point. For decades, the conventional wisdom has been to split nitrogen applications: put some down early to get the crop going, then come back later to apply again. But does splitting actually work? And more importantly, when is the optimal window to apply nitrogen if you want to maximize both yield and protein quality? We spent three years across different Oklahoma locations testing every timing scenario to answer these questions.
How We Tested Every Nitrogen Timing Scenario in Oklahoma Wheat
Between 2018 to 2021, we conducted field trials at three Oklahoma locations, including Perkins, Lake Carl Blackwell, and Chickasha, representing different soil types and growing conditions across the state. We tested three nitrogen rates: 0, 90, and 180 lbs N/ac, applied as urea at five critical growth stages based on growing degree days (GDD). These timings were 0 GDD (preplant, before green-up), 30 GDD (early tillering), 60 GDD (active tillering), 90 GDD (late tillering, approximately Feekes 5-6), and 120 GDD (stem elongation, approaching jointing). We also compared single applications at each timing against split applications, where half the nitrogen (45 lbs N ac-1) went down preplant, and the other half was applied in-season (45 lbs N ac-1).
The Sweet Spot: Yield and Protein at the 90 lbs N/ac Rate
Across all site-years, at the 90 lbs N/ac rate, timing had a significant impact on both yield and protein. The highest yields came from the 30 and 90 GDD timings, producing 62 to 66 bu/ac, with 60 GDD reaching the peak (Figure 1). Protein at these early timings stayed relatively modest at 13%. The 90 GDD timing delivered 62 bu/ac with 14% protein matching the yield of the 30 GDD application but pushing protein a percentage higher (Figure 2). The real problem appeared at 120 GDD. Delaying application until stem elongation dropped yields to just 49 bu/ac, even though protein climbed to 15%. That’s a 13 bushel penalty compared to the 90 GDD timing. At current wheat prices per bushel, that late application may cost farmers over $100 per acre in lost revenue. By 120 GDD, the crop has already determined its yield potential tillers are set, head numbers are locked in and nitrogen applied at this stage can only be directed toward protein synthesis, not building more yield components.
More Nitrogen Does not lead to high yield
Doubling the nitrogen rate to 180 lbs N/ac revealed something critical, more nitrogen doesn’t mean more yield. The yield pattern remained nearly identical to the 90 lbs N/ac rate. The 60 GDD timing produced the highest yield at 68 bu/ac, followed closely by 30 GDD at 67 bu/ac. The 90 GDD timing yielded 62 bu/ac, and the 120 GDD timing again crashed to 51 bu/ac. The only difference between the two rates was protein concentration (Figure 2). At 180 lbs N/ac, protein levels increased across all timings: 13% at preplant, 15% at both 30 and 60 GDD, 15-16% at 90 GDD, and 16% at 120 GDD. This confirms a fundamental principle: once farmers supply enough nitrogen to maximize yield potential, which occurred at 90 lbs N/ac in these trials, additional nitrogen only increases grain protein. It does not build more bushels. Unless farmers are receiving premium payments for high-protein wheat, that extra 90 lbs of nitrogen represents a cost with no yield return.

Should farmers split their nitrogen application?
Now that timing has been established as critical, the next question becomes: should farmers split their nitrogen applications, or is a single application sufficient? The conventional recommendation has been to split nitrogen apply part preplant to support early growth and tillering, then return with a second application later in the season to boost protein and finish the crop. But does the data support this practice? We compared three strategies at each timing: applying all nitrogen preplant, applying all nitrogen in-season at the target timing, or splitting nitrogen equally between preplant and in-season timing. The goal was to determine whether the extra trip across the field will deliver better results.
Our findings revealed that splitting provided no consistent advantage. At 30 GDD, all three strategies preplant, in-season, and split performed identically, producing 62-65 bu/ac with 12-13% protein (Figure 3 and 4). No statistical differences existed among them. At 60 GDD, similar pattern was held. Yields ranged from 61 to 66 bu/ac and protein stayed at 12-13% regardless of whether farmers applied all nitrogen preplant, all at 60 GDD, or split between the two. At 90 GDD, the single in-season application actually outperformed the split. While yields remained similar across all three methods (61-64 bu/ac), the in-season application delivered significantly higher protein at 13.7% compared to 12.4% for preplant and 12.5% for split applications. This suggests that concentrating nitrogen at 90 GDD, rather than diluting it across two applications, allows more efficient incorporation into grain protein. The only timing where splits appeared beneficial was 120 GDD, where the split application yielded 59 bu/ac compared to 51 bu/ac for the single late application. But this is not a win for splitting, it simply demonstrates that applying all nitrogen at 120 GDD is too late and putting half down earlier salvages some of the yield loss. Across all timings tested, splitting nitrogen into two applications offered no agronomic advantage over a single well-timed application, meaning farmers are making an extra pass for no gain in yield or protein.


Practical Recommendations for Nitrogen Management
Based on three years of field data, farmers should target the 90 GDD timing (late tillering, Feekes 5-6) for their main nitrogen application to achieve the best balance between yield and protein. This window typically falls in late February to early March in Oklahoma, though farmers should monitor crop development rather than relying solely on the calendar apply when wheat shows multiple tillers, good green color, and vigorous growth. A rate of 90 lbs N/ac maximized yield in these trials; higher rates only increased protein without adding bushels, so farmers should only exceed this rate if receiving premium payments for high-protein wheat. Splitting nitrogen applications provided no advantage at any timing, meaning a single well-timed application at 90 GDD is sufficient for most Oklahoma wheat production systems. The exception would be sandy soils with high leaching potential, where splitting may reduce nitrogen loss. Farmers should avoid delaying applications until 120 GDD or later, as this timing consistently resulted in 15-25 bushel per acre yield losses even though protein increased. For farmers specifically targeting premium protein markets, a two-step strategy works best: apply 90 lbs N/ac at 90 GDD to establish yield potential and baseline protein, then follow with a foliar application of 20-30 lbs N/ac at flowering to push protein above 14% without sacrificing yield. Finally, weather conditions matter hot, dry forecasts increase volatilization risk and reduce uptake efficiency, so farmers should consider moving applications earlier if low humidity conditions are expected.
Split Application Caveat * Note from Arnall.
The caveat to the it only takes one pass, is high yielding >85+ bpa, environments. In these situation I still have not found any value for preplant nitrogen application. I have seen however a split spring application is valuable. Basically putting on 30-50 lbs at green-up, with the rest following at jointing (hollowstem). The method tends to reduce lodging in the high yielding environments.
This work was published in Front Plant Sci. 2025 Nov 6;16:1698494. doi: 10.3389/fpls.2025.1698494
Split nitrogen applications provide no benefit over a single well timed application in rainfed winter wheat
Another reason to N-Rich Strip.
Yet just one more data set showing the value of in-season nitrogen and why the N-Rich Strip concept works so well.
Questions or comments please feel free to reach out.
Brian Arnall b.arnall@okstate.edu
Acknowledgements:
Oklahoma Wheat Commission and Oklahoma Fertilizer Checkoff for Funding.
Laboratory evaluation of Liquid Calcium
Liquid calcium products have been around for a long time. The vast majority of these products are either a calcium chloride or chelated calcium base which is now commonly found with the addition of a humic acid, microbial, or micronutrient. Many of these make promises such as “raises your soil pH with natural, regenerative, liquid calcium fertilizers that correct soil pH quickly, efficiently, and affordably!”. From a soil chemistry aspect the promise of adding 3 to 5 gallons of a Ca solution, which is approximately 10% Ca, will raise the soil pH is impossible on a mass balance approach. In this I mean that to increase the pH of an acid soil {soil pH is the ratio of hydrogen (H) and hydroxide (OH) in the soil, and having an acid soil means the concentration of H is greater than that of OH} requires a significant portion of the H+ that is in solution and on soil particle to be converted to OH, or removed from the system entirely.
The blog below walks through the full chemical process of liming a soil but in essence to reduce the H+ concentration we add a cation (positively charged ion) such as Ca or magnesium (Mg) which will kick the H+ of the soil particle and a oxygen (O) donator such as CO2 with ag lime or (OH)2 which is in hydrated lime. Each of these O’s will react with two H’s to make water. And with that the pH increases.
However regardless of the chemistry, there is always a lot of discussion around the use of liquid calcium Therefore we decided to dig into the question with both field and laboratory testing. This blog will walk through the lab portion.
This was a laboratory incubation study. The objective was to evaluation the impact of the liquid Ca product (LiqCa**) on the soil pH, buffer capacity, Ca content and CEC of two acidic soils. LiqCa was applied at three rates to 500 g of soil. The three rates were equivalent to 2, 4, and 6 gallon per acre applied on a 6” acre furrow slice of soil. One none treated check and two comparative products were also applied. HydrateLime (CaO) as applied at rate of Ca equivalent to the amount of Ca applied via LiqCa, which was approximately 1.19 pounds of Ca per acre. Also AgLime (CaCO3) was applied at rates equivalent to 1, 2, and 4 ton effective calcium carbonate equivalency (ECCE). The Ag lime used in the study had a measured ECCE of 92%. The two soils selected for both acidic but had differing soil textures and buffering capacities. The first LCB, had an initial soil pH (1:1 H2O) of 5.3 and a texture of silty clay loam and Perkins had a initial pH of 5.8 and is a sandy loam texture. Both soils had been previously collected, dried, ground, and homogenized. In total 10 treatments were tested across two soils with four replications per treatment and soil.
Project protocol, which has been used to determined site specific liming and acidification rates, was to apply the treatments to 500 grams of soil. Then for a period of eight weeks this soil wetted and mixed to a point of 50% field capacity once a week then allowed to airdry and be mixed again. At the initiation and every two weeks after soil pH was recorded from each treatment. The expectation is that soil pH levels will change as the liming products are impacting the system and at some point, the pH reaches equilibrium and no longer changes. In this soil that point was week six however the trail was continued to week eight for confirmation. See Figures 1 and 2.
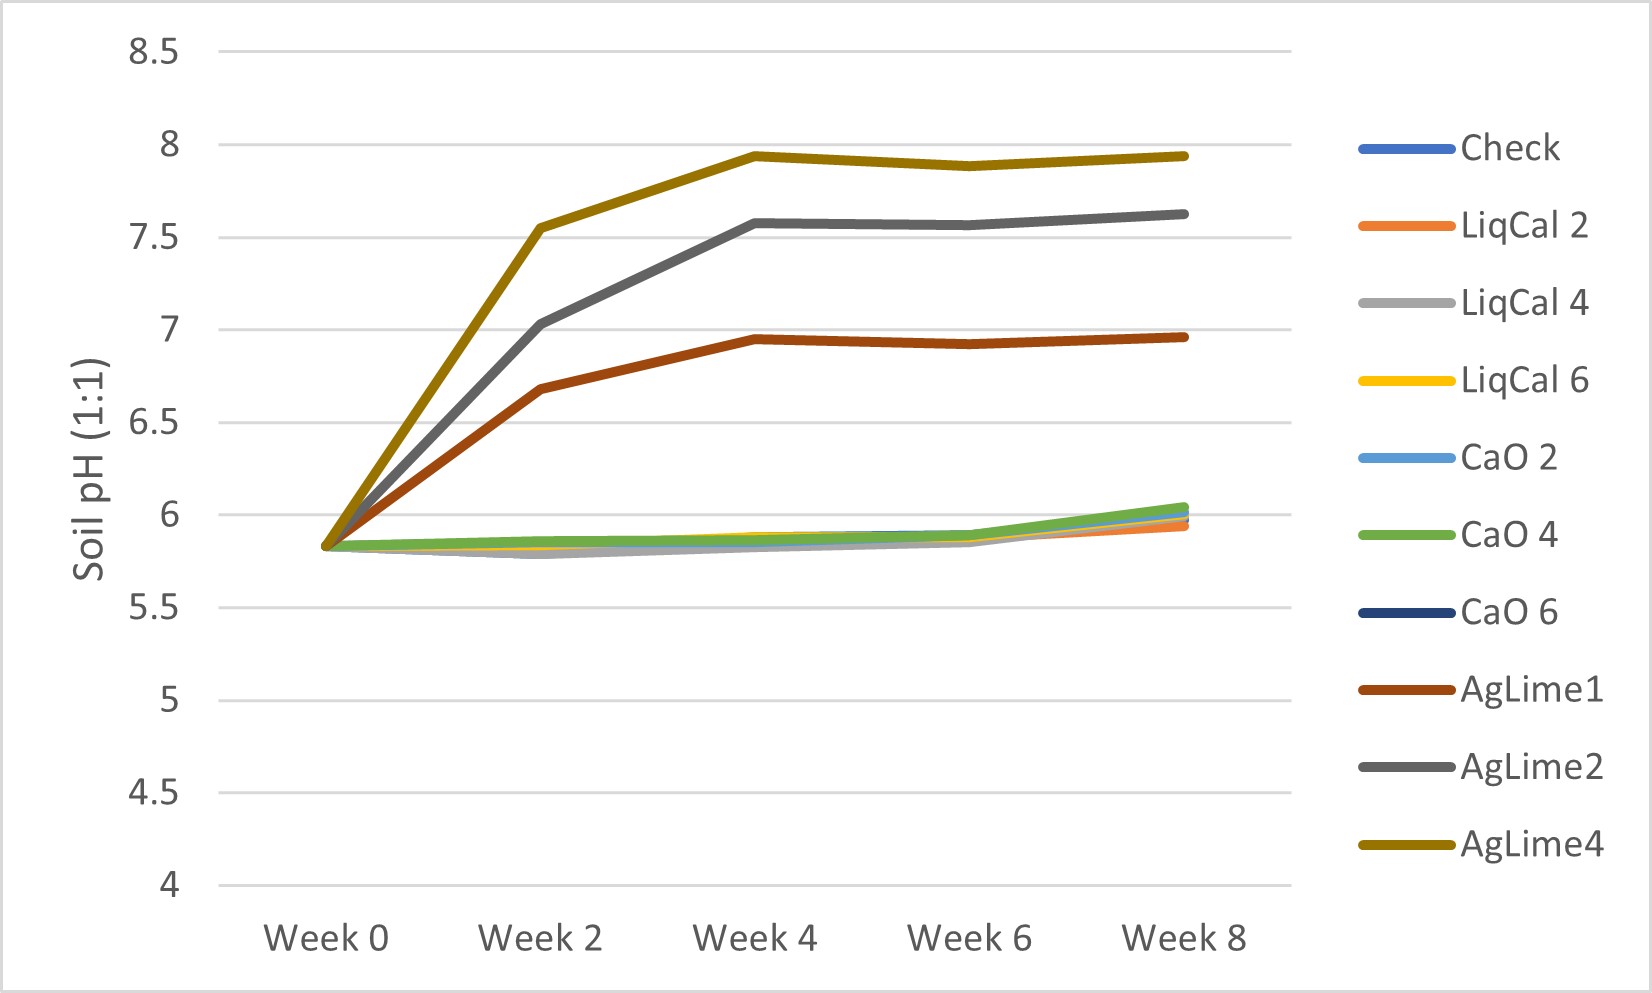
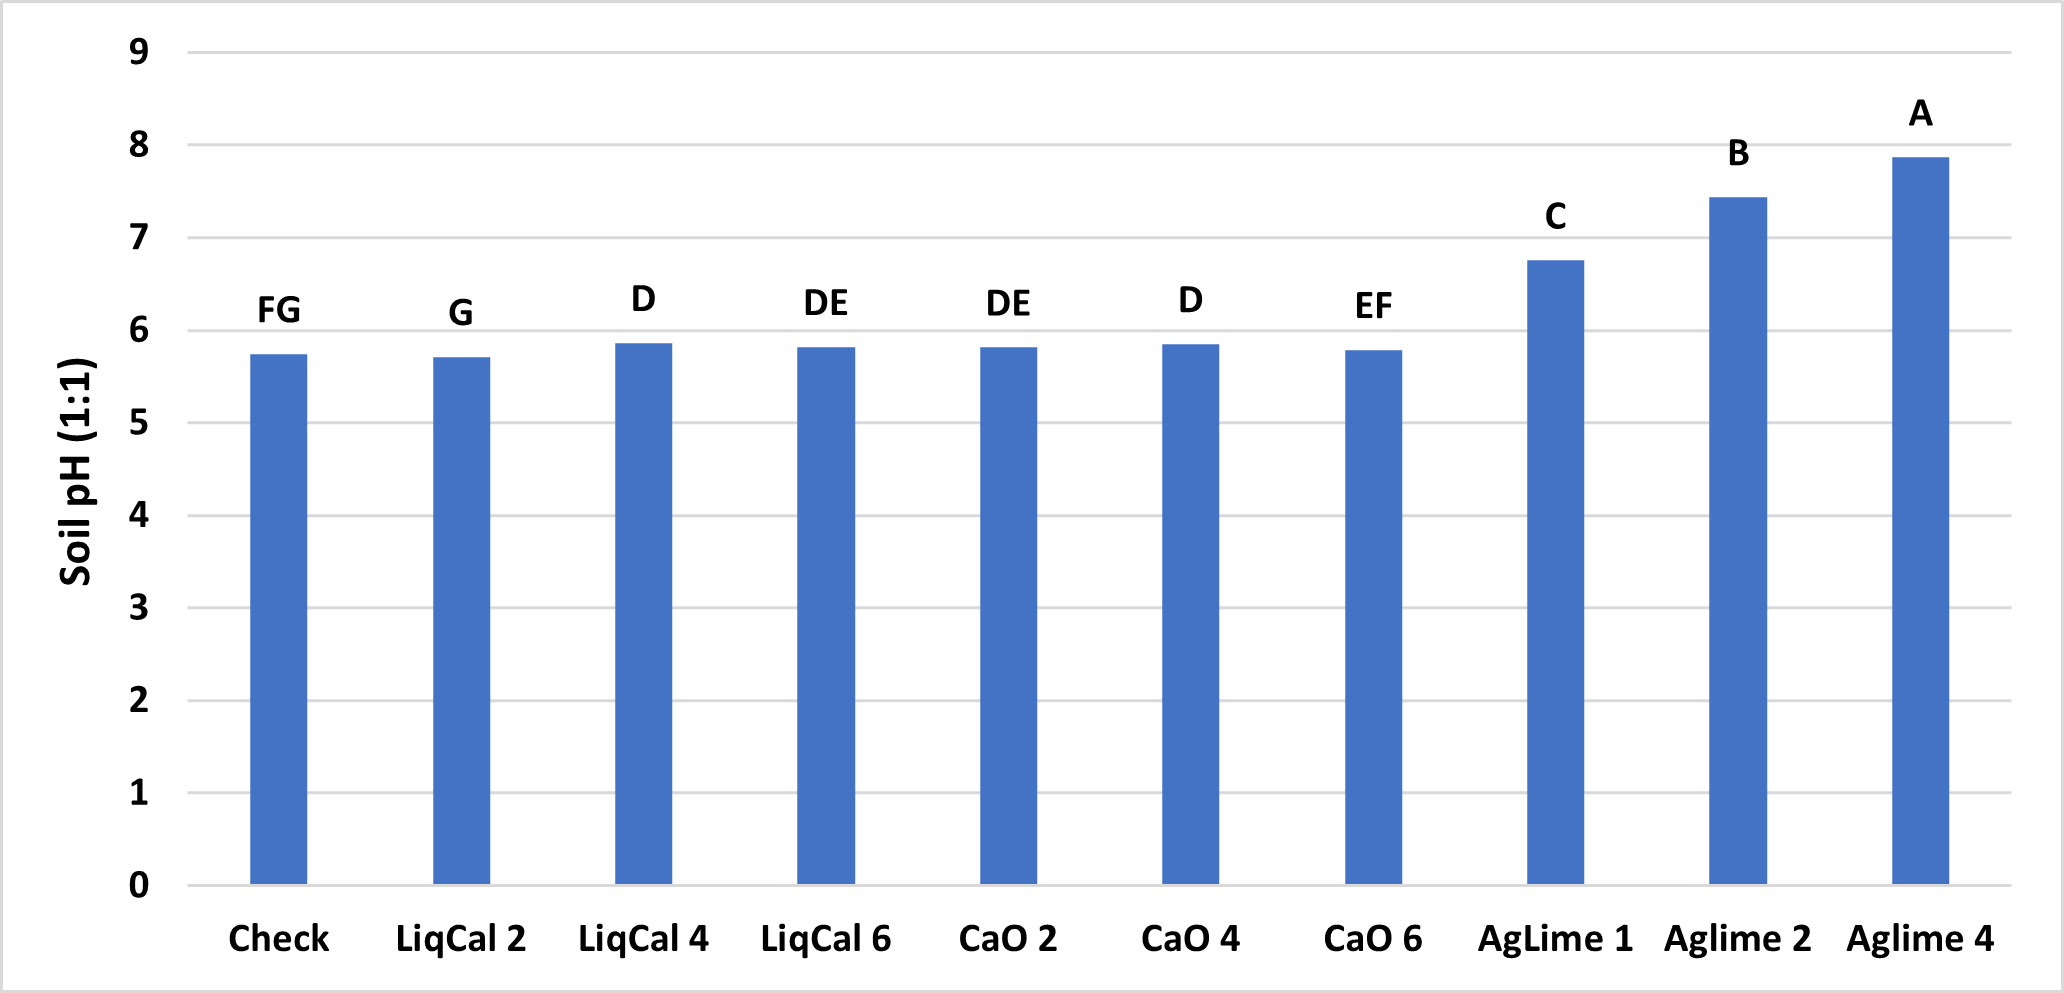
ANOVA Main effect analysis showed that Soil was not a significant effect so therefore both soils were combined for further analysis. Figure 3 shows the final soil pH of the treatments with letters above bars representing significance between treatments. In this study all treatments were significantly greater than the check with exception of LiqCal 2 and CaO 6. Neither LiqCal or CaO treatments reached the pH level of Aglime, regardless of rate.


Summary
The incubation study showed that application of LiqCal at a rate of 4 and 6 gallons per acre did significantly increase the soil pH by 0.1 pH units and 6 gallons per acre increased the Buffer index above the check by 0.03 units. Showing the application of LiqCal did impact the soil. However the application of 1 ton of Ag lime resulted in significantly great increase in soil pH, 1.0 units by 8 weeks and a buffer index change of 0.2 units. The Aglime 1 was statistically greatly than all LiqCal treatments. Ag lime 2 and 4 were both statistically greater than Ag lime 1 with increasing N rate with increasing lime rate. Given the active ingredient listed in LiqCal is CaCl, this result is not unexpected. Ag lime changes pH by the function of CO3 reacting H+ in large quantities. In a unsupported effort a titration was performed on LiqCal, which show the solution was buffered against pH change. However it was estimated that a application of approximately 500 gallons per acre would be needed to sufficiently change the soil pH within a 0-6” zone of soil.
Results of the field study.
https://osunpk.com/2025/06/02/field-evaluation-of-lime-and-calcium-sources-impact-on-acidity/
Take Home
The application of a liquid calcium will add both calcium and chloride which are plant essential nutrients and can be deficient. In a soil or environment suffering from Cl deficiency specifically I would expect an agronomic response. However this study suggest there is no benefit to soil acidity or CEC with the application rates utilized (2, 4, and 6 gallon per acre).
** LiqCal The product evaluated was derived from calcium chloride. It should be noted that since the completion of the study this specific product used has changed its formulation to a calcium chelate. This change however would not be expected to change the results as the experiment did include a equivalent calcium rate of calcium oxide.
Other articles of Interest
https://extension.psu.edu/beware-of-liquid-calcium-products
https://foragefax.tamu.edu/liquid-calcium-a-substitute-for-what/
Any questions or comments feel free to contact me. b.arnall@okstate.edu
Nitrogen and Sulfur in Wheat
Brian Arnall, Precision Nutrient Management Specialist
Samson Abiola, PNM Ph.D. Student.
Nitrogen timing in wheat production is not a new topic on this blog, in-fact its the majority. But not often do we dive into the application of sulfur. And as it is top-dressing season I thought it would be a great opportunity to look at summary of a project I have been running since the fall of 2017 which the team has call the Protein Progression Study. The objective was to evaluate the impact of N and S application timings on winter wheat grain yield and protein. With a goal of looking at the ratio of the N split along with the addition of S and late season N and S, in such a way that we could determine BMP for maximizing grain yield and protein.
My work in the past has shown two things consistently, that spring N is better on the average and S responses have been limited to deep sandy soils in wet years. Way back when (2013) on farm response strips showed high residual N at depth and no response to S. https://osunpk.com/2013/06/28/response-to-npks-strips-across-oklahoma/. But there has been a lot of grain grown since that time expectations are that we should/are seeing an increase in S response. In fact Kansas State is seeing more S response, especially in the well drained soils in east half of the state.
Some KSU Sulfur works.
https://www.ksre.k-state.edu/news/stories/2022/04/video-sulfur-deficiency-in-wheat.html
https://eupdate.agronomy.ksu.edu/article/sulfur-deficiency-in-wheat-364-1
Click to access sulphur-in-kansas-plant-soil-and-fertilizer-considerations_MF2264.pdf
So the Protein Progression Project was established in 2017 and where ever we had space we would drop in the study. So in the end across six seasons we had 13 trials spread over five locations. Site-years varied by location: Chickasha (2018-2022), Lake Carl Blackwell (2018-2023), Ballagh (2020), Perkins (2021), and Caldwell (2021).

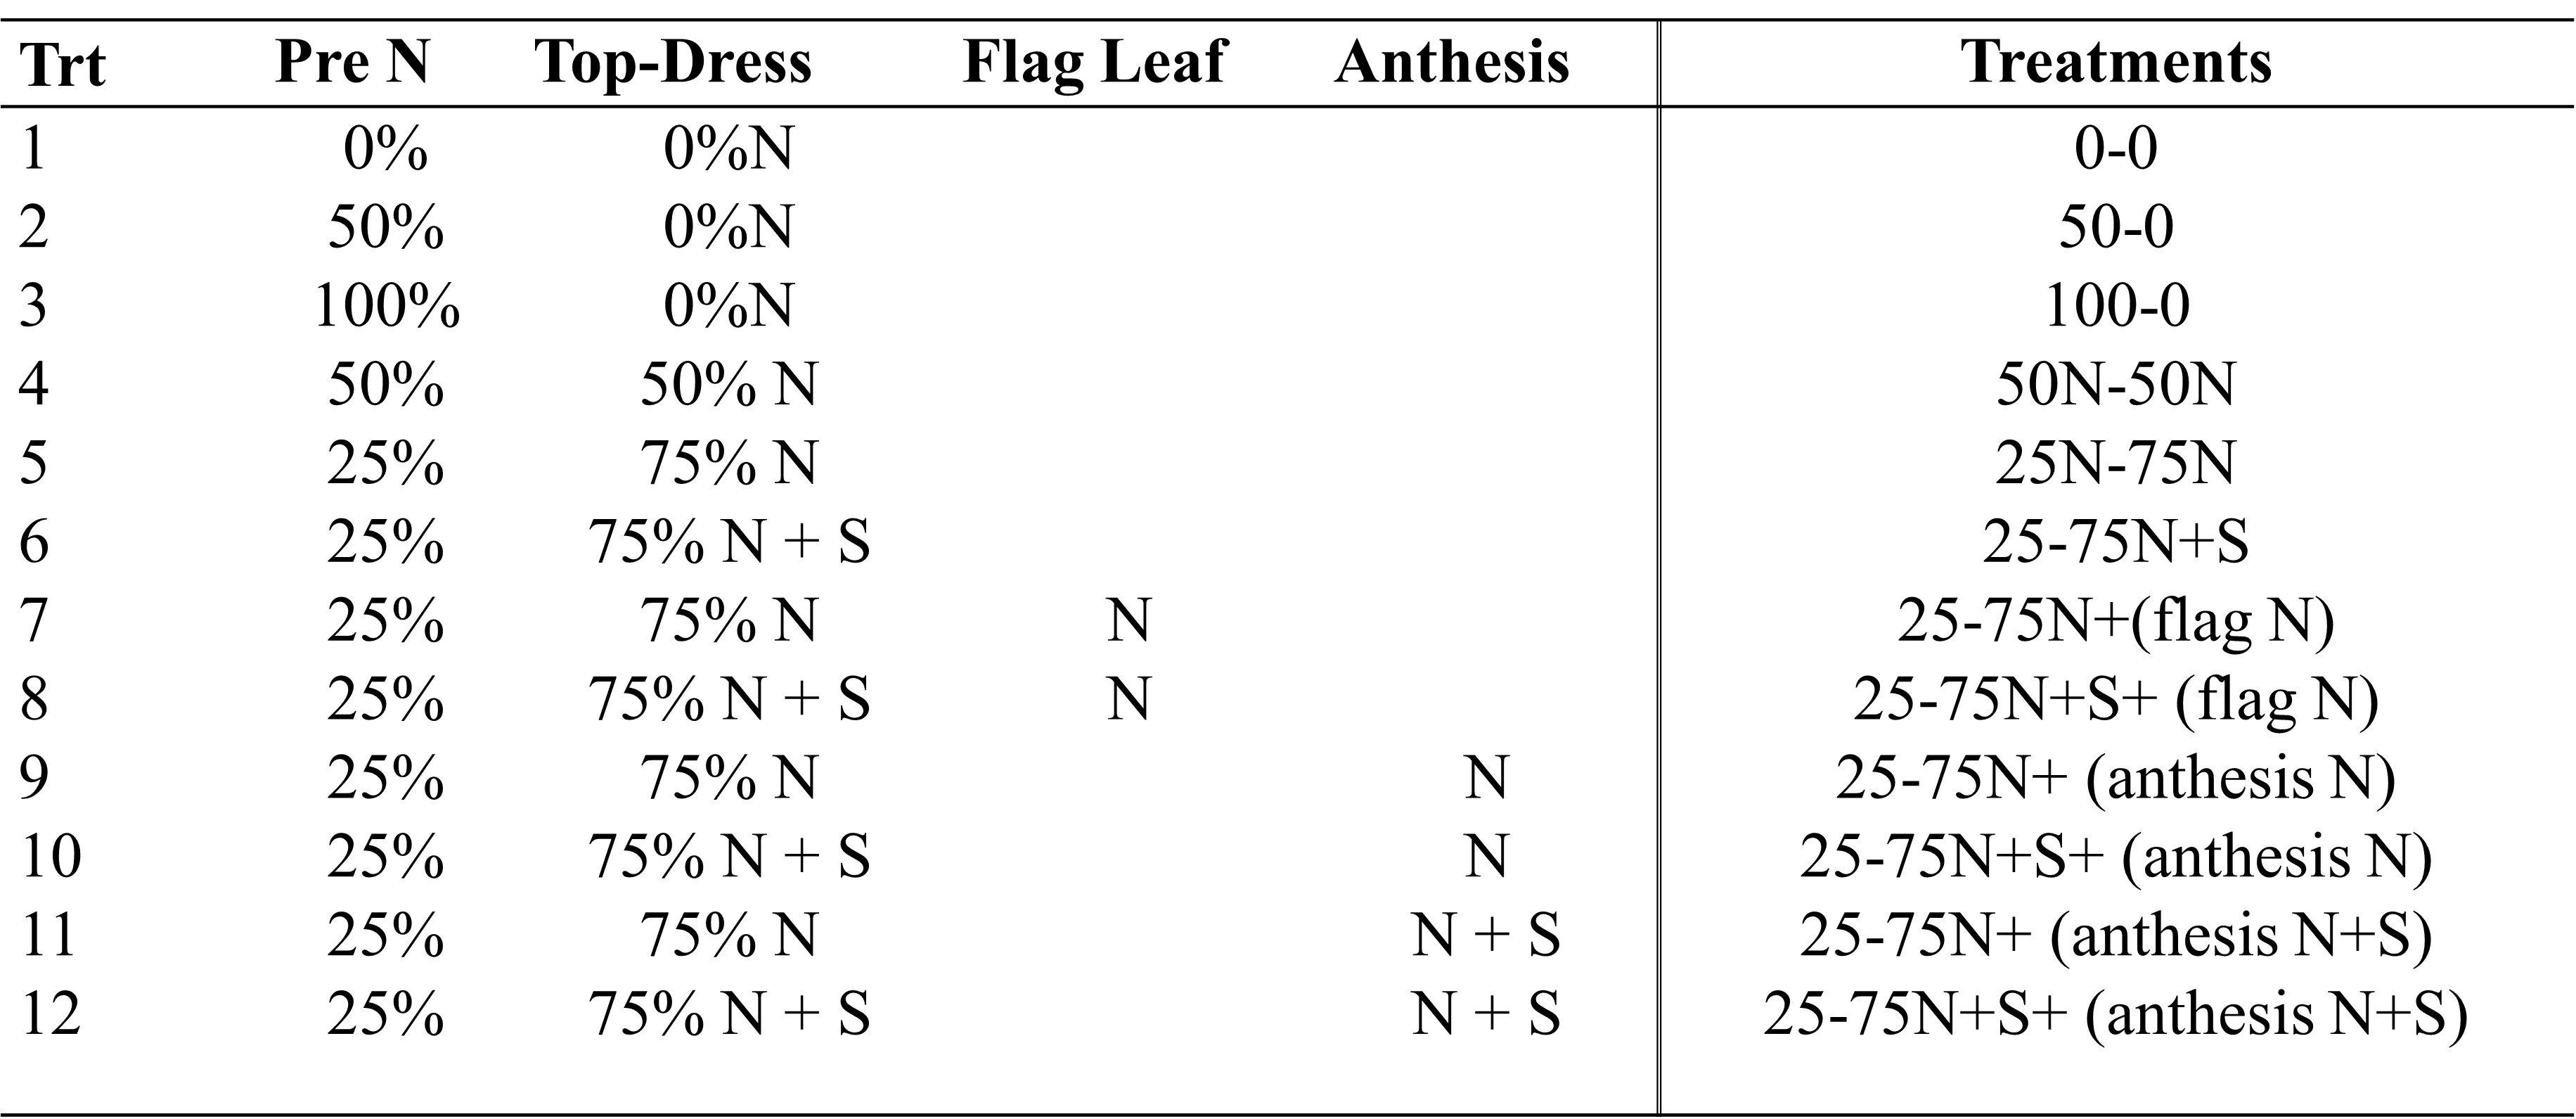
First lets just dive into the the N application were we looked at 100% pre vs 50-50 split and 25-75 split (Table 2.) Based upon the wealth of previous work https://osunpk.com/2022/08/26/impact-of-nitrogen-timing-2021-22-version/, its not much of a surprise that split application out preformed preplant and that having the majority applied in-season tended to better grain yields and protein values.

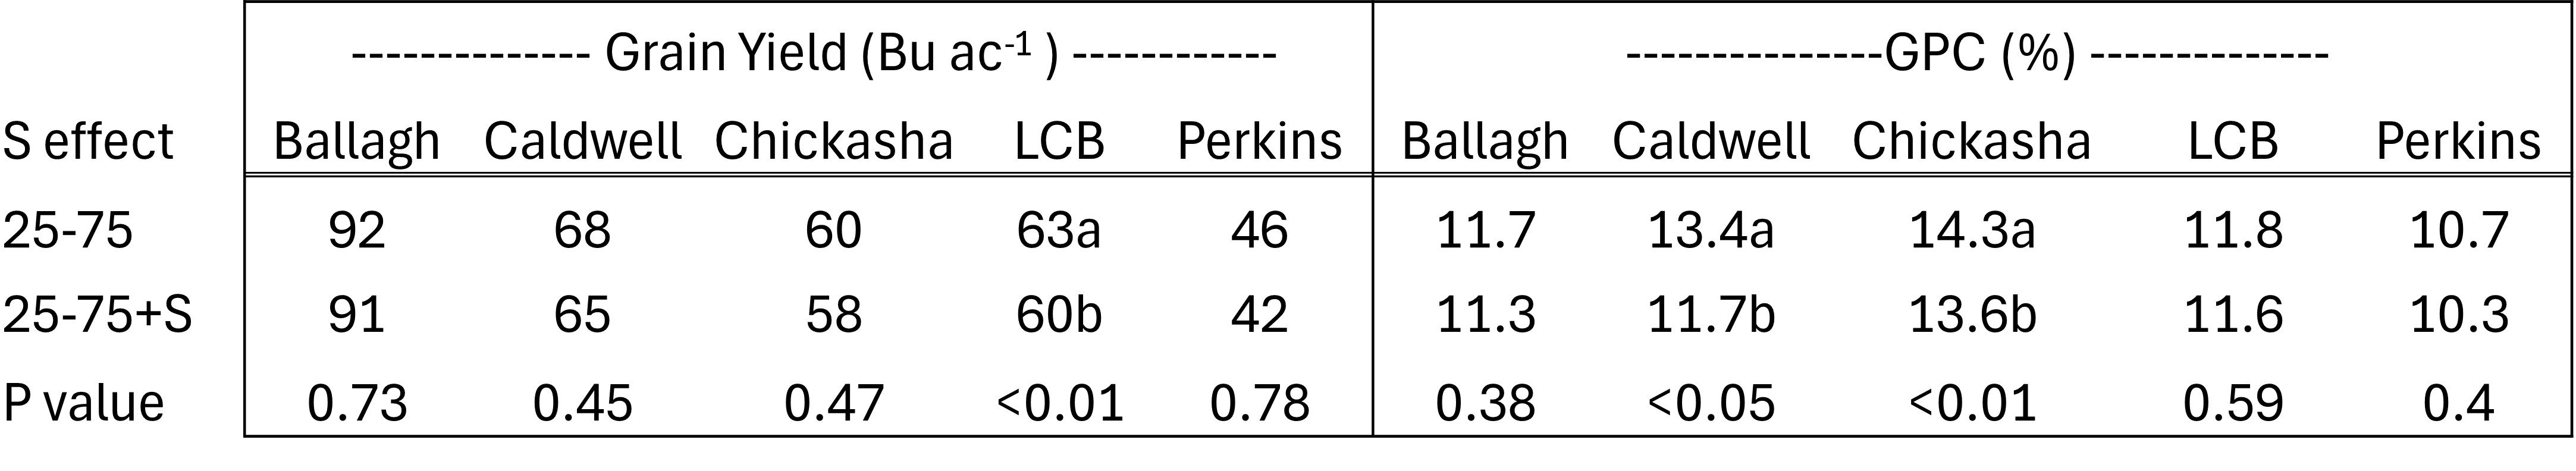
This next table is were things get to be un-expected. While the data below is presented by location, we did run each site year by itself. In no one site year did S statistically, or numerically increase yield. As you can see in Table 2 below, the only statistical response was a negative yield response to S. And you can not ignore the trend that numerically, adding S had consistently lower yields. Even more surprising was the same trend was seen in Protein.
One aspect of Protein Progression trials were that while 0-6″ soil test S tended to be low. We would often find pretty high levels of S when we sampled deeper, especially when there was a clay increase with depth. Sulfur tends to be held by the clay in our subsoil. We are also looking at better understanding the relationship between N and S. In fact a review article published in 2010 discussed that the N and S ratio can negative influence crop production when either one of the elements becomes un-balanced. For example we are seeing more often in corn that when N is over applied we can experience yield loss, unless we apply S. Meaning at 200 lbs of N we make 275 BPA, at 300 N lbs we make 250, but 300 N plus 20 S we can make 275 again. Part of the rationale is that excessive N limits S mineralization. On the flip side if S is applied while N is deficient and yield decrease could be experienced. Maybe that is what we are seeing in this date. Either way, this data is why the Precision Nutrient Management program is spending a fair amount of efforts in understanding the N x S relationship in wheat (which we are looking at milling quality also) and corn.
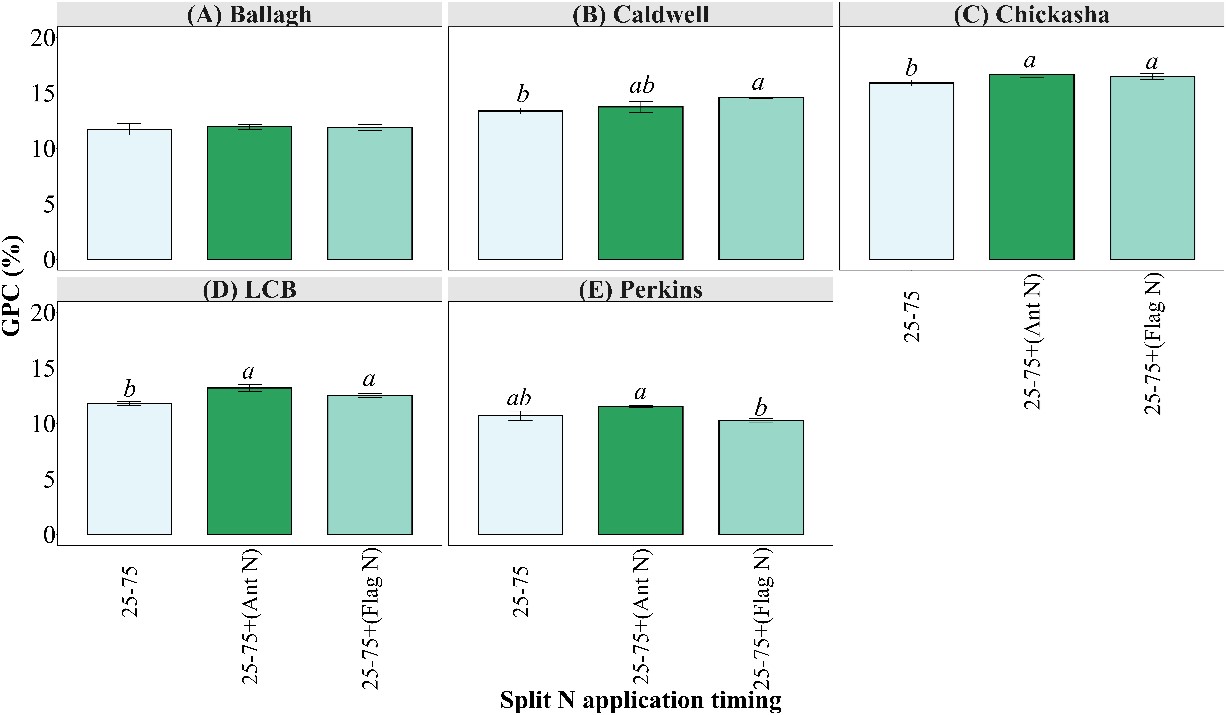
A quick dive into increasing protein with late N applications. At three of the five location GPC was significantly increased with Late N. In most cases the anthesis (flowering) application was the highest with exception of Caldwell. We will have another blog coming out in a month that digs into anthesis applied N at a much deeper level, looking at source, nozzle and droplet sizes.
Looking at this study in a vacuum we can say that it probably best to split apply your N and that in central and northern Ok the addition of S in rainfed wheat doesn’t offer great ROI. If I look at the whole picture of all my work and experience I would offer this. For grain only wheat, the majority if not all N should be applied in-season sometime between green up and two weeks after hollow stem. I have had positive yield responses to S applied top-dress, but it has always been deep sandy soils and wet seasons. I have not have much is any response to S in heavier soil, especially if there is a clay increase in the two feet of profile. So my general S recommendation is 10 lbs in sandy soils and if you show low soil test S in heavier ground and you are trying to push grain yields, then you could consider the addition of S as a potential insurance. That said, I haven’t seen much proof of it.
Take Homes
* Split application of nitrogen resulted in higher grain yields and protein concentrations when compared to 100% preplant.
* Putting on 75% of the total N in-season tended to result in higher grain yields and protein concentrations when compared to 50-50 split.
* Adding 10 lbs of S topdress did not result in any increase in grain yield or protein.
A big Thanks to the collaborators providing on-farm locations for this project. Ballagh Family Farms, Turek Family Farms and Tyler Knight.
Citation. Jamal, A.,*, Y. Moon, M. Abdin. 2010 Review article. Sulphur -a general overview and interaction with nitrogen. AJCS 4(7):523-529 (2010). ISSN:1835-2707.
Any questions or comments feel free to contact me. b.arnall@okstate.edu
