Home » Posts tagged 'farming'
Tag Archives: farming

Corn Hybrids’ Yield Response to Limited Well Capacities in the Central High Plains
Macie McPeak: M.S in Irrigation and Water Management
Sumit Sharma : Extension Specialist for High Plains Irrigation and Water Management
Background
The Central High Plains, which include the Oklahoma Panhandle, Southwest Kansas, Southeast Colorado, and Northern Texas Panhandle, is a heavily farmed semi-arid region that depends on the Ogallala Aquifer for irrigation to ensure stable crop yields. However, the continuous decline of the Ogallala Aquifer has resulted in increased need for irrigation strategies that conserve water while maintaining crop profitability. Corn remains the most water consuming crop with highest productivity per unit of irrigation applied, and strong economic returns in the Central High Plains region. However, corn is also the most sensitive to water stress among all the existing cropping systems (including sorghum, cotton, and sunflower, soybeans and wheat). Declining water table has reduced the well capacities in many areas in the region, which cannot meet crop water demand, making it a growing challenge for corn production. Therefore, there is a need for research in irrigation strategies and agronomic choices such as drought tolerant hybrids, seeding rate, planting date, and hybrid maturity for sustainable and profitable corn production with reduced well capacities in the region. This blog discusses the yield response of different corn hybrids to limited well capacities in the Oklahoma Panhandle area of the Central High Plains.
Limited well capacities only meet partial crop water demand, which in general leads to yield declines especially in high water demanding crops such as corn. Several previous studies suggest that crop productivity does not significantly decrease as long as irrigation is maintained at approximately 75–80% of full evapotranspiration (ET) replacement (Su et al., 2022; Klocke et al., 2007; Zhao et al., 2019). However, when irrigation levels are more restricted, such as under reduced well capacities, there can be substantial yield losses and diminished economic returns. The magnitude of yield reduction varies with region, hybrids, and growth stage at which water stress occurred. For example, in the Central High Plains the corn ET demand is highest in Texas Panhandle and decreases as we move north towards Nebraska. Zhao et al. (2019) found that applying 75% ET in the Texas Panhandle produced corn yields equivalent to full irrigation, whereas reducing irrigation to 50% caused significant yield reductions. Similarly, Klocke et al. (2007) reported that limited irrigation at roughly 50% of full ET replacement in Nebraska achieved 80–90% of fully irrigated yields across multiple crop rotations. Therefore, the irrigation strategies which work in one region may not work the same way in other regions with different crop water demand and must be tested for the region-specific climatic conditions.
The current study was conducted in 2025 at the Oklahoma Panhandle Research and Extension Center in Goodwell, OK. Four Pioneer brand corn hybrids including P13777 (113 day maturity), P10625 (110 day maturity), P05810 (105 day maturity), and P14346 (114 days maturity) were planted at 22,000 and 28,000 seeds per acre. The hybrids were irrigated with a center pivot fitted with variable rate irrigation system at 200, 300, 400, and 500 GPM well capacities. The well capacities were simulated by adjusting the frequency of irrigation events.
Results & Discussion
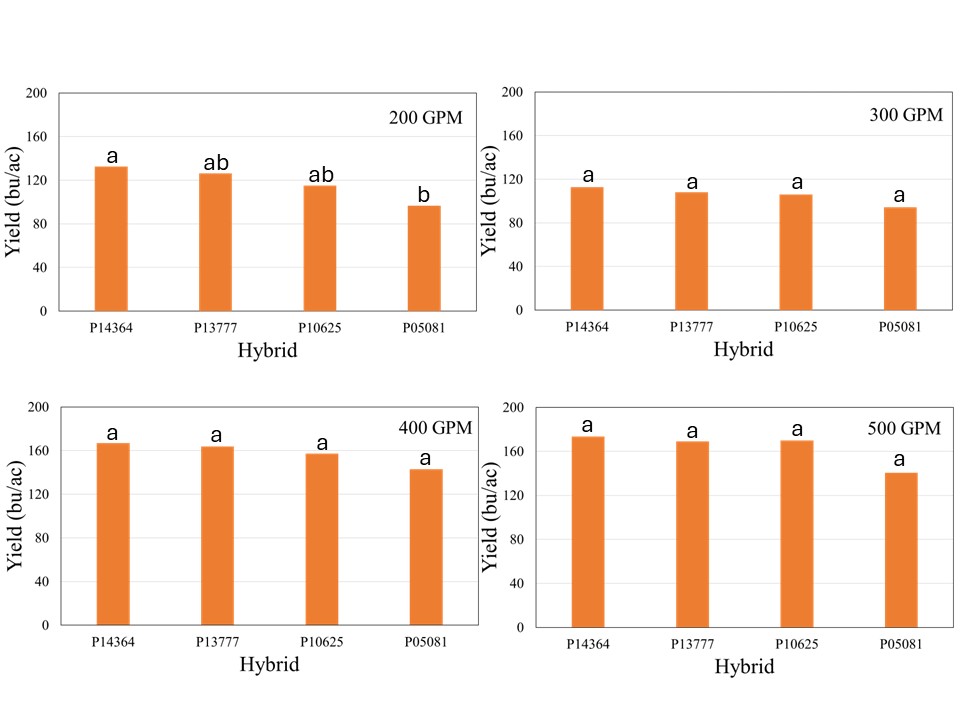
The crop received 12.1 inches of rain from planting until physiological maturity, while total rainfall from April till September was over 15 inches. Manual probing of the field showed near 4 feet soil profile at the time of planting which can hold up to 2 inches of plant available water per foot. The well capacities 200, 300, 400, and 500 GPM treatments received 7.4, 8.9, 10.8, and 12.0 inches of irrigation, respectively. The data showed no significant effect of population on corn yield across hybrids for any well capacity. However, the hybrids showed significant interaction with well capacities, which indicated that hybrid yield response varied at different capacities (Figure 1). In general, the average yield declined from longest maturity to shortest maturity hybrids irrespective of the well capacity, but was only statistically significant at for 200 GPM (Figure1). At this irrigation level, the shortest maturity hybrid P05081 yielded significantly lower yield than longest maturity hybrid P14364, while P13777 and P10625 were not different from either of these two hybrids.
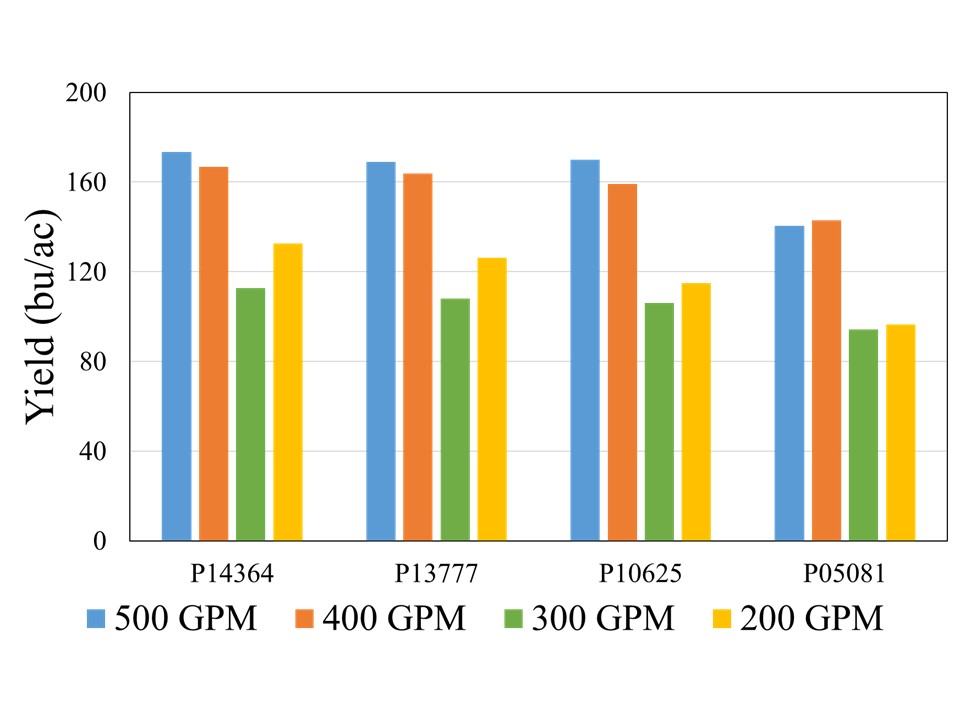
Although there was no statistical difference among the hybrids at 500, 400, and 300 GPM, when compared across well capacities, yield reductions were most pronounced at the 200 and 300 GPM irrigation levels for each individual hybrid, indicating that irrigation capacity was the primary yield limiting factor under restricted water availability (Figure 2). While the exact causes of this abrupt decline are not yet understood, as mentioned in the beginning of this blog, previous literature has suggested that severe yield decline in corn can be expected when irrigation is reduced to 60% ET replacement in the study region. Both 300 and 200 GPM well capacities met 60 and 65% crop ET demand, while 400 and 500 GPM met 71 and75% crop ET demand, respectively. More data will be needed to ascertain these threshold levels of well capacities for corn production in this region.
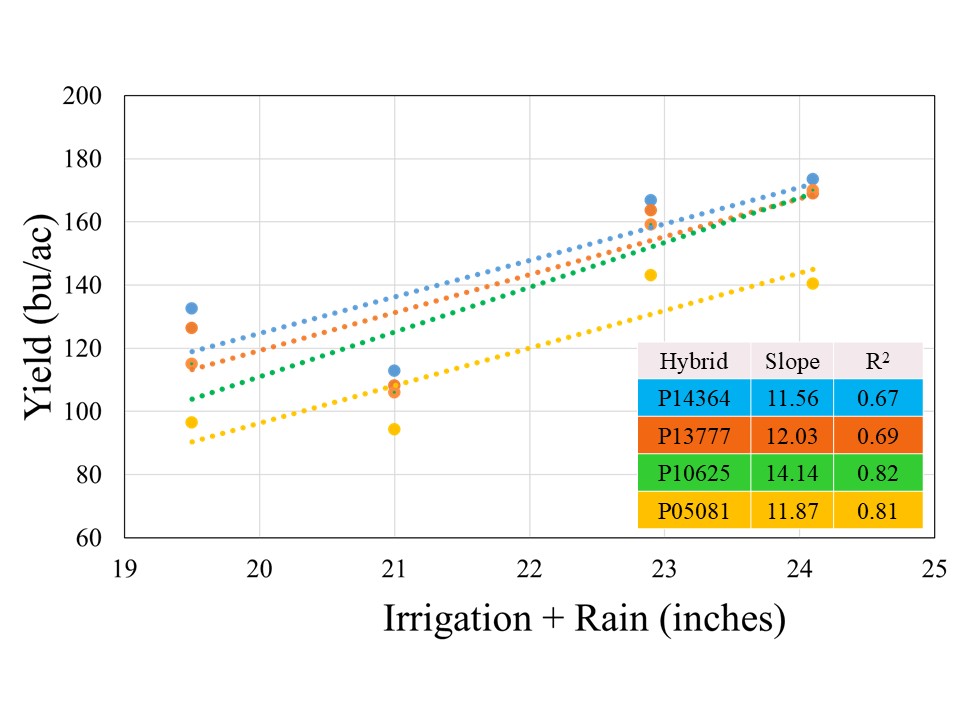
All the hybrids showed a positive yield response to Irrigation+Rain with different yield gains per inch of water applied (Figure 3). Hybrid P10625 registered highest yield gain of 14.1 bushel per inch of water applied, followed by P13777 (12.0 bu), P05081 (11.9 bu), and P14364 (11.6 bu). The stronger coefficient of regression (>80%) for two short maturity varieties indicated that irrigation was stronger yield limitation factor for these hybrids, in comparison to 114 and 113-day maturity hybrids for irrigation explained on 67 and 69% variability, respectively. This suggests that besides irrigation there might be other factors which could contribute to filling the yield gaps for given irrigation levels in longer maturity hybrids.
Planting population did not significantly affect grain yield across irrigation capacities. When pooled across the hybrids for individual planting populations, 28,000 seeding rates resulted in gain of 0.1, 2.6, 5, and 12 bushels per acre for 200, 300, 400, and 500 GPM, respectively. This indicates that higher planting populations at well capacities of 400 or above should be considered, while reducing population at 300 GPM or lower might be more cost-effective option.
Take Home
- Irrigation capacity remains the primary determinant of yield potential under limited well capacities in the Central High Plains.
- Pre-irrigation and recharging the soil profiles will be critical to support crop water demand for limited well capacities.
- Short maturity hybrids appeared to have consistently lower average yield and more vulnerable for yield losses at limited irrigation. However, one must consider that the growing conditions were more conducive for corn production in 2025 which generally favor long maturity hybrids. Therefore, long-term data will be required to assess the performance of short maturity hybrids during inclement growing seasons.
- Even though population didn’t significantly influence the grain yield. The 28,000 seeding rates overall had higher average yield at 400 and 500 GPM. Therefore, producers should consider the higher population at these well capacities or more.
- Overall, irrigation is the most important factor for yields, but there is a need for long-term agronomic data on hybrid maturity and population along with economic analysis to ascertain these findings.
PRE-EMERGENT RESIDUAL HERBICIDE ACTIVITY ON SOYBEANS, 2025
Liberty Galvin, Weed Science Specialist
Karina Beneton, Weed Science Graduate Student.
Objective
Determine the duration of residual weed control in soybean systems following the application of Preemergent (PRE) herbicides when applied alone and in tank-mix combination.
Why we are doing the research
PRE herbicides offer an effective means of suppressing early-season weed emergence, thereby minimizing competition during the critical early growth stage. However, evolving herbicide resistance and the need for longer-lasting weed suppression underscore the importance of evaluating multiple modes of action and their residual properties alone and tank-mixed.
Field application experimental design and methods
Field experiments were conducted in 2022, 2023, and 2024 growing seasons in Bixby, Lane, and Ft. Cobb FRSU Research Stations across Oklahoma. Each herbicide (listed in Table 1) was tested individually, in 2-way combinations, 3-way mixtures, and finally as 4-way combinations that included all active ingredients listed at the label rate.

Soybeans were planted at rates between 116,000 and 139,000 seeds/acre from late May to early June, depending on the year and location. The variety used belongs to the indeterminate mid- maturity group IV, with traits conferring tolerance to glyphosate (group 9 mode of action), glufosinate (group 10), and dicamba (group 4). Not all soybean varieties have metribuzin tolerance. Please read the herbicide label and consult your seed dealer for acquiring tolerant varieties. Row spacing was 76 cm at Bixby and Lane, and 91 cm at Fort Cobb. PRE treatments were applied immediately after planting at each experimental location.
POST applications consisted of a tank-mix of dicamba (XtendiMax VG® – 22 floz/acre), glyphosate (Roundup PowerMax 3®- 30 floz/acre), S-metolachlor (Dual II Magnum® – 16 floz/acre), and potassium carbonate (Sentris® – 18 floz/acre). Applications were made on different dates, mostly after the first 3 weeks following PRE treatments. These timings were based on visual weed control ratings, particularly for herbicides applied alone or in 2-way combinations, which showed less than 80% control at those early evaluation dates. The need for POST applications also depended on the species present at each site, with most fields being dominated by pigweed, as illustrated in the figure below.
Results
Tank-mixed PRE herbicide combinations generally provided superior residual control compared to a single mode of action application (Shown in Figure 1). Timely post-emergent (POST) herbicide applications helped sustain high levels of weed suppression, particularly as the effectiveness of residual PRE declined.

Residual control of tank-mixed PRE
Some herbicides applied alone or in simple 2-way mixes, such as sulfentrazone + chloransulam- methyl and pyroxasulfone + chloransulam-methyl required POST applications within 20 to 29 days after PRE, indicating moderate residual control.
In contrast, 2-way combinations containing metribuzin, such as sulfentrazone + metribuzin and pyroxasulfone + metribuzin, extended control up to 50 days after PRE in some cases, highlighting metribuzin’s importance even in less complex formulations.
Furthermore, 3-way and 4-way combinations including metribuzin provided the longest-lasting control, delaying POST applications up to 51–55 days after PRE.
Injury of specific weeds
Palmer amaranth (Amaranthus palmeri) control in Bixby was consistently high (≥90%) at 2 weeks after PRE in 2022 and 2024 across all treatments. At 4 WAPRE, treatments containing metribuzin alone or in combination maintained strong control (90% or greater).
Texas millet (i.e., panicum; Urochloa texana) and large crabgrass (Digitaria sanguinalis) were effectively managed with most treatments delivering over 90% control early in the season and maintaining performance throughout. In 2024, control remained generally effective, though pyroxasulfone alone showed a temporary lack of control for Texas millet, and single applications declined in effectiveness against large crabgrass later in the season. These reductions were likely due to continuous emergence and the natural decline in residual herbicide activity due to weather. The most consistent late-season control for both species came from 3- and 4-way herbicide combinations.
Morningglory (Ipomoea purpurea) control reached full effectiveness (100%) only when POST herbicides were applied, across all years and locations. Their late emergence beyond the residual window of PRE herbicides reinforces the importance of sequential herbicide applications for season-long control.
Take home messages:
- Incorporating PRE and POST herbicides slows the rate of herbicide resistance
- Tank mixing with *different modes of action* ensures greater weed control by having activity on multiple metabolic pathways within the plant.
- Tank mixing with PRE herbicides could reduce the number of POST applications required, and
- Provides POST application flexibility due to residual of PRE application
For additional information, please contact Liberty Galvin at 405-334-7676 | LBGALVIN@OKSTATE.EDU or your Area Agronomist extension specialist.
Management of soybean inoculum
Josh Lofton, Cropping Systems Specialist
Brian Arnall, Precision Nutrient Management Specialist
Soybean, a legume, can form a symbiotic relationship with Bradyrhizobium japonicum (Kirchner, Buchanan) and create their N to supplement crop demands. However, this relationship depends upon these beneficial microorganisms’ presence and persistence in the soil. This specific strain of microorganisms is not native to Oklahoma and thus must be supplemented using inoculum as a seed treatment. However, the use of inoculums alone does not guarantee a successful relationship. Handling, storage, soil conditions, and other factors can impact the ability of these microorganisms to do their job.
Soybean nitrogen demand is high, with most reports indicating that soybeans need 4.5 to 5.0 pounds of nitrogen per bushel of grain yield. This means that a 30-bushel crop requires between 135 and 150 pounds of nitrogen per acre (in comparison, corn and wheat need only 0.8 or1.6 pounds, respectively). This relationship has been shown to supply an equivalent of 89 lbs of N to the soil. In the previous example, these bacteria could fulfill 50-90% of nitrogen demand, reducing input costs significantly.
However, the bacteria associated with soybean inoculum are living organisms. Therefore, the conditions they experience before being applied to the seed and after treatment (including both before and following planting) can significantly impact their relationship with the soybean plant and, thus, their ability to provide N to the plant. By introducing a high concentration of bacteria near the seed and emerging root, this symbiotic relationship is more likely to be established quickly.
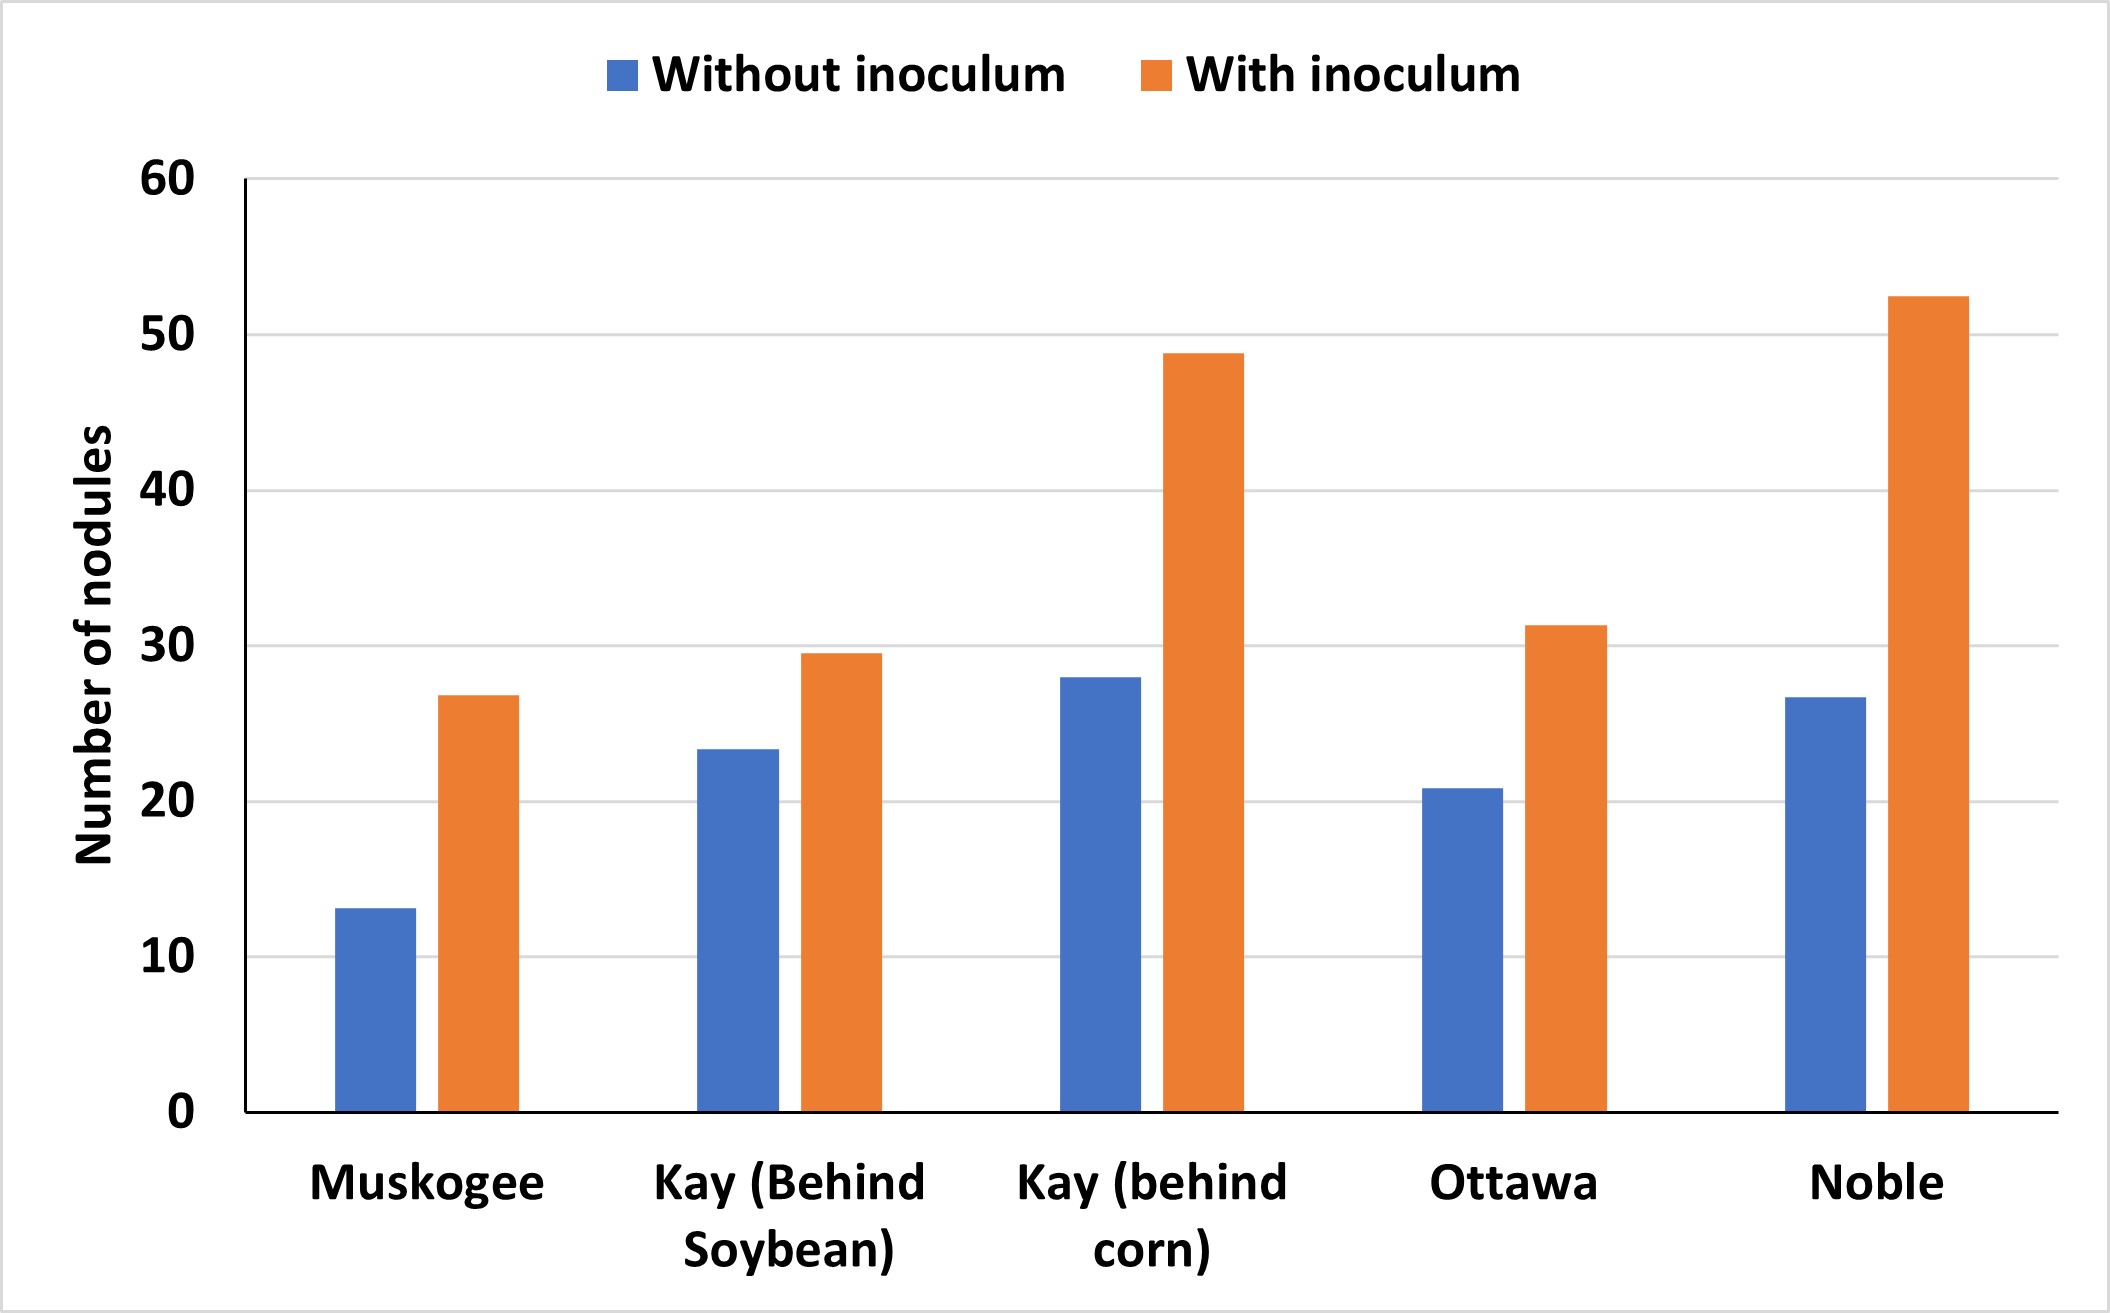
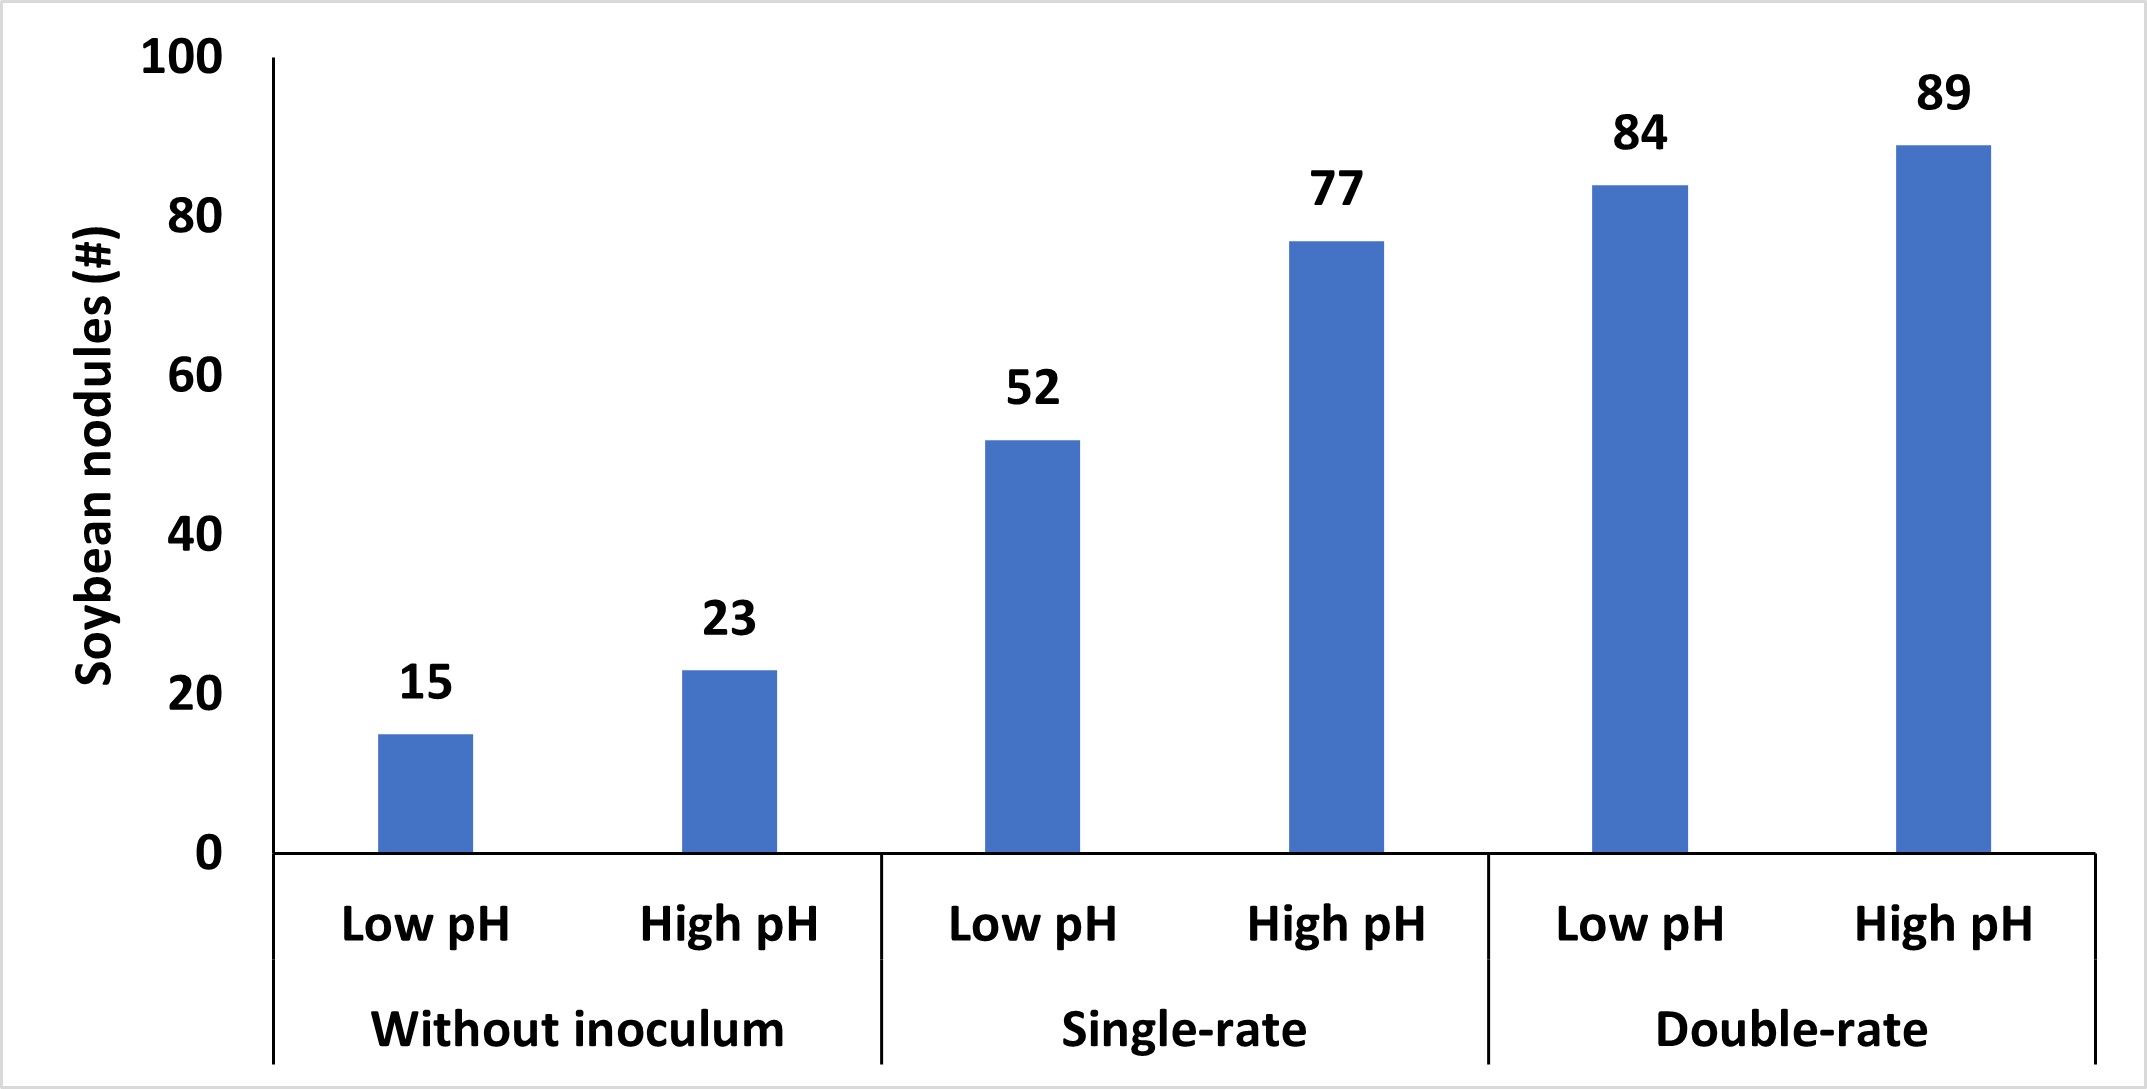
The importance of using inoculum is often debated in Oklahoma, particularly given the fluctuating prices of commodities and inputs. A recent assessment of various soybean-producing areas throughout the state revealed that most fields experienced advantages from incorporating soybean inoculation (Figure 1).
These benefits can be seen when the inoculum maintains viability until it is planted. It is always recommended that the bacteria be stored in a cool, dark environment before application on the seed. These conditions help preserve the survival of these bacteria outside of the host relationship. An evaluation of soybean inoculant after being stored short-term in different conditions found that in as little as 14 days, viability can decrease when kept in non-climate-controlled conditions (Figure 2). Additionally, viability was further reduced at 21 days when stored at room temperature compared to a refrigerated system
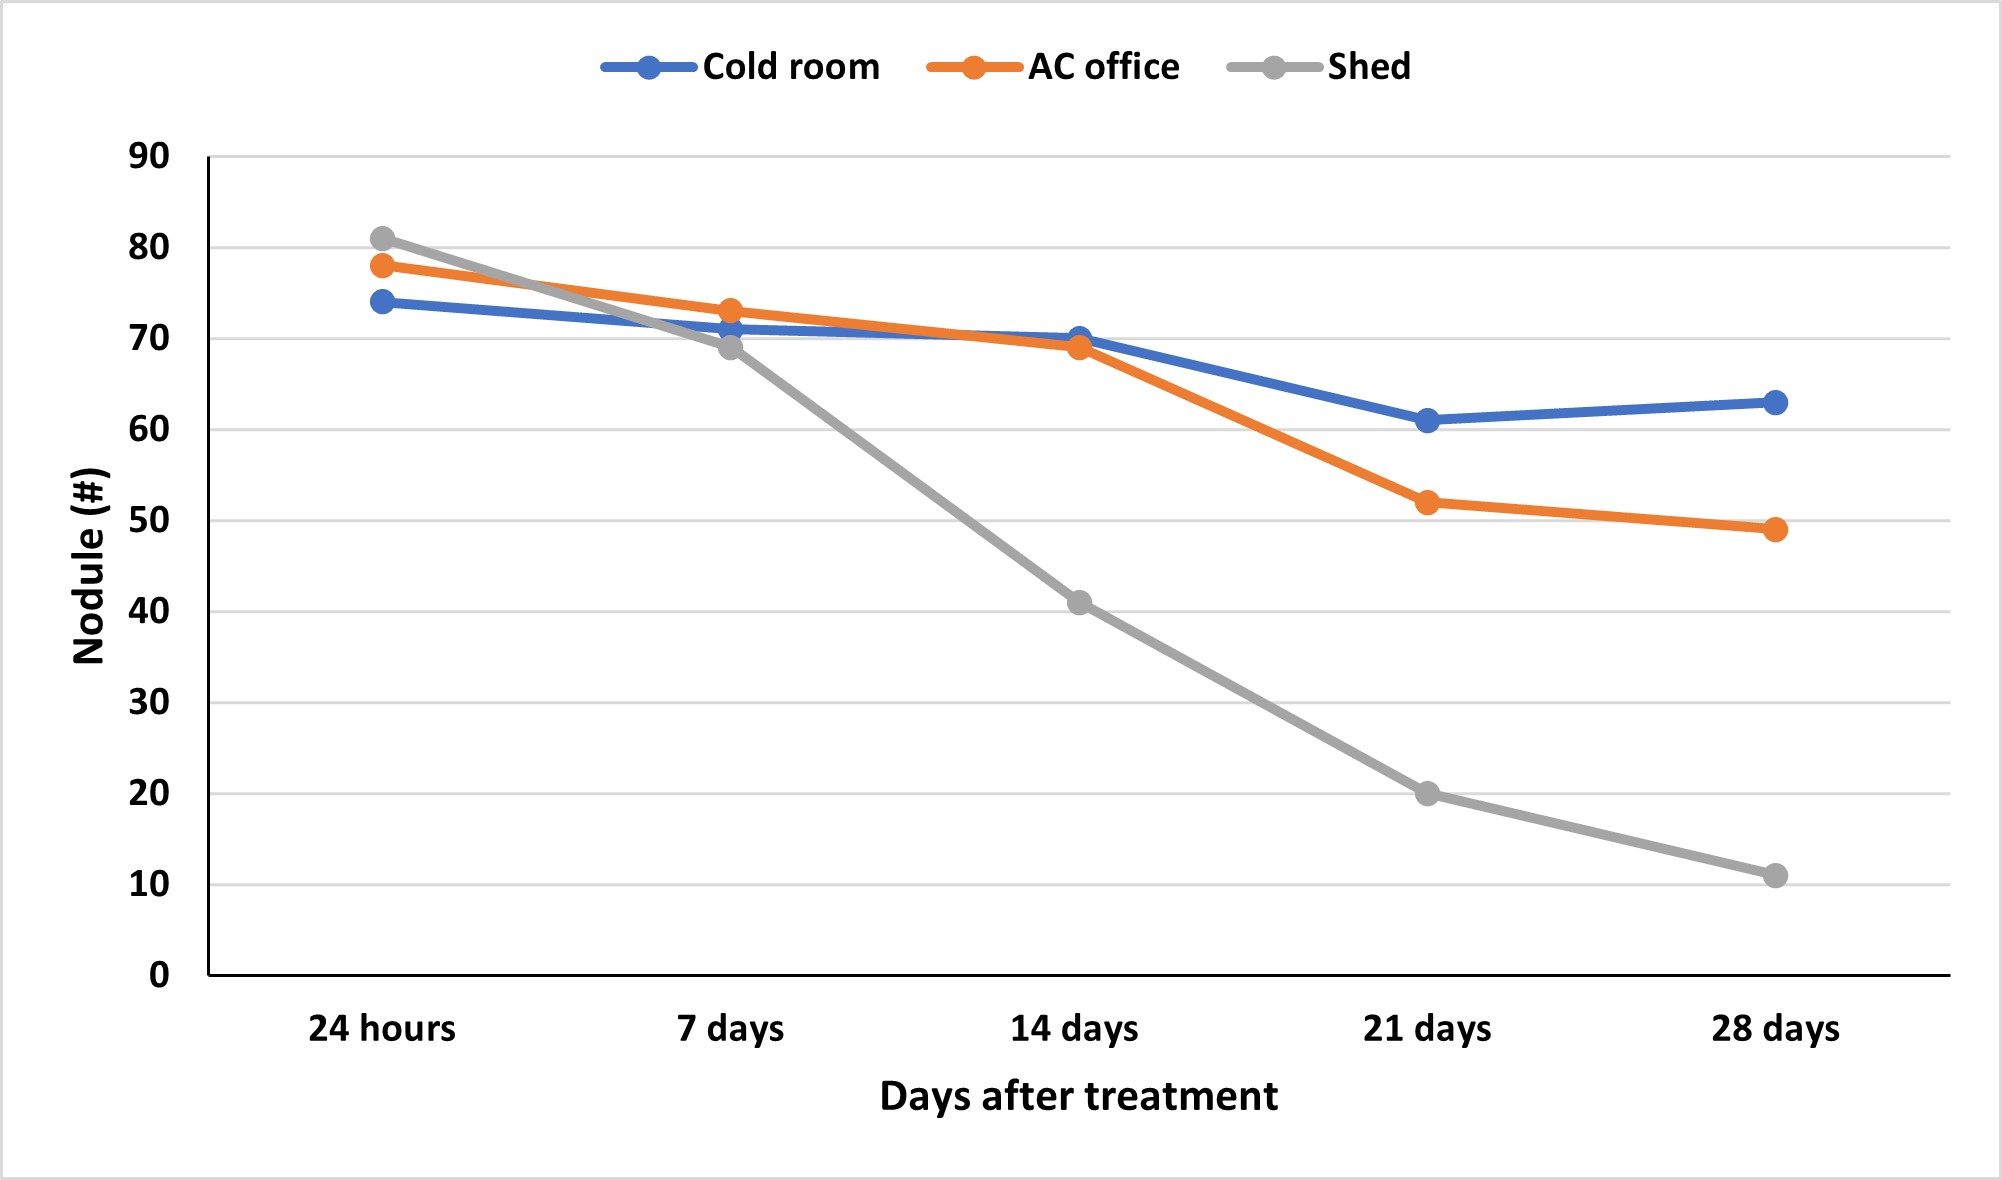
However, conditions colder than this, such as the use of a freezer, can compromise survival as well. Storing inoculum in the freezer forms ice crystals within the living cells and damages the cell membranes, making the microorganisms less likely to be alive upon rethawing. Additional chemicals can be added to increase the viability of long-term storage and sub-freezing temperatures. From an application standpoint, a new product should be purchased if additional storage is needed beyond short-term storage.
An additional question frequently arises: “How often should I inoculate my soybean?” As mentioned, these bacteria are not native to Oklahoma. As a result, they are not well adapted to survive in our environment and must outcompete native populations in the soil. Additionally, periods of hot and dry conditions appear to reduce the bacteria’s ability to survive without a host, the soybean roots. These are conditions we often observe in Oklahoma systems. Therefore, inoculation should be applied with every soybean planting to ensure a sufficient population of these bacteria. These bacteria promote root nodulation and nitrogen fixation in the soil.
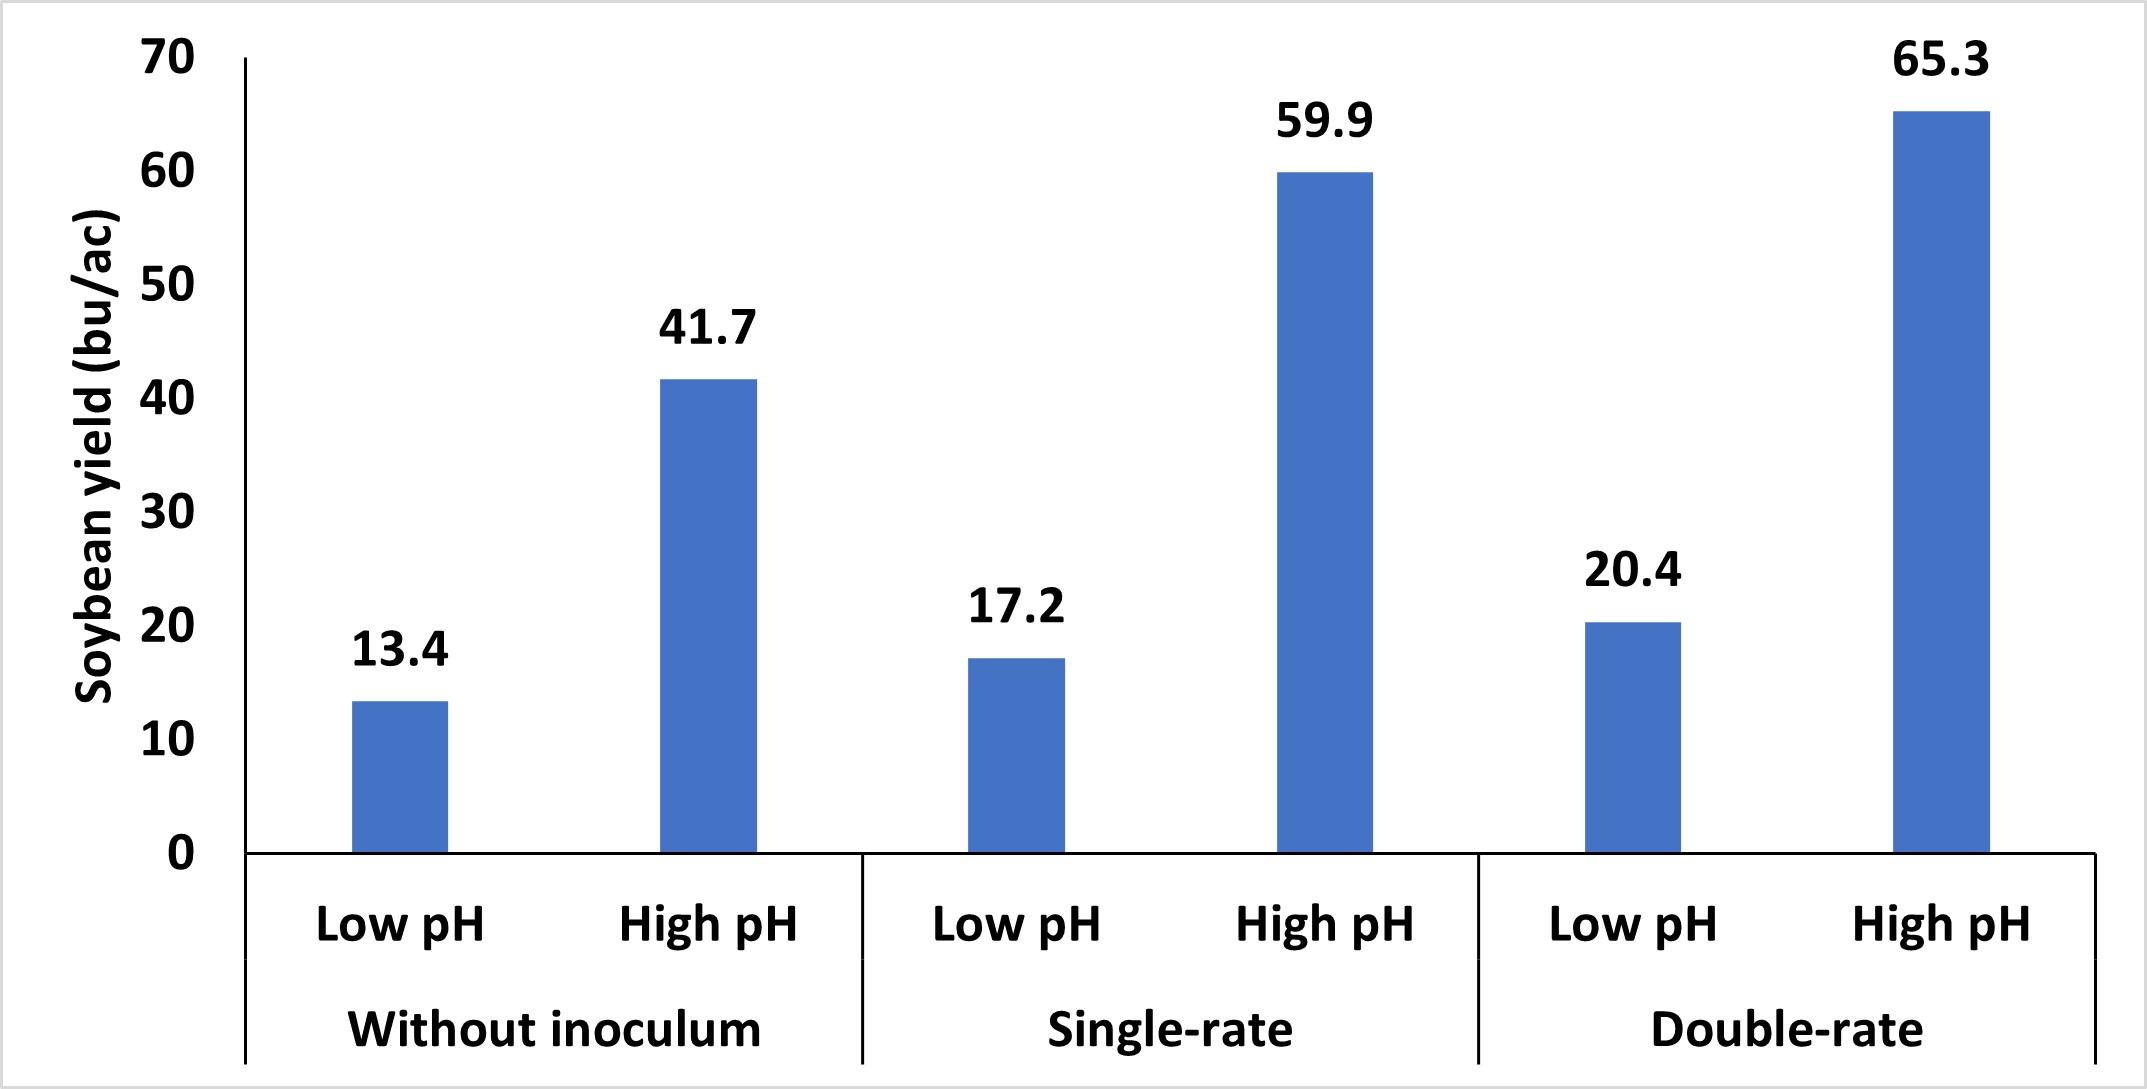
Other soil conditions, such as excessively dry or wet soils, high or low pH, and residual nutrients, can also impact the persistence of these microorganisms. Of these, soil pH has the biggest impact on the survival of these bacteria. High pH is less of a concern to Oklahoma production systems; however, soil with lower pH should be remediated. Like many bacterial systems, these bacteria optimally function at a pH range that closely resembles the ideal pH range for most crops. Lowering the soil pH below a critical threshold reduces the viability of the bacteria, hampers N-fixation processes, and diminishes the capacity of both the bacteria and soybean plants to form and maintain this relationship. While applying inoculum to soybean seeds in these adverse soil conditions can provide some advantages (Figure 3), but it often doesn’t increase yields. Therefore, inoculation with corresponding adjustments to soil pH represents the best approach.
While using inoculum is not a new concept, it is important to highlight the benefits it can provide when utilized correctly. The potential to reduce N input costs is attractive, but the effectiveness depends on proper handling, storage, and soil conditions until it can intercept the host. To maximize benefits, inoculum should be stored in a cool, dark environment and utilized in a timely manner. If there is doubt that there are not enough bacteria, an inoculum should be added. Oklahoma’s climate, particularly hot and dry conditions, can limit bacteria survival, reinforcing the need to treat the inoculum until it is in the ground carefully. Additionally, considering the soil environment is important to sustain the population of bacteria until it can inoculate its host. Emphasis on these small details can have a large impact on the plant’s ability to fix nitrogen and optimize productivity throughout the growing season.
TAKE HOMES
* Soybean requires more lbs of N per bushel than most grain crops.
* Soybeans symbiotic relationship with rhizobia can provide the majority of this nitrogen.
* Soybean rhizobia is not native to Oklahoma soils so should be added to first year soybean fields.
* Inoculum should be treated with care to insure proper nodulation.
* Due to Oklahoma’s climate and existing soil conditions rhizobia may not persist from year to year.
Any questions or comments feel free to contact Dr. Lofton or myself
josh.lofton@okstate.edu
b.arnall@okstate.edu
Appreciation of the Oklahoma Soybean Board for their support of this project.
A comparison of four nitrogen sources in No-till Wheat.
Jolee Derrick, Precision Nutrient Management Masters Student.
Brian Arnall, Precision Nutrient Management Specialist.
Nitrogen (N) fertilizer’s ability to be utilized by a production system is reliant upon the surrounding environment. The state of Oklahoma’s diverse climate presents unique challenges for producers aiming to apply fertilizers effectively and mitigate the adverse effects of unfavorable conditions on nitrogen fertilizers. To lessen the effect that unfavorable environments can have on N fertilizers, chemical additions have been introduced to base fertilizers to give the best possible chance at an impact. With that in mind, a study was conducted to investigate the impact of N sources and application timings on winter wheat grain yield and protein, aiming to identify both the agronomic effects of these sources and how variations in their timing may influence the crop. Included below is a figure of where and when the trials were conducted.

In each of the trials, four N sources (Urea, SuperU, UAN, and UAN + Anvol) were analyzed across a range of timings. The sources were categorized on two criteria: application type, distinguishing between dry and liquid sources, and the presence of additives versus non-additives. The two N sources were Urea and UAN. The other products in this study were SuperU and Anvol. SuperU is a N product that has Dicyandiamide (DCD) and N- (n-butyl) thiophosphoric triamide (NBPT) incorporated into a Urea base. Anvol is an additive product which contains NBPT and Duromide and can be incorporated with dry or liquid N sources.
For additional clarification, N- (n-butyl) thiophosphoric triamide is a urease inhibitor which prevents the conversion of urea to ammonia. Duromide is a molecule which is intended to slow the breakdown of NBPT. DCD is a nitrification inhibitor that slows the conversion of ammonium to nitrate.
Urea is a stable molecule which in the presence of moisture is quickly converted to stable ammonium (NH4), however it can be converted to ammonia gas (NH3) by the enzyme urease beforehand. Additionally, when urea is left on the soil surface and not incorporated via tillage or ½ inch of a precipitation event, the NH4 that was created from urea can be converted back to NH3 and gasses off. So, the use of urease inhibitors is implemented to allow more time for incorporation of the urea into the soil.
Ammonium in the soil is quickly converted to nitrate (NO3) by soil microbes when soil temperature is above 50F°. When N is in the NO3 form it is more susceptible to loss through leaching or denitrification. Therefore, nitrification inhibitors are applied to prevent the conversion of NH4 to NO3.
All treatments were applied at the same rate of 60 lbs of N ac-1, which is well below yield goal rate. A lower N rate was chosen to allow the efficacy of the products to express themselves more clearly, rather than a higher rate that may limit the ability to determine differences between product and rate applied. Furthermore, dry N sources were broadcasted by hand across the plots while liquid sources were applied by backpacking utilizing a handheld boom with streamer nozzles. Application timing dates were analyzed by identifying the growing degree days (GDD) associated with each timing which were correlated with the Feekes physiological growth chart displayed in Figure 3. Over the span of the study, N has been applied over six stages of growth. The range of application dates stems from the fact that it is difficult to get across all the ground exactly when you need to.


Over four years this study was replicated 11 times. Of those 11 site years, three did not show a response to N, so they were removed from further analysis. The graph above shows the average yield of each respective source (across all locations and timings). The data shows there is a statistical difference between SuperU and Urea vs. UAN, but no statistical difference between UAN treated Anvol and any other source. The data indicates that on average, a dry source resulted in a higher yield than when a liquid source was applied. This makes sense considering that in many cases, wheat was planted in heavy residue during cropping seasons that experienced prolonged drought conditions. Therefore, it is thought that a liquid source can get tied up in the residue. This was first reported in a previous blog posting, Its dry and nitrogen cost a lot, what now?, and years later, the same trends in new data indicate the same conclusion.

If we look at all timings and site years averaging together there is no statistical difference between a raw N source and its treated counterpart. This result is not surprising as we would expect that not all environments were conducive to loss pathways that the products prevented. Basically, we would not expect a return on investment in every single site year, and therefore you do not see broad sweeping recommendations. There was a 2-bushel difference between UAN and UAN Anvol. As this was a numerical difference, not a statistical one, I would say that while the yield advantage was not substantial there may be economic environments that would suggest general use.

While the evaluation of the four sources across all timings and locations showed some interesting results, this work was performed to see if there was a timing of application which would have a higher probability of a safened N returning better yields. As you look at the chart above it is good to remember the traditional trend for precipitation in Oklahoma, where we tend to start going dry in November and stay dry through mid-January. Rain fall probability and frequency starts to increase around mid-February, but moisture isn’t consistent until March. This project was performed during some of the dryest winters we have seen in Oklahoma. Also, just a note, since the graph above combines all the sites that have differing application dates the absolute yields are a bit deceiving. For example, the Nov and Feb timings include the locations with our highest yields 80+ bpa per acre, while January and February include our lowest. So, the way this data is represented we should not draw conclusions about best time for N app. For that go read the blogs Impact Nitrogen timing 2021-2022 Version and Is there still time for Nitrogen??


Figure 6a and b. A: The mesonet rainfall totals for Oct -Dec for the Lake Carl Blackwell research station for 2020-2023 A: The mesonet rainfall totals for Jan – April for the Lake Carl Blackwell research station for 2021-2024. The black line on both graphs is the 10 year average.
Now about the source by time. While it’s not always statistical you can see that the dry sources tend to outperform the liquid sources at most timings. Also, while there is never a statistical difference in the raw product and safened, there are trends. SuperU tended to have higher yields than urea when applied in Nov and Dec. It could be hypothesized that the addition of a nitrification inhibitor may have added value, however the UAN + Anvol in November also showed a positive response that would point to the value being derived from urease inhibition. As we move into the period of more consistent rainfall the differences between products start declining, which also makes sense.
The following figures illustrate rainfall events following N application, with the application dates indicated by arrows. Figure 7 corresponds to our trial conducted in 2020-2021, which revealed no statistical differences among the N sources for any timing. However you can see that for the first timing (orange bars) which received 0.7″ of rain two days after application that the yields are uniform than the grey bars with both safened products are numerically greater than the raw product, just makes since as a 0.1″ precipitation event happened 6 days application application and it wasn’t until day 9 that a good incorporating rainfall occurred.

Figure 8 has data the same location one year later, during which we observed statistically significant differences among the dry and liquid N sources. The environmental conditions during 2022 were drier, impacting the incorporation of N applications. The lack incorporating rainfall likely led to tie-up of the UAN on/in the residue, limiting access to plant available N.

It is essential to highlight the environmental conditions encountered throughout this project. From 2020 to 2023, moderate to extreme drought conditions were prevalent. During this period, the influence of a La Niña led to reduced moisture availability. For the first time in an extended period, the 2023-2024 wheat year began under a strong El Niño, which typically results in increased moisture accumulation compared to its La Niña counterpart. Currently, there are indications that a return to a La Niña system may occur by the end of the year, raising the expectation of a potential reversion to drought conditions. Consequently, this research may provide producers with options to consider regarding sources of N application in their production systems.
We plan to update this blog with a deeper analysis of the results seen at each location as soon as possible. But for now, we wanted to share the early look.
At this point the reason for the liquid yield gap is speculation. It could be increased loss via ammonia volatilization or it could be immobilization of the N by microbes. The next step of this process is to understand 1) is the UAN tied up in the residue via immobilization via microbes or is it lost to volatilization. 2) If tied up, what is the time frame between application and immobilization.
Take Home:
- It was observed that during low moisture conditions, dry N sources had significantly better results than liquid counterparts in no-till winter wheat production.
- On average, additive products had no significant impact on grain yield versus base fertilizers, however, when evaluated by location, differences could be found. Responses usually correlated with post-application weather conditions.
- When adequate precipitation was received shortly after application, N sources did not show differences.
Any questions or comments feel free to contact me. b.arnall@okstate.edu

