
Brown Wheat Mite Activity in North Central Oklahoma
Ashleigh Faris, Cropping Systems Entomologist, IPM Coordinator
Department of Entomology & Plant Pathology,
Oklahoma State University
Following a period of dry weather, wheat growers in central Oklahoma are reporting activity of the Brown Wheat Mite (BWM). Unlike many other wheat pests, BWM thrives in drought conditions, and its damage can often be mistaken for moisture stress or nutrient deficiency.
Identification
The Brown Wheat Mite is small—about the size of a needle point—but is generally easier to spot than the Wheat Curl Mite because it is active on the leaf surface.
- Appearance: BWM has a dark red to brownish-black, oval-shaped body (Figure 1).
- Distinguishing Feature: Its front legs are significantly longer than its other three pairs of legs.
- Behavior: They are most active during the day, particularly in the afternoon, and will quickly drop to the ground if the plant is disturbed (Figure 2).
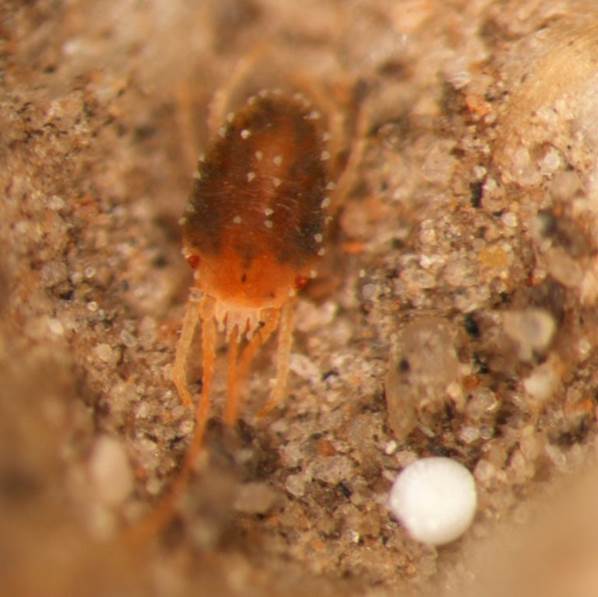
Figure 1. Brown wheat mite (BWM).
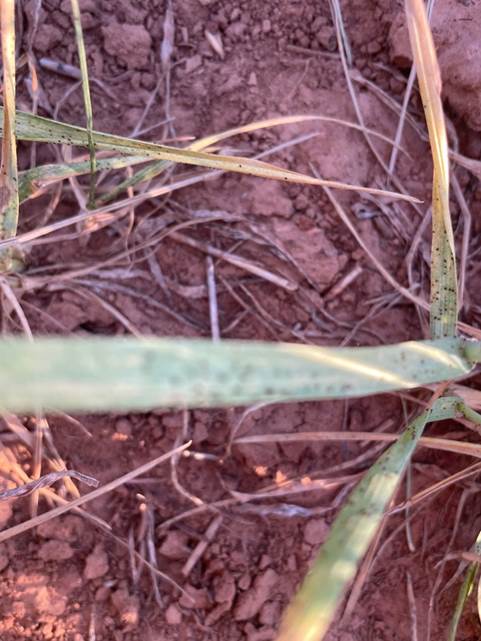
Figure 2. Brown wheat mites (BWM) on wheat. Image courtesy L. Galvin, OSU Extension.
Biology and Life Cycle
BWM populations consist entirely of females that produce offspring without mating (parthenogenesis), allowing for extremely rapid population growth under dry conditions. The BWM has a unique life cycle in that it can lay two types of eggs. Environmental conditions dictate when these two types of eggs are laid:
- Red Eggs: Laid during the growing season and hatch in about a week when conditions are favorable.
- White (Diapause) Eggs: Laid as temperatures rise and the crop matures. They are highly resistant and allow the population to survive the summer heat, hatching only when cooler, wetter weather arrives in the fall.
Damage
BWM damage is caused by the mites piercing plant cells and sucking out the plant nutrients.
- Symptoms: Initial damage appears as “stippling” (fine white or yellow spots) on the leaves. As feeding continues, leaves take on a silvery or bronzed appearance (Figure 3).
- Tipping: Heavy infestations cause the tips of the leaves to turn brown and die.
- Weather Interaction: Damage is most severe when plants are already under drought stress. Because both BWM damage and drought cause yellowing/browning, it is essential to confirm the presence of mites before treating.
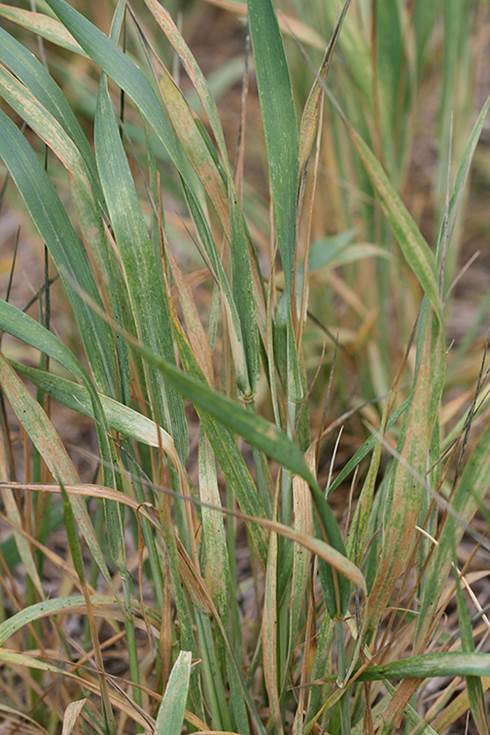
Figure 3. Brown wheat mite (BWM) damage.
Scouting
Because BWM is highly mobile and drops when disturbed, careful scouting is required:
- Timing: Scout during the warmest part of the day when mites are most active on the upper leaves.
- The Paper Test: Gently but quickly shake or tap wheat plants over a white piece of paper or a white clipboard. Look for tiny dark specks moving across the surface.
- Economic Threshold: While thresholds vary based on crop value and moisture stress, research suggests a treatment threshold of 25 to 50 brown wheat mites per leaf in wheat that is 6 inches to 9 inches tall is economically warranted. An alternative estimation is “several hundred” per foot of row. If the wheat is severely stressed, the lower end of that threshold should be used.
Management Recommendations
- The “Rain” Factor: A significant, driving rain is often the most effective control for BWM. Rain can physically knock mites from the plant and promote fungal pathogens that naturally reduce the population.
- Chemical Control: If populations exceed the threshold and no rain is in the forecast, chemical intervention may be necessary. Know the cost of the treatment and value of your wheat so you can determine if an application is a worth return on investment.
- Effective Ingredients: Organophosphates (such as Dimethoate) have historically provided better control than many pyrethroids, as the latter can sometimes result in mite “flaring” or simply fail to provide adequate residual control.
- Coverage: High water volume is critical to ensure the insecticide reaches the mites, especially if they have moved toward the base of the plant.
- Pre-harvest Intervals & Grazing Restrictions: Always read and follow the label guidelines. For more on acaricides that can be applied in wheat see the Oklahoma State University Fact Sheet “Management of Insect and Mite Pests in Small Grains” (CR-7194).
- Cultural Practices: Since BWM thrives in dry, dusty conditions, maintaining good soil moisture and vigorous plant growth can help the crop tolerate feeding. Here’s to hoping for some rain soon in the forecast; we could really use it for lots of reasons in Oklahoma.
Corn Hybrids’ Yield Response to Limited Well Capacities in the Central High Plains
Macie McPeak: M.S in Irrigation and Water Management
Sumit Sharma : Extension Specialist for High Plains Irrigation and Water Management
Background
The Central High Plains, which include the Oklahoma Panhandle, Southwest Kansas, Southeast Colorado, and Northern Texas Panhandle, is a heavily farmed semi-arid region that depends on the Ogallala Aquifer for irrigation to ensure stable crop yields. However, the continuous decline of the Ogallala Aquifer has resulted in increased need for irrigation strategies that conserve water while maintaining crop profitability. Corn remains the most water consuming crop with highest productivity per unit of irrigation applied, and strong economic returns in the Central High Plains region. However, corn is also the most sensitive to water stress among all the existing cropping systems (including sorghum, cotton, and sunflower, soybeans and wheat). Declining water table has reduced the well capacities in many areas in the region, which cannot meet crop water demand, making it a growing challenge for corn production. Therefore, there is a need for research in irrigation strategies and agronomic choices such as drought tolerant hybrids, seeding rate, planting date, and hybrid maturity for sustainable and profitable corn production with reduced well capacities in the region. This blog discusses the yield response of different corn hybrids to limited well capacities in the Oklahoma Panhandle area of the Central High Plains.
Limited well capacities only meet partial crop water demand, which in general leads to yield declines especially in high water demanding crops such as corn. Several previous studies suggest that crop productivity does not significantly decrease as long as irrigation is maintained at approximately 75–80% of full evapotranspiration (ET) replacement (Su et al., 2022; Klocke et al., 2007; Zhao et al., 2019). However, when irrigation levels are more restricted, such as under reduced well capacities, there can be substantial yield losses and diminished economic returns. The magnitude of yield reduction varies with region, hybrids, and growth stage at which water stress occurred. For example, in the Central High Plains the corn ET demand is highest in Texas Panhandle and decreases as we move north towards Nebraska. Zhao et al. (2019) found that applying 75% ET in the Texas Panhandle produced corn yields equivalent to full irrigation, whereas reducing irrigation to 50% caused significant yield reductions. Similarly, Klocke et al. (2007) reported that limited irrigation at roughly 50% of full ET replacement in Nebraska achieved 80–90% of fully irrigated yields across multiple crop rotations. Therefore, the irrigation strategies which work in one region may not work the same way in other regions with different crop water demand and must be tested for the region-specific climatic conditions.
The current study was conducted in 2025 at the Oklahoma Panhandle Research and Extension Center in Goodwell, OK. Four Pioneer brand corn hybrids including P13777 (113 day maturity), P10625 (110 day maturity), P05810 (105 day maturity), and P14346 (114 days maturity) were planted at 22,000 and 28,000 seeds per acre. The hybrids were irrigated with a center pivot fitted with variable rate irrigation system at 200, 300, 400, and 500 GPM well capacities. The well capacities were simulated by adjusting the frequency of irrigation events.
Results & Discussion
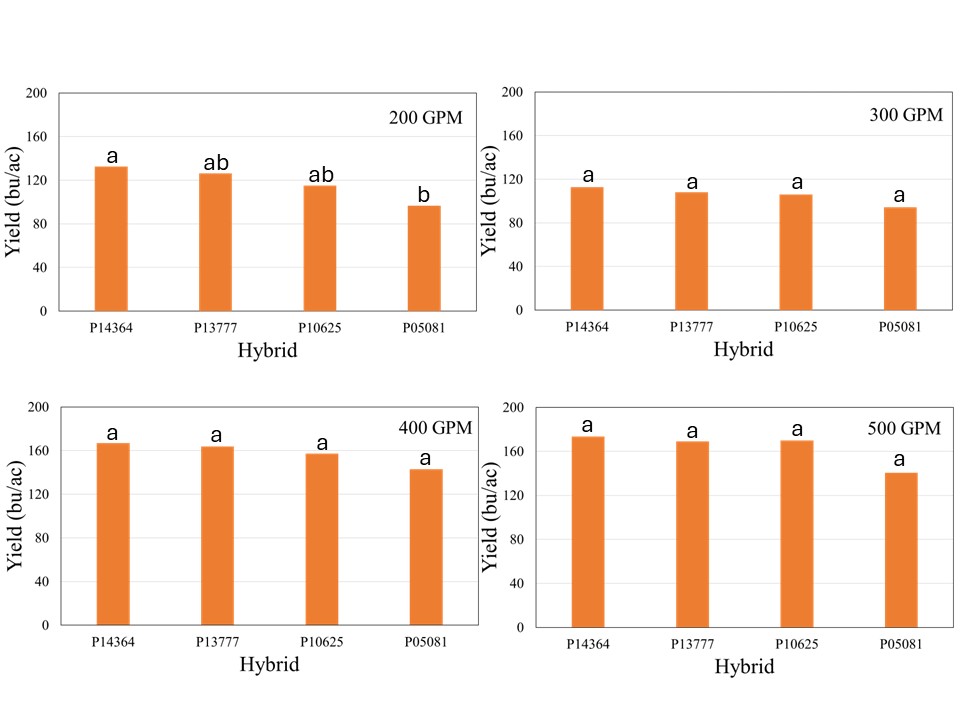
The crop received 12.1 inches of rain from planting until physiological maturity, while total rainfall from April till September was over 15 inches. Manual probing of the field showed near 4 feet soil profile at the time of planting which can hold up to 2 inches of plant available water per foot. The well capacities 200, 300, 400, and 500 GPM treatments received 7.4, 8.9, 10.8, and 12.0 inches of irrigation, respectively. The data showed no significant effect of population on corn yield across hybrids for any well capacity. However, the hybrids showed significant interaction with well capacities, which indicated that hybrid yield response varied at different capacities (Figure 1). In general, the average yield declined from longest maturity to shortest maturity hybrids irrespective of the well capacity, but was only statistically significant at for 200 GPM (Figure1). At this irrigation level, the shortest maturity hybrid P05081 yielded significantly lower yield than longest maturity hybrid P14364, while P13777 and P10625 were not different from either of these two hybrids.
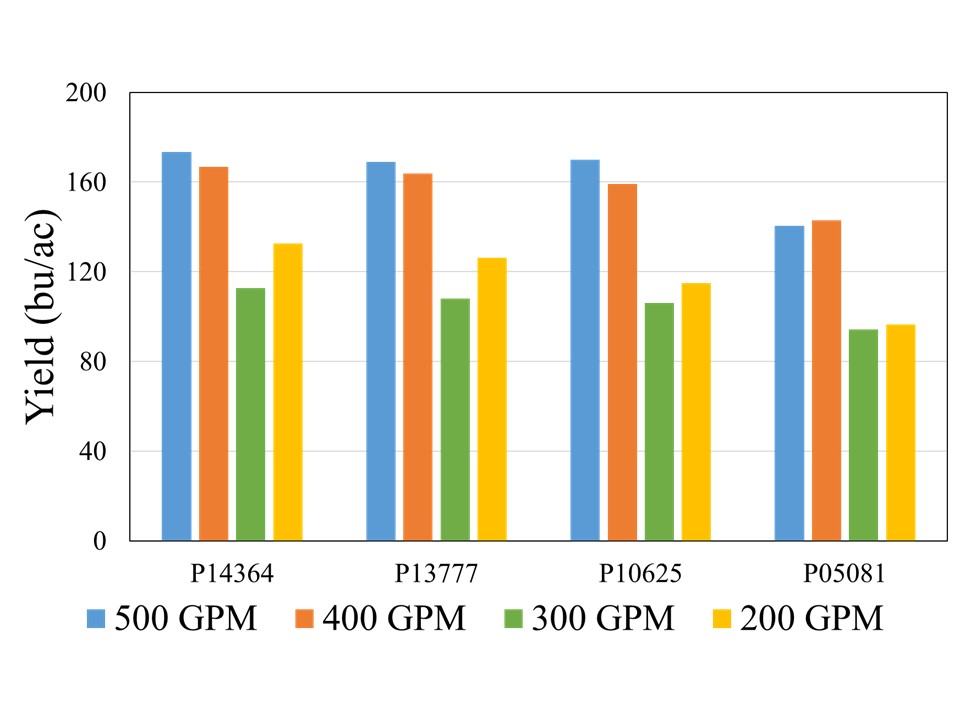
Although there was no statistical difference among the hybrids at 500, 400, and 300 GPM, when compared across well capacities, yield reductions were most pronounced at the 200 and 300 GPM irrigation levels for each individual hybrid, indicating that irrigation capacity was the primary yield limiting factor under restricted water availability (Figure 2). While the exact causes of this abrupt decline are not yet understood, as mentioned in the beginning of this blog, previous literature has suggested that severe yield decline in corn can be expected when irrigation is reduced to 60% ET replacement in the study region. Both 300 and 200 GPM well capacities met 60 and 65% crop ET demand, while 400 and 500 GPM met 71 and75% crop ET demand, respectively. More data will be needed to ascertain these threshold levels of well capacities for corn production in this region.
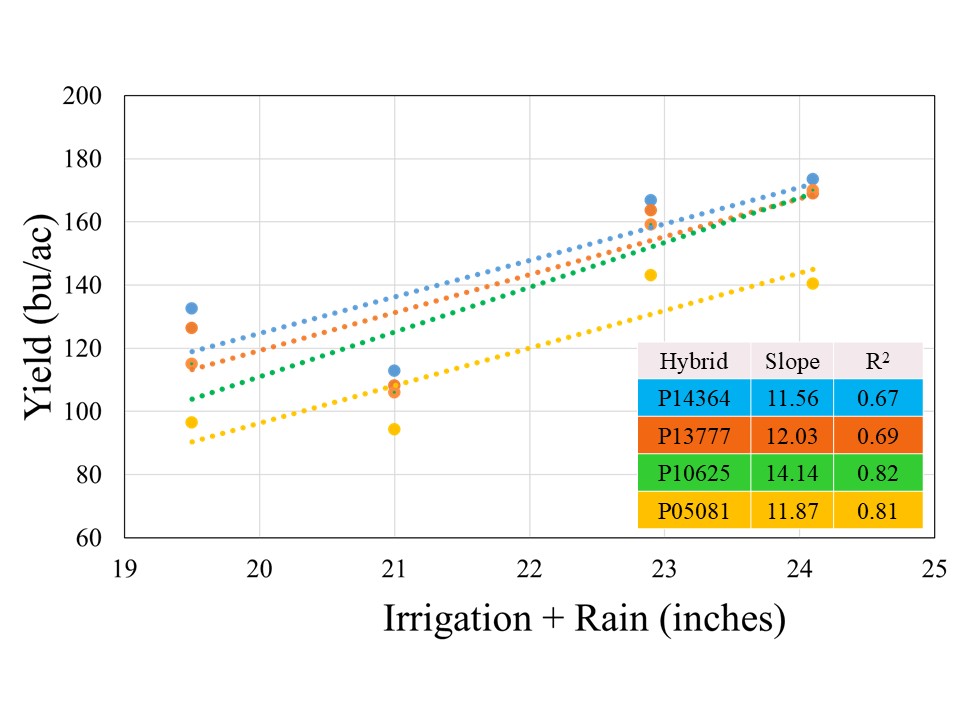
All the hybrids showed a positive yield response to Irrigation+Rain with different yield gains per inch of water applied (Figure 3). Hybrid P10625 registered highest yield gain of 14.1 bushel per inch of water applied, followed by P13777 (12.0 bu), P05081 (11.9 bu), and P14364 (11.6 bu). The stronger coefficient of regression (>80%) for two short maturity varieties indicated that irrigation was stronger yield limitation factor for these hybrids, in comparison to 114 and 113-day maturity hybrids for irrigation explained on 67 and 69% variability, respectively. This suggests that besides irrigation there might be other factors which could contribute to filling the yield gaps for given irrigation levels in longer maturity hybrids.
Planting population did not significantly affect grain yield across irrigation capacities. When pooled across the hybrids for individual planting populations, 28,000 seeding rates resulted in gain of 0.1, 2.6, 5, and 12 bushels per acre for 200, 300, 400, and 500 GPM, respectively. This indicates that higher planting populations at well capacities of 400 or above should be considered, while reducing population at 300 GPM or lower might be more cost-effective option.
Take Home
- Irrigation capacity remains the primary determinant of yield potential under limited well capacities in the Central High Plains.
- Pre-irrigation and recharging the soil profiles will be critical to support crop water demand for limited well capacities.
- Short maturity hybrids appeared to have consistently lower average yield and more vulnerable for yield losses at limited irrigation. However, one must consider that the growing conditions were more conducive for corn production in 2025 which generally favor long maturity hybrids. Therefore, long-term data will be required to assess the performance of short maturity hybrids during inclement growing seasons.
- Even though population didn’t significantly influence the grain yield. The 28,000 seeding rates overall had higher average yield at 400 and 500 GPM. Therefore, producers should consider the higher population at these well capacities or more.
- Overall, irrigation is the most important factor for yields, but there is a need for long-term agronomic data on hybrid maturity and population along with economic analysis to ascertain these findings.
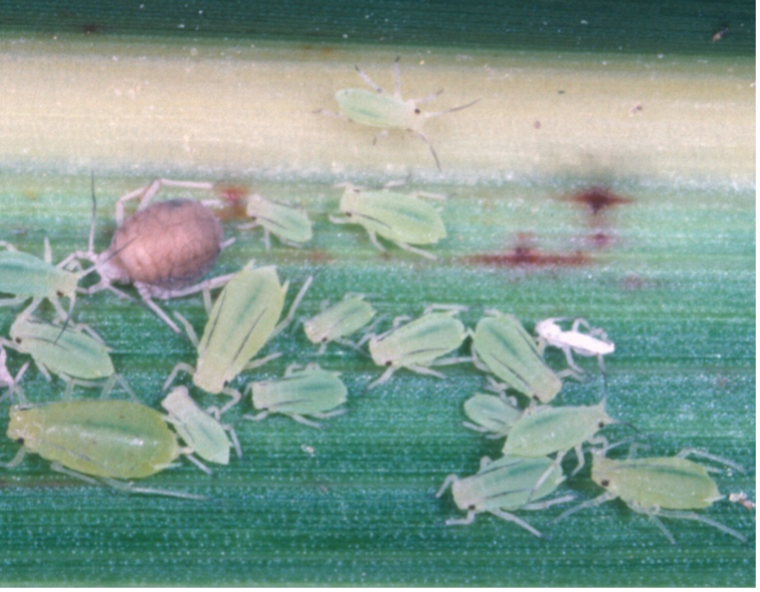
Check Your Wheat: Greenbugs Reported in Central Oklahoma
Ashleigh M. Faris
Cropping Systems Extension Entomologist
Department of Entomology & Plant Pathology
Oklahoma State University
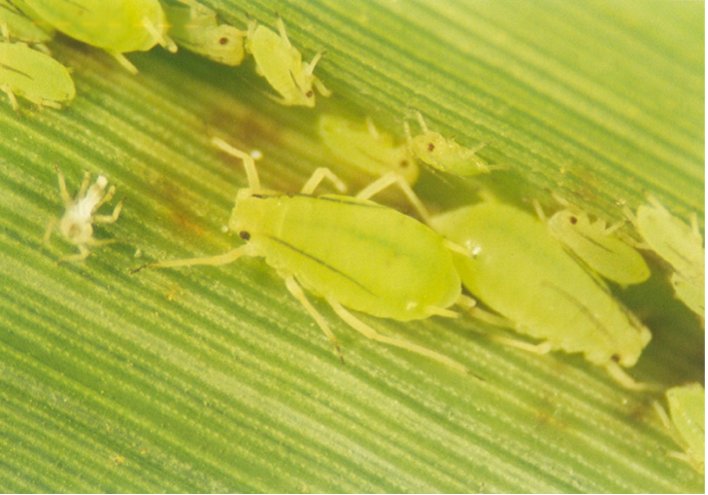
Wheat producers in central Oklahoma are reporting the presence of the greenbug, Schizaphis graminum, in winter wheat fields. Greenbugs are one of the most important insect pests of wheat in the southern Great Plains and can occur from fall through spring. These aphids feed on plant sap and inject toxins into wheat plants, causing characteristic leaf discoloration and plant injury.
Early detection through field scouting is essential to determine whether populations are increasing and if an insecticide treatment is justified.
Greenbug Identification & Biology
Key identifying characteristics of greenbug (Figure 1):
- Small aphids (~1/16 inch long)
- Pale to lime-green body
- Dark green stripe down the middle of the back
- Dark tips on antennae and legs
- Found in colonies on the underside of wheat leaves
Greenbugs reproduce rapidly under favorable conditions (between 55° F and 95° F) and often occur in patches within fields rather than evenly distributed populations. During periods of cool weather, the greenbug may increase to enormous numbers, due to the absence of natural enemies, which develop significantly slower compared to greenbugs at such temperatures. On the other hand, cold weather can also influence aphid populations. However, this latest cold snap is not enough to eliminate greenbugs. It takes average temperatures below 20° F for at least a week to kill a substantial number of greenbugs in wheat.
Greenbug Damage in Wheat
Greenbugs damage wheat in two ways, through direct feeding and injection of toxic saliva. Greenbugs may also transmit barley yellow dwarf virus (BYDV), which can further reduce yield potential.
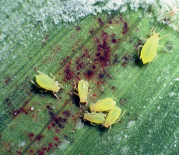
Typical early symptoms include small, reddish or copper spots on leaves (Figure 2) and yellowing around feeding sites. Advanced infestations will result in leaves turning yellow or orange, dead leaf tissue, stunted plants, and expanding patches of dead wheat. Heavy infestations may kill seedlings and reduce tillering, particularly during drought stress.
How to Scout for Greenbugs
The Glance-N-Go™ sampling system developed by Oklahoma State University can help determine whether aphid populations exceed economic thresholds. Download the Greenbug Glance N’ Go Sampler app for your smartphone. You will then input the control cost ($/Acre), crop value ($/Acre), and the Spring sampling window. Use a zig-zag or W-pattern (Figure 3) to scout your field, checking undersides of leaves at three tillers per stop for greenbugs and brown mummies. Use the app to record the numbers of these insects and sample until the app tells you to stop sampling or tells you treat. As temperatures warm, continue to scout regularly as greenbug populations may build.

Scouting recommendations without the Greenbug Glance N’ Go Sampler app:
- Walk a W or zigzag pattern across the field.
- Examine 10–20 plants at each stop.
- Check:
- Underside of leaves
- Leaf midrib
- Base of tillers
- Record:
- Aphids per tiller
- Presence of aphid mummies (Figure 4)
- Beneficial insects
Beneficial Insects
Natural enemies frequently control aphid populations. While scouting for greenbug you should also look for lady beetles, lacewing larvae, hoverfly larvae, and parasitized aphids (“mummies”) (Figure 4). If beneficial insects are abundant, aphid populations may decline without insecticide treatment. Where there are one to two lady beetles (adults and larvae) per foot of row, or 15 to 20 percent of the greenbugs have been parasitized, control measures could be delayed until it is determined whether the greenbug population is continuing to increase.
Based on current wheat scouting, it appears that parasitoid numbers are low this 2026 season so continuing to scout for greenbug will be critical in responding to populations that go unchecked by beneficials.
Economic Threshold Guidelines
The simplest way to determine if action needs to be taken against greenbugs is to utilize the Glance-N-Go™ sampling system developed by Oklahoma State University. Approximate guidelines historically used in Oklahoma wheat can be found in Table 1 below.
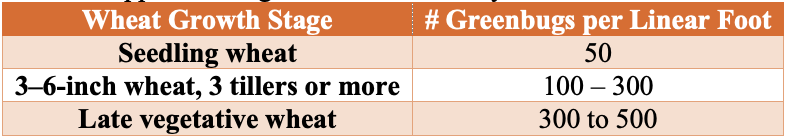
Thresholds are influenced by:
- Wheat growth stage
- Crop value
- Cost of treatment
- Presence of beneficial insects
Insecticides Labeled for Greenbugs in Wheat
Aphid feeding and insecticide performance are strongly influenced by temperature. Greenbugs tend to move higher on wheat plants during warm conditions but may move lower on the plant or below ground during cold weather, reducing exposure to insecticides. As a result, damaging populations are most often observed in late winter and early spring. Insecticides generally perform best when temperatures are above 50°F, and control may occur more slowly in cooler conditions (e.g., control at 45° F may take roughly twice as long as at 70° F). If applications must be made under cooler temperatures, use the highest labeled rate. Wheat grown under irrigation can typically tolerate higher greenbug populations than dryland wheat.
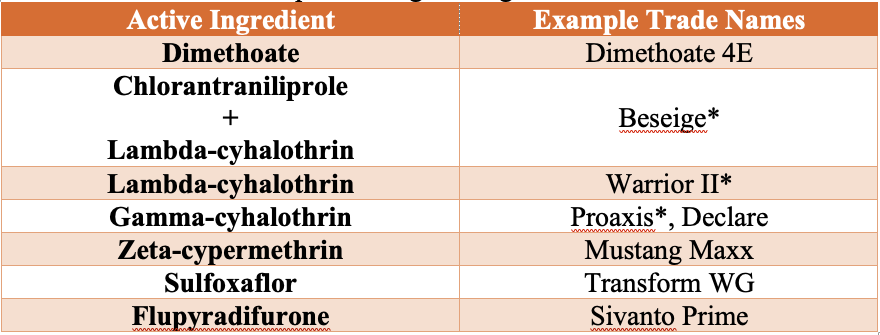
Always follow pesticide label directions, application sites, and rates. Be sure to read and follow the label for preharvest intervals (PHI) and restricted-entry intervals (REI). Use a minimum of 10 GPA by ground and 3 GPA by air (if labelled for aerial application) to ensure adequate coverage.
For assistance with aphid identification or treatment decisions, see OSU Fact Sheet EPP-7099 Small Grain Aphids in Oklahoma and Their Management, or contact your local OSU Extension office.
Thoughts from an Agronomist- 1 Management of the Primordia
Josh Lofton, Cropping Systems Specialist
Many crop management recommendations emphasize actions that must be taken well before a crop reaches what we often call “critical growth stages.” Management this early can seem counterintuitive when the crop still looks small, healthy, or unchanged aboveground. However, much of a crop’s yield potential is determined early in the season at a level we cannot see in the field. Long before flowers, tassels, or heads (or any reproductive structure) appear, the plant is already making developmental decisions that shape its final yield potential. Understanding this “behind the scenes” process helps explain why timely, early-season management is often more effective than trying to correct problems later.
At the center of this process is the shoot apical meristem, commonly referred to as the growing point. This tissue produces leaf and reproductive primordia, which are the earliest developmental stages of future everything in the plant. These primordia form well before the corresponding plant parts are visible. Once these structures initiate—or if they fail to begin due to stress—the outcome is permanent. The plant cannot later in the season go back and recreate leaf number, leaf size, or reproductive capacity. As a result, early environmental conditions and management decisions play a disproportionate role in determining yield potential.
Corn is a good example of how early development influences final yield. By the time corn reaches the V4 growth stage, the plant only has four visible leaves with collars, yet internally it is far more advanced. Most of the total leaf primordia that will eventually form the full canopy have already begun, and the potential size of the ear is starting to be established. During this stage, the growing point is still below the soil surface and somewhat protected from some stressors but highly susceptible to others. Nitrogen deficiency, cold temperatures, moisture stress, compaction, or herbicide injury at or before V4 can reduce leaf number and limit leaf expansion. Even if growing conditions improve later, the plant cannot replace leaf primordia that were never formed, which reduces its ability to intercept sunlight and support high yields.
As corn approaches tasseling (VT), the crop enters a stage that is visually and physiologically important. Pollination, fertilization, and early kernel development occur at this time, and stress can have a critical impact on kernel set. However, by VT, the plant has already completed leaf formation, and much of the ear size potential has already been determined several growth stages earlier. Management at VT is therefore focused on protecting yield rather than creating it. Late-season nutrient applications may improve plant appearance or maintain green leaf area, but they cannot increase leaf number or rebuild ear potential lost due to early-season stress. This distinction helps explain why some late inputs show limited yield response even when the crop looks responsive.
Grain sorghum provides another clear example of why early management is emphasized. Although sorghum often grows slowly early in the season and may appear unimportant during the first few weeks after emergence, the first 30 days are among the most critical periods in its development. During this time, the growing point is actively producing leaf primordia and transitioning from vegetative growth toward reproductive development. Head size potential is primarily established during this early window, and the plant’s capacity to support tillers is influenced by early nutrient availability and moisture conditions. Stress from nitrogen deficiency, drought, weed competition, or restricted rooting during the first 30 days can reduce head size and kernel number long before visible symptoms appear.
Once sorghum reaches later vegetative and reproductive stages, much like corn at VT, management shifts from building yield potential to protecting what has already been determined. Improving conditions later in the season can help maintain plant health and grain fill, but it cannot fully compensate for early limitations imposed at the primordial level. This is why early fertility placement, timely weed control, and moisture conservation are consistently emphasized in sorghum production systems.
Across crops, a typical pattern emerges: the growth stages we observe in the field often reflect decisions the plant made weeks earlier. When agronomists stress early-season management, they are responding to plant biology rather than simply following tradition. By the time visible “critical stages” arrive, the plant has already established many of the components that define yield potential.
The key takeaway is that effective crop management must be proactive rather than reactive. Early-season decisions support the crop while it is still determining how many leaves it can produce, how large its reproductive structures can become, and how much yield it can ultimately support. Waiting until stress becomes visible often means responding after the plant has already adjusted its potential downward. Recognizing what is happening at the primordial level helps explain why management ahead of critical stages consistently delivers the greatest return, even when the crop appears small and unaffected aboveground.
For questions or comments reach out to Dr. Josh Lofton
josh.lofton@okstate.edu
One Well-Timed Shot: Rethinking Split Nitrogen Applications in Wheat production
Brian Arnall, Precision Nutrient Management Specialist
Samson Abiola, PNM Ph.D. Student.
Nitrogen is the most yield limiting nutrient in wheat production, but it’s also the most unpredictable. Apply it too early, and you risk losing it to leaching or volatilization before your crop can use it. Apply it too late, and your wheat has already determined its yield potential; you’re just feeding protein at that point. For decades, the conventional wisdom has been to split nitrogen applications: put some down early to get the crop going, then come back later to apply again. But does splitting actually work? And more importantly, when is the optimal window to apply nitrogen if you want to maximize both yield and protein quality? We spent three years across different Oklahoma locations testing every timing scenario to answer these questions.
How We Tested Every Nitrogen Timing Scenario in Oklahoma Wheat
Between 2018 to 2021, we conducted field trials at three Oklahoma locations, including Perkins, Lake Carl Blackwell, and Chickasha, representing different soil types and growing conditions across the state. We tested three nitrogen rates: 0, 90, and 180 lbs N/ac, applied as urea at five critical growth stages based on growing degree days (GDD). These timings were 0 GDD (preplant, before green-up), 30 GDD (early tillering), 60 GDD (active tillering), 90 GDD (late tillering, approximately Feekes 5-6), and 120 GDD (stem elongation, approaching jointing). We also compared single applications at each timing against split applications, where half the nitrogen (45 lbs N ac-1) went down preplant, and the other half was applied in-season (45 lbs N ac-1).
The Sweet Spot: Yield and Protein at the 90 lbs N/ac Rate
Across all site-years, at the 90 lbs N/ac rate, timing had a significant impact on both yield and protein. The highest yields came from the 30 and 90 GDD timings, producing 62 to 66 bu/ac, with 60 GDD reaching the peak (Figure 1). Protein at these early timings stayed relatively modest at 13%. The 90 GDD timing delivered 62 bu/ac with 14% protein matching the yield of the 30 GDD application but pushing protein a percentage higher (Figure 2). The real problem appeared at 120 GDD. Delaying application until stem elongation dropped yields to just 49 bu/ac, even though protein climbed to 15%. That’s a 13 bushel penalty compared to the 90 GDD timing. At current wheat prices per bushel, that late application may cost farmers over $100 per acre in lost revenue. By 120 GDD, the crop has already determined its yield potential tillers are set, head numbers are locked in and nitrogen applied at this stage can only be directed toward protein synthesis, not building more yield components.
More Nitrogen Does not lead to high yield
Doubling the nitrogen rate to 180 lbs N/ac revealed something critical, more nitrogen doesn’t mean more yield. The yield pattern remained nearly identical to the 90 lbs N/ac rate. The 60 GDD timing produced the highest yield at 68 bu/ac, followed closely by 30 GDD at 67 bu/ac. The 90 GDD timing yielded 62 bu/ac, and the 120 GDD timing again crashed to 51 bu/ac. The only difference between the two rates was protein concentration (Figure 2). At 180 lbs N/ac, protein levels increased across all timings: 13% at preplant, 15% at both 30 and 60 GDD, 15-16% at 90 GDD, and 16% at 120 GDD. This confirms a fundamental principle: once farmers supply enough nitrogen to maximize yield potential, which occurred at 90 lbs N/ac in these trials, additional nitrogen only increases grain protein. It does not build more bushels. Unless farmers are receiving premium payments for high-protein wheat, that extra 90 lbs of nitrogen represents a cost with no yield return.

Should farmers split their nitrogen application?
Now that timing has been established as critical, the next question becomes: should farmers split their nitrogen applications, or is a single application sufficient? The conventional recommendation has been to split nitrogen apply part preplant to support early growth and tillering, then return with a second application later in the season to boost protein and finish the crop. But does the data support this practice? We compared three strategies at each timing: applying all nitrogen preplant, applying all nitrogen in-season at the target timing, or splitting nitrogen equally between preplant and in-season timing. The goal was to determine whether the extra trip across the field will deliver better results.
Our findings revealed that splitting provided no consistent advantage. At 30 GDD, all three strategies preplant, in-season, and split performed identically, producing 62-65 bu/ac with 12-13% protein (Figure 3 and 4). No statistical differences existed among them. At 60 GDD, similar pattern was held. Yields ranged from 61 to 66 bu/ac and protein stayed at 12-13% regardless of whether farmers applied all nitrogen preplant, all at 60 GDD, or split between the two. At 90 GDD, the single in-season application actually outperformed the split. While yields remained similar across all three methods (61-64 bu/ac), the in-season application delivered significantly higher protein at 13.7% compared to 12.4% for preplant and 12.5% for split applications. This suggests that concentrating nitrogen at 90 GDD, rather than diluting it across two applications, allows more efficient incorporation into grain protein. The only timing where splits appeared beneficial was 120 GDD, where the split application yielded 59 bu/ac compared to 51 bu/ac for the single late application. But this is not a win for splitting, it simply demonstrates that applying all nitrogen at 120 GDD is too late and putting half down earlier salvages some of the yield loss. Across all timings tested, splitting nitrogen into two applications offered no agronomic advantage over a single well-timed application, meaning farmers are making an extra pass for no gain in yield or protein.


Practical Recommendations for Nitrogen Management
Based on three years of field data, farmers should target the 90 GDD timing (late tillering, Feekes 5-6) for their main nitrogen application to achieve the best balance between yield and protein. This window typically falls in late February to early March in Oklahoma, though farmers should monitor crop development rather than relying solely on the calendar apply when wheat shows multiple tillers, good green color, and vigorous growth. A rate of 90 lbs N/ac maximized yield in these trials; higher rates only increased protein without adding bushels, so farmers should only exceed this rate if receiving premium payments for high-protein wheat. Splitting nitrogen applications provided no advantage at any timing, meaning a single well-timed application at 90 GDD is sufficient for most Oklahoma wheat production systems. The exception would be sandy soils with high leaching potential, where splitting may reduce nitrogen loss. Farmers should avoid delaying applications until 120 GDD or later, as this timing consistently resulted in 15-25 bushel per acre yield losses even though protein increased. For farmers specifically targeting premium protein markets, a two-step strategy works best: apply 90 lbs N/ac at 90 GDD to establish yield potential and baseline protein, then follow with a foliar application of 20-30 lbs N/ac at flowering to push protein above 14% without sacrificing yield. Finally, weather conditions matter hot, dry forecasts increase volatilization risk and reduce uptake efficiency, so farmers should consider moving applications earlier if low humidity conditions are expected.
Split Application Caveat * Note from Arnall.
The caveat to the it only takes one pass, is high yielding >85+ bpa, environments. In these situation I still have not found any value for preplant nitrogen application. I have seen however a split spring application is valuable. Basically putting on 30-50 lbs at green-up, with the rest following at jointing (hollowstem). The method tends to reduce lodging in the high yielding environments.
This work was published in Front Plant Sci. 2025 Nov 6;16:1698494. doi: 10.3389/fpls.2025.1698494
Split nitrogen applications provide no benefit over a single well timed application in rainfed winter wheat
Another reason to N-Rich Strip.
Yet just one more data set showing the value of in-season nitrogen and why the N-Rich Strip concept works so well.
Questions or comments please feel free to reach out.
Brian Arnall b.arnall@okstate.edu
Acknowledgements:
Oklahoma Wheat Commission and Oklahoma Fertilizer Checkoff for Funding.
Using soil moisture trend values from moisture sensors for irrigation decisions
Sumit Sharma, Extension Specialist for High Plains Irrigation and Water Management
Kevin Wagner, Director, Oklahoma Water Resources Center
Sumon Datta, Irrigation Engineer, BAE.
Sensor based and data driven irrigation scheduling has gained interest in irrigated agriculture around the world, especially in semi-arid areas because of the easy availability of commercial irrigation scheduler technology such as soil moisture sensors and crop models. Moisture sensing has particularly gained interest among the agriculture community due to ease of availability of the sensors to the producers, affordable costs, and easy to use graphical user interface. Economic potential of sensors in saving irrigation costs, data interpretation training through extension education programs, and policy initiatives have also helped with adoption of the sensors, especially in the United States. However, sensor adoption and efficient use can still be challenging due to poor data interpretation, steep learning curves, overly high expectations and subscription costs. This blog briefly discusses scenarios where sensors can be helpful in irrigated agriculture. For moisture sensor types, functioning and installation, readers are referred to BAE-1543 OSU extension factsheet.

Irrigation Scheduling
Irrigation scheduling with soil moisture sensors follows traditional principles of field capacity (FC), plant available water, maximum allowable depletion (MAD), and permanent wilting point (PWP). Figure 1 shows the transition of soil moisture level from field capacity to MAD, and to permanent wilting point in a typical soil. The maximum amount of water that a soil can hold after draining the excess moisture is called field capacity. At this point, all the water in soil is available to the plants. As the moisture content in the soil declines, it becomes more difficult for the plants to extract moisture from the soil. The soil moisture level below which the available moisture in soil cannot meet the plant’s water requirement is called the MAD. The water stress that occurs once moisture level goes below this moisture level can cause yield reductions in crops. Therefore, irrigation should be triggered as soon as the soil moisture level approaches this point (MAD) to avoid any yield losses (for detailed information on MAD, its value for different soils and crops, and irrigation scheduling, readers are referred to BAE-1537). Modern soil moisture sensors can come self-calibrated and are equipped with water stress threshold levels for different crops to avoid water stress or overwatering (Figure 2). These decisions are useful in furrow and drip irrigation systems where irrigation triggers can be synchronized with MAD values.


Figure 2: Screenshots of graphic user interface of three sensors a) GroGuru b) Sentek c) Aquaspy (Top to bottom) with threshold levels for soil moisture conditions. Aquspy and Sentek credits: Sumit Sharma. GroGuru image credits: groguru.com
Soil Moisture Trends and Irrigation Depths
Soil moisture sensors can help make data-informed decisions about scheduling irrigation. Previous studies have shown that the moisture values may vary from one sensor to the other and may not represent the exact moisture levels in soil. However, all soil moisture sensors exhibit trends in recharge and decline in soil moisture conditions. These real time soil moisture trends can be used to make informed decisions to adjust irrigation and improve water use efficiency. In high ET demand environments of Oklahoma, pivots are usually not turned off during the peak growing season, yet sensors can help in making decisions for early as well as late growing periods.
One of the easiest adjustments that could be made using soil moisture sensor data is the adjustment of irrigation depth. In an ideal situation, every irrigation event should recharge the soil profile to field capacity; however, this is often limited by the crops’ water demand and the well/irrigation capacity to replenish soil moisture levels. Each peak in soil moisture detected by sensors shows irrigation or rain, which ideally should be bringing moisture to same level after irrigation. However, reduction in moisture peaks in the soil moisture profile with every irrigation often indicates greater crop water demand than what is replenished with irrigation. In such scenarios, as allowed by capacity and infiltration rates, the irrigation depth can be increased. These trend values are particularly useful for center pivot irrigation systems, where triggering irrigation based on MAD might lag due to time and space bound rotations of the pivots in Oklahoma weather conditions.

Figure 3: A screenshot from Aquaspy agspy moisture sensor showing moisture at 8” (blue) and 28” (red) with each irrigation event. Data and image credit: Sumit Sharma
Last irrigation can be a tricky decision to end the cropping season. For summer crops, this is the time when crop ET demand is declining due to decline in green biomass and cooler weather patterns. Similar moisture trends can be used to make decisions for the last irrigation events, which can be skipped or reduced if the profile moisture is good, or can be provided if profile moisture is low. This is important because in an ideal situation, one would want to end the season with a relatively drier profile to capture and store off-season rains. Additionally, saving water on last irrigation can save operational cost and potentially cover the cost of moisture sensor subscriptions.
These decisions can be illustrated with Figure 3, which shows the trends of declining and recharging in a soil profile under corn at 8- and 28-inch depth. This field was irrigated with a center pivot irrigation system which was putting 1-1.25 inches of water with each irrigation event; however, the peak water recharge rate at both depths was declining with each irrigation. This coincided with peak growth period indicating rising ET demand of the crop than what was replenished by the irrigation. Later, two rain events, in addition to irrigation, replenished soil moisture in both layers. As the pivot was already running at a slow speed, slowing it further was not an option without triggering runoff for this soil type and this well capacity. Further in the season, when the crop started to senesce and ET demand declined, each irrigation event added to the moisture level of the soil. This allowed the producer to shut down the pivot between 70% starch line and physiological maturity for the crop to sustain at a relatively wet soil profile and leave the soil in relatively drier profile for the off-season.
In high ET demanding conditions of Western Oklahoma, crops often rely on moisture stored in deep soil profiles during the peak ET period when well capacities can’t keep up with crop water demand. In the high ET demanding environments of Oklahoma, irrigated agriculture depends heavily on profile moisture storage. Declining soil profile moisture is common during peak ET periods in high water demanding crops such as corn. These observations are useful if one starts the season with considerable moisture in the soil profile, however such trends may be absent if the season is started with a dry soil profile. Dry soil profiles can be recharged early in the season with pre-irrigation or deeper early irrigations (if allowed by the infiltration rate of the soil), when crop ET demand is low, to build the soil moisture profile. As such, sensors can be used in reducing the irrigation depth or skipping irrigation in early cropping systems if one starts with a full profile. This usually allows root growth through the profile to chase the moisture in deeper layers. It should be noted that the roots will grow and chase moisture only if there is a wet profile, and not through a dry soil profile.
Sensor installation and calibration are important for efficient use of these devices in irrigation decision making. Poor installation can often lead to poor data and wrong decision making. Although modern sensors are self/factory calibrated, some do provide the option to adjust threshold levels manually based on field observations. Early installation of sensors can be useful in making informed decisions as soon as the season starts. For a more detailed analysis of proper sensor installation, refer to BAE-1543. Producers are encouraged to integrate other means of irrigation planning with soil moisture sensing, such as a push rob to probe the soil profile or OSU Mesonet’s irrigation planner to further validate the sensor data. Further, the cliente should consider their irrigation capacities before investing in soil moisture sensors, as sensors may always show a deficit in low well capacities which cannot meet crop’s water demand.
References:
Taghvaeian, S., D. Porter, J. Aguilar. 20221. Soil moisture-sensing systems for improving irrigation scheduling. BAE-1543. Oklahoma State Cooperative Extension. Available at: https://extension.okstate.edu/fact-sheets/soil-moisture-sensing-systems-for-improving-irrigation-scheduling.html
Datta, S., S. Taghvaeian, J. Stivers. Understanding soil water content and thresholds for irrigation management. BAE-1537. Oklahoma State Cooperative Extension. Available at: https://extension.okstate.edu/fact-sheets/understanding-soil-water-content-and-thresholds-for-irrigation-management.html
For more information please contact Sumit Sharma sumit.sharma@okstate.edu
Cotton disease update: Reniform nematode – 08/25/2025
Maíra Duffeck, OSU Row Crops Extension Pathologist, Department of Entomology and Plant Pathology Oklahoma State University
Maxwell Smith, OSU IPM for Cotton Extension Specialist, Department of Entomology and Plant Pathology, Oklahoma State University
Jenny Dudak, OSU Extension Cotton Specialist, Department of Plant & Soil Sciences Oklahoma State University
Reniform nematode continues to be detected in cotton fields across Oklahoma. During the 2023 and 2024 growing seasons, a survey was conducted in 17 commercial cotton fields located in Tillman, Jackson, Grady, and Caddo counties to assess the presence of parasitic nematodes affecting cotton production. We collected soil samples in areas of the fields showing irregular and stunted cotton plants.
Out of the 17 soil samples collected, reniform nematode was detected in 5 fields, marking the first confirmed report of this pest in Oklahoma cotton. Notably, in one of the positive fields, the reniform nematode population reached 1,569 nematodes per 100 cm³ of soil; more than double the economic threshold of 700 nematodes per 100 cm³. In 2025, a soil sample from a cotton field in Jackson County already tested positive for the reniform nematode.
The reniform nematode, caused by Rotylenchulus reniformis, is one of the most important yield-limiting pathogens of cotton production in the southern U.S. In addition to cotton, the reniform nematode can reproduce on other field crops such as soybean, with yield loss estimates being greater in cotton than soybean. The reniform nematode is easy to introduce into new fields because of its unique ability to survive in a dehydrated state in dry soils. Therefore, it can be transported long distances on field equipment.
We suspect that parasitic nematodes, such as root-knot and reniform nematodes, are already present in many Oklahoma cotton fields, but the damage they cause often goes unnoticed. This is especially important for the reniform nematode, as yield losses can occur without obvious aboveground symptoms. For this reason, monitoring the distribution of this nematode across the cotton fields in Oklahoma is crucial to raise awareness of this emerging issue and to guide future management decisions.
Symptoms and Signs
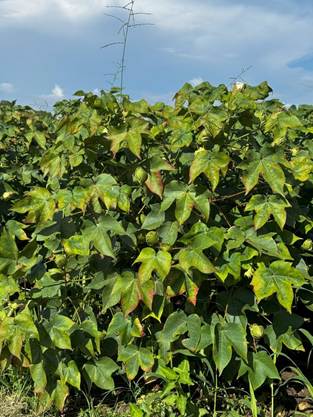
The expression of symptoms depends on several factors, including the susceptibility of the cotton hybrid, nematode population levels, soil type, and for how long that field has been infested. Affected plants may show reduced growth, delayed flowering, fewer fruits, and smaller fruit size, which together contribute to yield losses in lint or pods. Unlike the southern root-knot nematode (Meloidogyne incognita), the reniform nematode does not induce gall formation on roots, making field diagnosis based solely on visible symptoms challenging. For this reason, soil testing through a nematode assay is often necessary for proper identification. In newly infested fields, stunted plants are typically the most noticeable sign (Figure 1).
Plan of Action
To address this issue, a statewide nematode survey is underway to document the presence, abundance, and geographic distribution of parasitic nematodes in Oklahoma cotton fields. The information generated from this survey will provide a foundation for developing and implementing economically viable strategies to manage this issue and protect cotton production in the state.
How to participate?
Oklahoma cotton growers interested in having their fields tested for parasitic nematodes have several ways to participate in this study:
- Schedule a field visit: Contact Dr. Maira Duffeck to arrange soil sample collection. She can be reached by phone at 347-205-2180 or by email at mairodr@okstate.edu.
- Drop off samples at the Peanut & Cotton Field Day: September 18, 2025, from 5:00–8:00 p.m. at the Caddo Research Station (28054 County Street 2540, Ft. Cobb)
- Drop off samples at the Cotton Field Day: September 25, 2025, from 8:30 a.m. to 1:00 p.m. at the Southwest Research & Extension Center (16721 US Hwy 283, Altus)
More information about dropping off samples on OSU field days can be found on the flyers shown in Figures 2 and 3. Growers can submit soil samples for analysis at no cost, as expenses are covered through a project funded by the Oklahoma Cotton Council in partnership with Cotton Incorporated.
How to collect soil samples for analysis?
- Soil samples should be collected from the root zone of the plants
- Collect 15–20 soil cores (6–8 inches deep) from across the field
- Growers should focus on areas of the field where plants are showing poor growth and development
- Mix the cores thoroughly, then place the mixed soil into a resealable plastic bag
- We need about 2 pints (1 kg) of soil for analysis
- Keep samples cool — store them in a refrigerator until the field day.
- If you collect soil samples from different fields, please label and add field information to the plastic bag accordingly


For Additional Information contact.
Dr. Maíra Duffeck mairodr@okstate.edu
What OK Cotton Growers Should Know about the Two-Spotted Cotton Leafhopper, aka Cotton Jassid
Ashleigh M. Faris, OSU Extension Cropping Systems Entomologist Department of Entomology and Plant Pathology Oklahoma State University
Jenny Dudak, OSU Extension Cotton Specialist, Department of Plant & Soil Sciences Oklahoma State University
Maxwell Smith, OSU IPM for Cotton Extension Specialist Department of Entomology and Plant Pathology, Oklahoma State University
Published 8.29.25
The two-spotted cotton leafhopper, also known as the cotton jassid (Amrasca biguttula), has not been detected in Oklahoma cotton production as of August 27, 2025. However, this insect pest has been confirmed to be causing significant injury in cotton fields that have high populations of the jassid throughout the southeastern United States (Figure 1). Although it is not known to currently be in Oklahoma cotton acres, our cotton growers and consultants are encouraged to keep an eye out for this pest and to report sightings of the insect or related damage to the OSU Cotton Extension team for confirmation.

Two-Spotted Cotton Leafhopper Identification & Injury
Cotton jassids are small, sap-sucking insects that are pale green insects with yellowish-green wings. They can be distinguished from most native North American species by the pair of black spots head and black spots on the tip of each wing (Figure 2). The immature nymph stages are even smaller than the adults; they are wingless but light green in color like the adults. (Figures 3 and 4).

The cotton jassid feeds on the underside of leaves, causing hopperburn—a rapid yellowing, reddening, and browning that can quickly weaken plants (Figure 5). Initially, injury symptoms may look like nutrient deficiency with slight yellowing along the leaf tips and margins. Injury may also present as upward curling/cupping of the leaves. Once early symptoms are visible, leaves decline rapidly, turning red and brown. Because late-stage hopperburn can resemble a spider mite infestation, growers and consultants should scout for the pest causing injury prior to initiating control. Cotton jassid populations and hopperburn symptoms usually begin on field edges before moving into the cotton field.
Suggested Threshold, Scouting, and Chemical Control Guidance
Current recommendations for the suggested threshold and chemical control options are based on insecticide trials conducted by University of Florida, University of Georgia, Clemson University, and the University of Auburn Extension Entomologists. The threshold at which treatment is recommended for the cotton jassid is 2 nymphs per leaf with injury present anywhere in the field. To scout, inspect the underside of the main stem leaf on the third, fourth, or fifth node from the top of the cotton plant. Sample a minimum of 25 leaves across plants and average counts across the number of leaves sampled.
In terms of management, multiple products seem to provide good efficacy. Bidrin (6 oz/a) has been consistent in multiple trials across Florida, Georgia, and South Carlina, but may be difficult if whiteflies are an issue. Centric (2 oz/a) and Transform (1.5 oz/a) seem to be consistent as well. One product that should not be used is Bifenthrin, which has proven not to be effective across multiple trials. Information on suggested chemical control options, their efficacy, and general IPM guidance will be forthcoming as more is learned about this pest in U.S. cotton systems.
If you detect the cotton jassid in Oklahoma cotton, please contact
IPM for Cotton Extension Specialist Maxwell Smith,
Toto, I’ve a feeling we’re not in Kansas anymore. Double Cropping, Orange edition
It has been pointed out that the blog https://osunpk.com/2025/06/09/double-crop-options-after-wheat-ksu-edition/ had a significant Purple Haze. And I should have added the Oklahoma caveat. So Dr. Lofton has provided his take on DC corn in Oklahoma.
Double-crop Corn: An Oklahoma Perspective.
Dr. Josh Lofton, Cropping Systems Specialist.
Several weeks ago, a blog was published discussing double-crop options with a specific focus on Kansas. I wanted to address one part of that blog with a greater focus on Oklahoma, and that section would be the viability of double-crop corn as an option.
Double-crop farming is considered a high-risk, high-reward system to try. Establishing a crop during the hottest and often driest parts of summer can present challenges that need to be overcome. Double-crop corn faces these same challenges and, in some seasons, even more. However, it is definitely a system that can work in Oklahoma, especially farther south. If you look at that original blog post, one of the main challenges discussed is having enough heat units before the first frost. When examining historic data, like those below from NOAA, the first potential frost date for Northcentral and Northwest Oklahoma may be as early as the first 15 days of October but more often will be in the last 15 days of October. In Southwest and Central Oklahoma, this date shifts even later to the first 15 days of November. This is later than Kansas, especially northern Kansas, which has a much higher chance of experiencing an early October freeze. I do not want to downplay this risk; however, it is one of the biggest risks growers face with this system, and a later fall freeze would greatly benefit it. We have been conducting trials near Stillwater for the past five years on double-crop corn and have only failed the crop once due to an early freeze event. But in that year, both double-crop soybean and sorghum also did not perform well.

The main advantage of double-crop corn is that if you miss the early season window, it offers the best chance for the crop to reach pollination and early grain fill without the stress of the hottest and driest part of the year. Therefore, careful management is crucial to ensure this benefit isn’t lost. In Oklahoma, we have two systems that can support double-crop corn. In more central and southwest Oklahoma, especially under irrigation, farmers can plant corn soon after wheat harvest, similar to other double-crop systems. This planting window helps minimize the impact of Southern Rust, which can significantly reduce yields in some years, and may reduce the need for extensive management. This earlier planting window is often supported by irrigation, enabling the crop to endure the hotter, drier late July and early August periods. Conversely, in northern Oklahoma, planting often occurs in July to allow pollination and grain fill (usually 30-45 days after emergence) to happen in late August and early September. During this period, the chances of rainfall and cooler nighttime temperatures increase, both of which are critical for successful corn production.
Other management considerations include maturity. Based on initial testing in Oklahoma, particularly in the northern areas, we prefer to plant longer-maturity corn. Early corn varieties have a better chance of maturing before a potential early freeze but also carry a higher risk of undergoing critical reproduction stages (pollination and early grain fill) during hot, dry periods in late summer. Testing indicates that corn with a maturity of over 110 days often works well for this. However, this does not mean growers cannot plant shorter-season corn, especially if the season has generally been cooler, though the risk still exists depending on how quickly the crop can grow. Based on testing within the state, the dryland double-crop corn system typically does not require adjustments to other management practices, such as seeding rates or nitrogen application. Because of the need to coordinate leaf architecture and manage limited water resources, higher seeding rates are not recommended. Maintaining current nitrogen levels allows the crop to develop a full canopy.
The final question often comes as; how does it yield? This will depend greatly. Corn looks very good this year across that state, especially what was able to be planted earlier in the spring. However, in recent years, delaying even a couple of weeks beyond traditional planting windows has lowered yields enough that double-crop yields are often similar. We have often harvested between 50-120 bushels per acre in our plots around Stillwater with double-crop systems. So, the yield potential is still there.
In the end, Oklahoma growers know that double-crop is a risk regardless of the crop chosen. There are additional risks for double-crop corn, such as Southern Rust in the south and freeze dates in the north. This risk is increased by the presence of Corn Leaf Aphid and Corn Stunt last season, and it is not clear if these will be ongoing problems. Therefore, growers need to be careful not to expect too much or to invest too heavily in inputs that may not be recoverable if there is a loss. One silver lining is that if double-crop corn doesn’t succeed in any given year, growers can still use it as forage and recover at least some of their costs.
Any questions or concerns reach out to Dr. Lofton: josh.lofton@okstate.edu
Army Worms are Marching!!!!
This article by Brian Pugh (new OSU State Forage Specialist) just came across my desk today in perfect timing as yesterday I saw significant army worm feeding on the crabgrass in my lawn, and not to mention the 20+ caterpillars on my sidewalk. So while Brian is noting Eastern Ok, Id say we are at thresholds in Payne Co also. And no, we don’t need to discuss that my lawn as more crabgrass than Bermuda.
Fall Armyworms Have Arrived In Oklahoma Pastures and Hayfields
Brian C. Pugh, Forage Extension Specialist
Fall armyworms (FAW) are caterpillars that directly damage Bermudagrass and other introduced forage pastures, seedling wheat, soybean and residential lawns. There have been widespread reports of FAW buildups across East Central and Northeast Oklahoma in the first two weeks of July. Current locations exceeding thresholds for control are Pittsburg, McIntosh and Rogers counties.

Female FAW moths lay up to 1000 eggs over several nights on grasses or other plants. Within a few days, the eggs hatch and the caterpillars begin feeding. Caterpillars molt six times before becoming mature, increasing in size after each molt (instars). The first instar is the caterpillar just after it hatches. A second instar is the caterpillar after it has shed its skin for the first time. A sixth instar has shed its skin five times and will feed, bury itself in the soil, and pupate. The adult moth will emerge from the pupa in two weeks and begin the egg laying process again after a suitable host plant is found. Newly hatched larvae are white, yellow, or light green and darken as they mature. Mature FAW measure 1½ inches long with a body color that ranges from green, to brown to black.

Large variation in color is normal and shouldn’t be used alone as an identifying characteristic. They can most accurately be distinguished by the presence of a prominent inverted white “y” on their head. However, infestations need to be detected long before they become large caterpillars. Small larvae do not eat through the leaf tissue, but instead, scrape off all the green tissue and leave a clear membrane that gives the leaf a “window pane” appearance. Larger larvae however, feed voraciously and can completely consume leaf tissue.

FAW are “selective grazers” and tend to select the most palatable species of forages on any given site to lay eggs for young larvae to begin feeding. The caterpillars also tend to feed on the upper parts of the plant first which are younger and lower in fiber content. Forage stands that are lush due to fertility applications are often attacked first and should be scouted more frequently.

To scout for FAW, plants from several locations within the field or pasture need to be examined. Examine plants along the field margin as well as in the interior. Look for “window paned” leaves and count all sizes of larvae. OSU suggests a treatment threshold is two or three ½ inch-long larvae per linear foot in wheat and three or four ½ inch-long larvae per square foot in pasture. An easy-to-use scouting aid can be made for pasture by bending a wire coat hanger into a hoop and counting FAW in the hoop. The hoop covers about 2/3 of a square foot, so a threshold in pasture would be an average of two or three ½ inch-long larvae per hoop sample. An excellent indicator plant in forage stands is Broadleaf Signalgrass (seen in the foreground of the hay bale picture). Broadleaf Signalgrass tends to be preferentially selected by female moths and is one of the first species that window paned tissue is observed during the onset of an infestation.
Approximately 70% of the forage consumed during an armyworm’s lifetime occurs in the final instar before pupating into a moth. This indicates that control measures should focus on small instar caterpillars (1/2 inch or less) before forage loss increases exponentially. Additionally, small larvae are much more susceptible to insecticide control than larger caterpillars.

Remember, FAW are actively reproducing up until a good killing frost, so don’t let your guard down. If you think you have an infestation of fall armyworm please contact your local County Extension Educator. Additionally, before considering chemical control consult your Educator for insecticide recommendations labeled for forage use.
For more information or insecticide options consult:
Oklahoma State University factsheet:
CR-7193, Management of Insect Pests in Rangeland and Pasture
https://extension.okstate.edu/fact-sheets/management-of-insect-pests-in-rangeland-and-pasture.html
