Home » Guest Author (Page 4)
Category Archives: Guest Author

Learning from Strip Trials.
This article is written by Dr. George Rehm, University Minnesota, Soil Fertility Specialist (retired).
See more of Dr. Rehm’s blogs at agwaterexchange.com.
Use of strip trials as a learning as a way to learn is becoming more popular across the Corn Belt. This is to be expected. Crop producers have a thirst for information. With GPS technology and yield monitors, and the use of common sense, it’s not difficult to establish strip trials for the purpose of evaluating a concept or compare one or more products or rates of a product. There are, however, some important considerations for the conduct of a strip trial. These begin with planning before planting and continue with appropriate interpretation of the data following harvest. These considerations are summarized in the paragraphs that follow.
IN THE PLANNING PROCESS, SIMPLICITY RULES — Speaking from years of experience, when planning, it’s very easy to bite off more than you can chew. What looks easy or simple on paper can be a logistical problem when you go to the field. So, make comparisons simple. If comparing rates of nitrogen fertilizer for corn, for example use no more than three rates. It’s nice to have a control (the variable of interest is not used). The treatments to be compared must be repeated in the field at, least three times. If comparing rates of nitrogen fertilizer for corn, for example, use no more than three rates. It’s nice to have a control (the variable of interest is not used). The treatments to be compared must be repeated at least three times. The replication must be in the same field. It is almost a waste of time if fields are used as replications. If a control is used, it should also be replicated three times.
SITE UNIFORMITY — The day of selection of the site for a strip trial is probably the most day for the entire project. Soil uniformity is a must. There is no easy and simple procedure that can be used to correct for lack of soil uniformity at the site. There are several tools that can be used to select for soil uniformity. The Soil Survey should not be ignored. Soil test information based on either grid or zone sampling can also be very valuable. Time spent in selecting a uniform site is time well spent.
PRODUCTION PRACTICES — Once a specific comparison has been selected it’s very important to keep other production practices constant. For example, information from a strip trial designed to compare nitrogen rates has little value if varieties are changed in the trial area. Except for the factor of interest, keep all other production practices constant across the strip trial area. Two production practices that change across the strip trial cannot be changed at the same time. Careful planning for this type of project takes time and thought.
DATA COLLECTION — Unless there are special reasons to do otherwise, samples collected from treatments at any strip trial site should be collected at the same time. This practice reduces variability in the data. Considering yields, use of combine yield monitors or weigh wagons is certainly appropriate. Although this may be obvious to most, it is essential to record yields from each strip separately.
STATISTICAL ANALYSIS — There’s a reason for repeating (replicating) each treatment at least three times. The project is not complete until the data collected have been analyzed with a mathematical procedure called “statistical analysis”. I think that we all realize that there is variability across any field. With all factors being equal, we could combine four strips across any field and the yields would not be the same. So, when we see differences in yield, the obvious question is: “Is the difference in the yield the result of a real difference caused by the factor being considered or variability across the field?” Statistical analysis is the tool needed to answer this question. There is no other way to answer this question.
Let’s look at an example illustrating the importance of statistical analysis. Using strip trials in different counties, two rates of nitrogen were compared. There were three strips of each rate. For a field in Kandiyohi County with corn following a soybean crop, yields from the lower nitrogen rate (149 lb. soil + fertilizer N/acre) were 123, 157, and 170 bu./acre for the three strip receiving this rate. These three yields average to 150 bu./acre. For the higher nitrogen rate (199 lb. soil + fertilizer nitrogen), the three yields were 157, 176, and 166 bu./acre. This averages 171 bu./acre. Using these arithmetic averages, the initial conclusion is that the higher nitrogen rate was better than the lower nitrogen rate It would certainly appear that 171 bu./acre is better than 150 bu./acre. If statistical analysis is used, however, the difference in yield is not statistically significant. Why? This conclusion is the consequence of substantial variability among three replications. In other words, the arithmetic difference is due to variability in yield across the field rather than the factor being compared.
For the same project, a strip trial was used on a field in Carver County. The corn/soybean rotation was used. The low nitrogen rate was 102 lb./acre and the higher nitrogen rate was 151 lb./acre. Yields from the three strips with the low nitrogen were 181, 196, and 195 bu./acre with an average of 191 bu./acre. For the high nitrogen rate, yields from the three strips were 208, 210, and 207 bu./acre with an average of 208 bu./acre. Statistical analysis of this yield data showed that the difference between 191 bu./acre and 208 bu./acre was not due to variability in the field. It was, in fact, the result of the rate of nitrogen applied. Notice that variability among the three replications for each nitrogen rate was small. Thus, we can say with confidence that there was a REAL difference in yield caused by the rate of applied nitrogen.
Nearly everyone involved with strip trials wants to present an economic analysis of the yield data. This is logical. HOWEVWE, an economic interpretation is only valid if differences between or among treatments is STATISTICALLY SIGNIFICANT. Otherwise, we make a serious MISTAKE that could have serious economic consequences. For the Kandiyohi County field, the difference in yield could have been caused by treatment applied or natural variation in the field. We have no way of knowing the real cause. For the trial in Carver County, we are sure that the difference in yield was due to the rate of nitrogen applied. Use of statistical analysis allows us to reach this conclusion. Now economic interpretation can be applied to the results.
SUMMING UP — Use of strip trials is a good way to make comparisons between or among factors that affect crop production. In addition, these comparisons can be conducted in growers’ fields. However, it’s not an easy task to do an accurate job. Good planning is needed at the beginning and STATISTICAL ANALYSIS is essential at the end. There are too many comparisons where statistical analysis is ignored and only arithmetic averages are used. Without statistical analysis, there can be any number of interpretations of the data. Statistical analysis eliminates the potential for confusion.
Dr. George Rehm,
University of Minnesota
Nutrient Management Specialist (retired)
rehmx001@umn.edu
Check Canola for Aphids
Tom A. Royer, Extension Entomologist
I have received scattered reports of cabbage aphids infesting canola racemes and low levels of green peach aphids feeding on canola leaves. Cabbage aphids are small, 2.0-2.5 mm (1/12 inches) blue-gray aphids with short cornicles. They are usually covered with a powdery wax coating. They are often found clustering on the developing panicle (Figure 1). They can cause plant stunting, distortion of growth, and flower abortion.

Cabbage Aphids
Green peach aphids are pale green to yellow (and sometimes pink) with long cornicles and antennae and measure 1/8 inch. They are found in winter and spring on leaves (Figure 2). Their feeding can cause stunting and defoliation. They can also transmit plant disease-causing viruses such as cauliflower mosaic and turnip mosaic viruses.
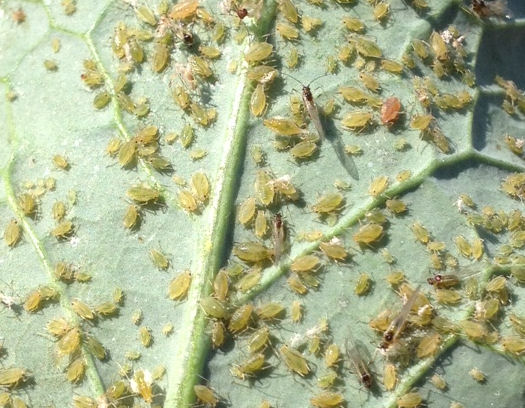
Green Peach Aphids
Scout for aphids by looking on the underside of the leaves, and racemes. For cabbage aphids, research conducted in Australia suggests that an insecticide application is justified if 20% of the racemes are infested with cabbage aphids.
")

For green peach aphids, research conducted by Dr. Kris Giles at OSU found that and average of one green peach aphid per plant can reduce seed yield by about 0.5 lb per acre. Thus, if the cost of an application is $10 per acre, and canola is bringing $0.2 per pound (quote from ADM Farmer Services 04/08/2016 www.adm.com), an infestation of 100 aphids per plant would cause yield loss of $10.00 (50 lb, x $0.2/pound) which is equal to the cost of the application. This is known as the ECONOMIC INJURY LEVEL (EIL). We typically set the ECONOMIC THRESHOLD (ET) below the EIL, in this case at 80% of the EIL (80 aphids per plant) to give time to schedule an application before the EIL is reached. Below is a set of suggested ECONOMIC THRESHOLDS, based on the cost of the application.
Application Cost Economic Injury Level Economic Threshold (Application cost/
0.5 lb/aphid x $0.2/lb (0.8 x EIL)
$8.00/acre 80 aphids/plant 64 aphids/plant\
$10.00/acre 100 aphids/plant 80 aphids/plant
$12.00/acre 120 aphids/plant 98 aphids/plant
$14.00/acre 140 aphids/plant 112 aphids/plant
Current recommendations for control of aphids in canola are listed in CR-7667, Management of Insect and Mite Pests in Canola which can be obtained online at http://pods.dasnr.okstate.edu/docushare/dsweb/Get/Document-3045/CR-7667web2009.pdf.
Transform® insecticide is no longer registered for use in canola as of November 11, 2015. Only existing stocks that have already been purchased and delivered to the grower before the cancellation can be applied according to the label.
Remember, green peach aphids have a history of developing resistance to pyrethroids, which are the primary registered insecticides for use in canola. Thorough coverage of an insecticide application is necessary to obtain optimal control.
If you notice natural enemy activity, especially lady beetles, and want to preserve their activity, keep several things in mind. Our research shows that Beleaf® insecticide is particularly benign to natural enemies because of its slow acting efficacy on aphids, which allows aphid-feeding beneficials to continue to eat them with little to no consequence on their biology. That being said, cabbage aphid may contain toxins that they acquire through their feeding which make them less palatable to some predators, and reduces their effectiveness as natural controls.
With all pesticides, review label restrictions for applications during bloom, as honeybees can be killed if exposed to several of the registered products. One registered product, Beleaf® (FMC Corporation) does not have any restrictions for application during bloom.
Wrong Then Wrong Now
This article is written by Dr. George Rehm, University Minnesota, Soil Fertility Specialist (retired).
See more of Dr. Rehm’s blogs at www.agwaterexchange.com
Various products and/or concepts that pertain to crop production seem to cycle with time. I’m never surprised. There are foo-foo juice products that have disappeared only to appear sometime later under a different name. Likewise, there are concepts that have been proven by research to be bogus. Yet, they don’t die. There appear again. It seems that there are always some who attempt to make money from farmers by selling revived foo-foo juice products or bogus concepts. To paraphrase a line from a once-popular song: “everything old is new again”.
Recently, there has been a revived promotion of CATION EXCHANGE CAPACITY (CEC) and CATION RATIOS. The CATION RATIO concept has sometimes been referred to as “BALANCED SOIL FERTILITY”. So, some review of what we know about CEC and balanced cations is probably appropriate at this time.
The concept of CEC and it’s relationship to crop production was first researched in New Jersey in the mid-1940’s. At that time, researchers measured the CEC of soils as well as the exchangeable cations (Ca++, Mg++, K+). The CEC is a nearly constant property of soils that is directly related to soil texture. Sandy soils have relatively low CEC values. BY contrast, fine textured soils have high CEC values. The exchangeable cation values (Ca++, Mg++, K+) vary with other soil properties — mainly soil pH.
In the New Jersey soils, the researchers measured the exchangeable cations in a “productive soil” and a “non-productive” soil. They calculated the ratios of one cation to another. For example, the ratio of Ca++ to Mg++ was 6.5 to 1. Alfalfa was the test crop. So, it was thought that a “productive” soil should have a Ca to Mg ratio of this value. These researchers neglected one important piece of information. This was that lime had been used on the “productive” soil but not on the “non-productive” soil and the sandy soil had an acid pH. The lime supplied Ca++. Do you suspect that productivity of the alfalfa crop was a consequence of the use of lime rather the magic ratios? In the years that followed, numerous research projects were conducted through the Midwest for the purpose of investigating the effect of cation ratios on crop production.
There were the comparisons of fertilizer recommendations provided by various Soil Testing Laboratories. Some followed the cation ratio concept. Others Used the sufficiency approach based on the response of crops to measured levels of available nutrients by standardized, routine analytical procedures. Although costs of fertilizer recommended by these approaches varied considerably each year for extended periods of time (14 years in Nebraska), crop yield was not affected. Fertilizer recommendations based on the cation ratio concept were much higher than those that were based on the sufficiency approach.
The results of the Midwest research led to the conclusion that the ratio of one cation to another in soils had no effect on crop production. Crop response to fertilizer was the result of the nutrient supply in the soil — not ratios. Nutrient supply is measured by the standard analytical procedures. The crop has no interest in ratios. Given the uniformity of the conclusions of these research projects, it appeared that the “ideal ratio” or “balanced nutrient” concept was dead and had disappeared from our knowledge base that pertained to soil fertility and fertilizer use.
Land Grant universities in the northern and western Corn Belt have published reports that document the bogus nature of the ideal cation ratio concept. Staff at Agvise Laboratories have worked hard and listed the links to these reports on the Laboratory web site. The web address is: agvise.com if anyone is interested in the detailed reports.
The concept of IDEAL CATION RATIOS has been thoroughly research for several crops. There is consistency in the results of this research. This concept is not in any way related to effective and economical fertilizer recommendations. In fact, use of this concept has a high probability of producing less than optimum recommendations for use of potash fertilizers on sandy soils.
The concept of IDEAL CATION RATIOS as a basis for fertilizer recommendations is truly bogus and has no place in agriculture. Please use this ratio concept if you want to waste money on fertilizer purchases in 2015. Those who advocate the use of this concept are not up to date in their understanding of modern principles of soil fertility. They’re still working in the 1940’s. It was WRONG THEN and it’s WRONG NOW.
Dr. George Rehm,
University of Minnesota
Nutrient Management Specialist (retired)
rehmx001@umn.edu
Canola Planting Considerations.
Pre- and Early-Season Weed Management-
Dr. Angela Post- Small Grains Extension Weed Scientist
Winter canola is an excellent rotational partner with wheat. Integrating canola into a wheat system allows for the cleanup of weedy fields with primarily grassy weed problems. Conventional and Roundup Ready (RR) varieties are excellent choices for managing most grassy weeds including ALS-resistant populations, because grass-only herbicide options can be used in canola without crop injury. For specific grasses that are very difficult to control, like cereal rye and jointed goatgrass, it is advisable to use canola in year one of your rotation and Clearfield wheat in the second year of your rotation before going back to conventional wheat varieties. Due to sensitivity of canola, Clearfield wheat varieties should not be used the year prior to rotating into canola.
Canola planting time is just around the corner and many are going out now with preplant burndown applications. Remember that canola is sensitive to dicamba, 2,4-D, and MCPA and these products should not be used inside of 30 days before planting. Glyphosate, glufosinate and paraquat are all potential options for removing broadleaf weeds in no-till systems prior to planting. These products have no planting restriction for canola. Tillage is the best option to remove weeds in conventionally tilled systems.
It is important to consider your previous herbicide choices when planning for canola in the fall. Many herbicides used for spring weed control in wheat can limit rotation to winter canola. These include all Group 2 herbicides all of which have long rotation restrictions to canola, meaning you cannot plant canola in these fields for 18-24 months depending on the product. See Table 1 for a list of specific restrictions. If you have used one of these products in wheat in the spring, you must plant a canola variety with the SURT trait. Examples of varieties with this trait include: DKW 45-25, DKW 46-15, DKW 47-15, HyClass 115W, HyClass 125W. All of these varieties are also RR. Kansas State also has an open-pollinated non-RR variety called Sumner with the SURT trait for growers that prefer to grow conventional canola. Note that the SURT trait is not a genetically modified trait.
No additional in-season herbicide options have been added to the toolbox for winter canola growers in the upcoming season. Both trifluralin (Treflan) and ethalfluralin (Sonolan) can still be used as preemergent weed control options in canola in conventionally tilled systems. Both need to be mechanically worked into the ground and need an activating rainfall to work properly. Quizalofop (Assure II), sethoxydim (Poast), and clethodim (Select and many generics) are the grass control herbicides available for use in canola and can be used on any canola variety including RR varieties. Roundup Ready canola growers are allowed two applications of glyphosate at 22 oz/A each over the top of the emerged crop. Clopyralid (Stinger) is the only over-the-top broadleaf control option other than glyphosate. These weed control applications should be made early in the season between 2- and 6-leaf canola, and prior to bud formation, while weeds are still very small. Applications should be spaced at least 14 days apart. Early applications will eliminate fall weed competition with canola and protect yield. For more information or questions involving weed management in canola contact Extension Weed Specialist Angela Post at 405-744-9588 and follow @OSUWeedScience.
Table 1. Rotation restrictions for planting canola following wheat. For herbicides
applied in crops other than wheat please refer to the herbicide label.

1Minimum interval between herbicide application and seeding canola. Refer to full herbicide labels for specific information as geography, pH, and rainfall may affect this interval.
2Rotation restriction can be overcome with use of a SURT canola variety.
3Rotation intervals depend on geography.
4Rotation interval depends on herbicide rate.
Pre plant fertilizer concerns with Canola
Dr. Brian Arnall- Precision Nutrient Managment Extension Specialist
When it comes to pre-plant fertility issues with canola, I typically have two soap boxes. But at this point in the canola game we are behind in terms of getting soil samples collected or applying lime and getting a boost at emergence. So assuming pH is good and you know what your soil nutrient level is we can move on to planting. One thing that over the past seven or eight years keeps coming up is the importance of starter fertilizers and the rates and sources used. Getting that little canola plant off to a good start is extremely important however with that little bitty seed a little goes a long way.
The figure below shows the impact of DAP (18-46-0) placed in row, on relative canola stands, when canola was planted in 15” rows. At 5 lbs/A of N or 28 lbs/A of DAP, the canola stand is reduced to 75%. While this seems like a great loss, the compensating nature of canola and the fairly high seeding rates used, this is a manageable level. The benefits of the additional nitrogen and phosphorus applied with the seed also help out-weigh the loss of stand. The addition of the P near the germinating seed is vital. The phosphorus aids in early root and shoot growth, helping the crop to get off to a good start. In areas where soil pH is of concern the P near the young seedling will reduce aluminum toxicity and allow the plant to tolerate the low pH. Keep in mind, while banding P will help in acidic soils, canola is still very sensitive and will not tolerate the same low pH conditions as our winter wheat’s.

Impact of DAP (18-46-0) placed in-row on canola stand in terms of lbs N ac-1.
One very important factor to keep in mind is the impact of the critical rate and row spacing. The 5 lbs of N per acre critical level set for 15” row spacing is increased to 10 lbs on 7.5’s and cut to 2.5 lbs on 30’s. The change in rate is because we use lbs per acre. So if you apply the same amount of material per acre on a 15” spacing and a 30” spacing there is actually twice as much material in the 30” row. Table 1, shows the equivalent amount of N placed in row for popular row spacing’s.

Equivalent amount of N based on 15″ row spacing.
Oklahoma State has released a smart phone app, available for both apple and android devices, to aid in determining maximum in-furrow rates. Canola Starter app provides guidelines based upon the nutrient concentrations of the fertilizers you plan to use. The final note on in-furrow fertilizer with Canola, avoid using urea. The likelihood of injury from the urea converting to ammonia greatly outweighs any potential benefits. For further information, comments, or questions please contact Dr. Brian Arnall Extension Precision Nutrient Specialist 405-744-1722 or following me on Twitter @OSU_NPK.
Canola Starter available on iOS and Android. For more information see http://www.dasnr.okstate.edu/apps.
Winter canola planting decisions:
Josh Lofton- Cropping Systems Specialist
Josh Bushong- Extension Associate
Stand establishment is one of the most critical practices in canola planting. This is not only because these stands are highly influential to end of the season yields but because getting the crop up with adequate growth will be critical to give the plants the best over-winter survivability possible. To accomplish this, growers need to make sure they make good field selection and follow good planting practices
Field Selection:
Soil nutrients are a critical aspect. Soil samples should be collected on a regular basis to ensure optimum productivity. Also, ensure recommendations for winter canola are followed, as nutrient recommendations for other crops may be invalid. For more information canola fertilizer management refer to the nutrient management section by Dr. Arnall.
Winter canola grows similar to winter wheat. Fields that can adequately produce wheat have the potential to produce canola. These include, well-drained soils with adequate soil nutrients. However, canola can be more sensitive than wheat. One aspect that canola can be more sensitive to is soil pH. While wheat can be grown in soils as low as 5.5 without significant yield loss, canola must be grown on soils with pHs above 5.8. In fact, canola is best grown in soils with soil pHs ranging from 6.0 to 7.0. Therefore, it is essential that if fields have lower pH, lime be applied with adequate time to neutralize the acidic soil pH before rotating into canola.
In addition to all the soil conditions, crop rotation should be considered prior to planting canola. One of the major hindrances in growing canola in rotation with other crops is herbicide carry-over. For detailed information regarding this aspect, refer to table 1 in the weed management section. To account for this, detailed field records should be kept and consulted before rotating with canola.
Planting Date:
Planting time depends on many aspects. Insured growers should plant within the constrained planting dates. For Oklahoma, the earliest planting date is September 10th with the latest date being October 10th. However, within these guidelines, seedbed and environmental conditions should be the driving factor to determine when to plant. The goal of these planting dates is to have the crop germinate, emerge, and establish 6-8 true leaves prior to the first killing freeze. As a general rule, the crop should be planted 4 to 6 weeks before this freeze. To achieve good establishment of the crop, canola should be planted into firm seedbed with adequate soil moisture. If canola is planted into dry soil (dusted in), the effective planting date will be delayed until adequate conditions for germination and emergence exist. In no-till systems, it is important to remember that canola emergence and growth will be slightly delayed. Therefore, if adequate conditions exist, no-till fields should be planted before similar conventionally tilled fields.

Uneven canola emergence. Canola on left emerged later and did not
have enough time to put on adequate growth (Photo courtesy of Josh
Bushong)
Planting depth, plant spacing, and seeding rate:
Since canola is a small seeded crop, shallow planting is required. For best germination and emergence, seeds should be planted between 0.5 and 1 inch. If adequate moisture is available deeper, planting depth can be increased. However, deeper planting has the potential to decrease germination, percent emergence, and early fall growth, so deeper planting should only be used when the planting condition advantage is present and only on certain soils. Therefore, caution should be used in planting deeper than 1 inch. Furthermore, even though moisture may be present deeper, seeds should not be planted deeper than 1.5 inches.
Oklahoma growers have options when deciding row spacing used for planting canola and depend on what equipment there is available and their production system. Since canola is typically rotated within a winter wheat production system, box drills and air seeders are typically widely available. Row-spacing for these can range from 6 to 15 inches. Row spacing within this range has little impact on final yields. As producers move from drills and air seeders to planters, row spacing typically increases from 15 up to 30 inches. All of the row-widths have the potential to produce adequate canola. Some, however, will be more beneficial than others. Narrow row spacing has the potential to result in early canopy closure, reduce potential weed competition, and may help reduce shatter prior to harvest (especially when direct harvested). Wider spacing, however, allows for some flexibility in specialized planter attachments used, especially row-cleaners, which can be greatly beneficial in no-till systems.
Seeding rates for canola in Oklahoma range from 1 to 5 lbs/A. However, row spacing plays a critical role on seeding rates. When canola is planted on less than 15 inch spacing, some flexibility exists for planting rates. Higher seeding rates can produce more uniform stands, uniform maturity, and thinner stalks that can greatly help harvest efficiency. Too high of stands can increase disease incidence, winterkill, and lodging. When row spacing is increased beyond 15 inches, care should be taken not to over seed. High seed populations can increase fall growth and potentially increase hypocotyl height, which in turn can lead to high winterkill. Optimum populations for this wider row spacing typically range from 2 to 3 lbs/A.
For further information, comments, or questions please contact Josh Lofton Extension Cropping Systems Specialist at 405-744-3389 or follow me on Twitter @OSU_oilseeds.
While producers have faced many challenges over the last couple of seasons in Oklahoma agriculture, the outlook for winter canola looks very promising for the upcoming season. Producers should focus on taking all of the right steps to ensure the 2015-2016 crop starts on the right foot and takes full advantage of the promising conditions this season. Good luck to everyone one on their upcoming production season and if anyone from Oklahoma State extension can help or assist in any way, please feel free to contact.
Recent Weather Causing Corn (and Sorghum) Injury From Pre-emerge Herbicides
While this is not about fertility in the southern Great Plains I feel it is a very important topic. I will not be surprised if we don’t start seeing this in some of the corn and sorghum that was just planted before the rains. I would also add the over the years I often see bleaching in sorghum, that looks similar to zinc and/or iron deficiency, caused by atrazine injury. This typically occurs when atrazine is applied prior to a heavy rain. The atrazine is washed down slope and into the rows, the injury is almost always seen in low lying areas. The crop usually grows out of it.

Atrazine injury in sorghum. Heavy rains followed application. Pic via Rick Kochenower.
Brian A.
This article is written by Mr. Cody Daft, Field Agronomist Western Business Unit, Pioneer Hi-Bred
Have you noticed any corn leafing out underground prior to emergence? Have you seen tightly rolled leaves or plants that can’t seem to unfurl leaves and look buggy whipped? Almost all of the fields I have looked at recently have shown these symptoms in at least a portion of the field, and some fields this has been very widespread. The common denominator in all the fields I have viewed has been the herbicides applied were a metolachlor (Dual/Cinch type products) and the weather (cooler than normal, wetter than normal). Similar issues can be noted in grain sorghum to some extent.
The recent wet weather and water-logged soils have increased the possibility of corn injury from many popular soil applied herbicides. Corn growing in wet soils is not able to metabolize (degrade) herbicides as rapidly as corn growing in drier conditions. Plant absorption of herbicides occurs by diffusion. What this means is that the herbicide diffuses from locations of high concentration (application site on the soil) to low concentration (plant roots). The diffusion process continues regardless of how rapidly the corn is growing. In corn that is not growing rapidly (cool, wet conditions) corn plants can take up doses of herbicide high enough to show damage and a few differences in symptomology.
The unfortunate aspect of wet soil conditions is that additional stress is put on the plant not only to metabolize herbicide residues, but also to ward off diseases and insects. These additional stresses can impact a corn plant’s ability to metabolize herbicide.
The most common type of herbicide injury observed under these conditions is associated with chloroacetamide herbicides. These herbicides are used for control of grass and small seeded broadleaf weeds, and are seedling root and shoot inhibitors.
These products include the soil-applied grass herbicides such as:
- Dual/Cinch/Medal II
- Degree/Harness
- Microtech/Lasso
- Frontier/Outlook
- Define/Axiom
- And other atrazine premixes like Lumax (a premix of mesotrione (Callisto), s-metolachlor (Dual II Magnum), atrazine and a safener benoxacor).
What About The Injury Symptoms?
Before corn emergence:
- Stunting of shoots that result in abnormal seedlings that do not emerge from soil.
- Corkscrewing symptoms similar to cold/chilling injury.
- Corn plants and grassy weeds may leaf out underground and leaves may not properly unfurl.
After corn emergence:
- Buggy whipping – leaves may not unfurl properly.

Figure . Buggy-whipping symptom from carryover of PPO herbicides to corn.via https://www.pioneer.com/home/site/us/agronomy/library/herbicide-carryover/
What About Safeners?
Products like DUAL II Magnum herbicide contain the safener benoxacor which has been shown to enhance S- Metolachlor metabolism in corn. This enhanced metabolism can reduce the potential of S- Metolachlor injury to corn seedlings when grown under unfavorable weather conditions such as cool temperature or water stress. However, a safener is not the silver bullet, and slow plant growth may still have trouble metabolizing the herbicide even with a safener…but it does help the severity of damage/symptoms.
Will The Plants Recover?
Plants that have leafed out underground or show corkscrewed mesocotyl symptoms are likely to not recover or even emerge from below the soil. Larger plants that are already emerged that show tightly rolled leaves and are buggy whipped will most likely recover once the field sees drier conditions and we have warm weather and sun light to assist in better plant growth.
More Information Discussing Corn Injury From Pre-emerge Herbicides Here:
Cody Daft
Pioneer Hi-Bred
cody.daft@pioneer.com
Variability in Tissue Testing/Plant Analysis
This article is written by Dr. George Rehm, University of Minnesota, Soil Fertility Specialist (retired).
See more of Dr. Rehm’s blogs at http://www.agbuzz.com
During the past two or three years, there has been an increase in the promotion for the use of tissue testing/plant analysis as a management tool in development of fertilizer programs. At times, if you read all of the advertising literature, you might get the idea that the practice of plant analysis/tissue testing is so important that you can’t make a profit without it. So, is this really a new and exciting management tool to be used by every crop producer? A close examination of the facts without all of the advertisement leads to the answer: not really.
There are problems with placing dependence on the use of this management practice. Some of the problems and pitfalls have been identified by Dr. Dan Kaiser, Associate Professor and Extension Soil Scientist at the University of Minnesota. These are briefly described in the paragraphs that follow.
STAGE OF GROWTH at sampling is a major consideration. With corn, for example, it’s impossible to compare analysis of plants sampled at the V5 growth stage with analysis of plants sampled at some later growth stage. As the corn plants grow, nutrient concentration is diluted and concentrations, therefore, decrease. If all other factors are equal, a concentration of nitrogen, for example, may be higher and adequate at V5. The concentration percentage will be lower at V10 and still be adequate. This concept has been verified by substantial research conducted by faculty at Land Grant universities.
In order for tissue testing/plant analysis to be meaningful, the results of analysis of the plant tissue must be compared to some standard. For corn and other crops, these standards have not been developed for every stage of growth. This is usually true for stages early in the growing season. That’s primarily because concentrations are rapidly changing at those times. So, what’s the point of analyzing corn plants at the V5 growth stage if there are no standards for nutrient concentrations at that growth stage? I don’t know. I don’t believe that there is general agreement among researchers knowledgeable about plant analysis as to what the adequate concentrations are in whole plant corn tissue at the V5 growth stage. With corn, accurate interpretation of plant analysis information is possible if plant samples (leaves) are collected at the time of silking.
At silking, however, it’s too late to apply nutrients that might correct a deficient situation. So, analysis of corn leaf tissue at silking cannot be used to predict rates of any nutrients needed during the growing season.
TIME OF DAY used for sampling can also affect concentration of nutrients in specific plant parts.
Research has shown that this is especially true for nitrogen. Nutrients may be more concentrated in plant tissue in the morning; but, as plants grow, the concentration can be diluted by dry matter added during the day that is the result of the normal growth process. This effect of time of sampling just adds to the variability that may be experienced with plant analysis.
HYBRID AND?OR VARIETY can also have a substantial influence on “critical levels” associated with plant analysis. Researchers are finding that the rate of nutrient accumulation is different among modern hybrids or varieties. Therefore, it’s reasonable to expect that nutrient concentration in any plant part at any stage of growth will vary with hybrid or variety. This is yet another source of variability in plant analysis.
It is known that nutrient concentration in plant tissue is affected by stage of growth at time of sampling, time of day used for sampling, and hybrid or variety. There are obviously other factors that contribute to variability in the results of plant analysis.
Many have used the results of plant analysis as an aid in the diagnosis of a problem in a field. Plant analysis was originally developed as a diagnostic tool. When combined with companion soil samples, this tool has helped to solve many problems. It is, however, a stretch to use this practice as a tool to predict the rate of any nutrient that should be applied to any crop. It is simply not a predictive tool that can be used with confidence. There are too may opportunities for error.
While there are several factors that can produce variability in the concentration of nutrients in plant tissue, there is only minimal variability in the laboratory procedures used in the analysis. The analytical procedures have been standardized among laboratories by using “standards” with known concentrations. If there problems with the laboratory analysis, the routine use of these “standards” will identify those problems.
Plant analysis/tissue testing is not something new. The concept has been around for many years. When used appropriately, it has value. However, the ability of this management practice to predict rates of nutrients needed for crop production is now and has been limited. Don’t expect any more than what this practice can deliver.
Dr. George Rehm,
University of Minnesota
Nutrient Management Specialist (retired)
rehmx001@umn.edu
Sampling for pH and liming in continuous no-till fields
This article is written by Dr. David Mengel, Kansas State University Soil Fertility Specialist.
One question that commonly comes up with continuous no-till operations is: “How deep should I sample soils for pH?” The next common question is: “How should the lime be applied if the soil is acidic and the field needs lime?”
Sampling depth in continuous no-till
First, sampling depth. Should two sets of samples be taken, at different depths?
Our standard recommendation for pH is to take one set of samples to a 6 inch depth. On continuous no-till fields where most or all of the nitrogen (N) is surface applied, we recommend taking a second sample to a 3-inch depth. We make the same recommendation for long-term pasture or grass hayfields, such as a bromegrass field that has been fertilized with urea annually for several years.
Nitrogen fertilizer is the primary driving force in lowering soil pH levels, so N application rates and methods must be considered when determining how deep to sample for pH. In no-till, the effects of N fertilizer on lowering pH are most pronounced in the area where the fertilizer is actually applied. In a tilled system, the applied N or acid produced through nitrification is mixed in through the action of tillage and distributed throughout the tilled area.
Where N sources such as urea or liquid UAN solutions are broadcast on the surface in no-till system, the pH effects of the acid formed by nitrification of the ammonium will be confined to the surface few inches of soil. Initially this may be just the top 1 to 2 inches but over time, and as N rates increase, the effect of acidity become more pronounced, and the pH drops at deeper depths. How deep and how quickly the acidity develops over time is primarily a function of N rate and soil CEC, or buffering capacity.
Where anhydrous ammonia is applied, or liquid UAN is knifed or coulter banded below the surface, an acid zone will develop deeper in the soil, usually 2-3 inches above the release point where the fertilizer is placed in the soil. So if the ammonia is injected 8 inches deep, there will be acid bands 5 to 8 inches below the soil surface. As with long-term surface applications, these bands will expand over time as more and more N fertilizer is placed in the same general area. The graphic below illustrates the effect of a high rate of ammonia placed in the same general area in the row middle on a high CEC soil for more than 20 years.
The actual depth of the acid zone in fields fertilized with ammonia gets tricky as application depth can vary depending on the tool used to apply the ammonia. Traditional shank applicators generally run 6 to 8 inches deep, so a sample for pH measurement could be taken at 3-6 inches or 5-8 inches deep, depending on how deep the shanks were run. The new low-disturbance applicators apply the ammonia 4-5 inches deep. A sweep plow or V-blade applies ammonia only 3-4 inches deep. So sampling depth for pH should really depend on where the acid-forming N fertilizer is put in the soil.

Mengel and West, Purdue Univ.
Liming application methods in continuous no-till
Now, where do you place the lime in continuous no-till? If you surface apply N, then surface apply the lime. That’s a simple but effective rule. But remember that surface-applied lime will likely only neutralize the acidity in the top 2-3 inches of soil. So if a producer hasn’t limed for 20 years of continuous no-till and has applied 100 to 150 pounds of N per year, there will probably be a 4-5 inch thick acid zone, and the bottom half of that zone may not be neutralized from surface-applied lime. So, if a producer is only able to neutralize the top 3 inches of a 5-inch deep surface zone of acid soil, would that suggest he needs to incorporate lime? Not really. Research has shown as long as the surface is in an appropriate range and the remainder of the acid soil is above pH 5, crops will do fine.
Liming benefits crop production in large part by reducing toxic aluminum, supplying calcium and magnesium, and enhancing the activity of some herbicides. Aluminum toxicity doesn’t occur until the soil pH is normally below 4.8. At that pH the Al in soil solution begins to increase dramatically as pH declines further. Aluminum is toxic to plant roots, and at worse the roots would not grow well in the remaining acid zone.
This implies that the acid zones from ammonia are probably not a major problem. We have monitored ammonia bands in the row middles of long-term no-till for many years and while the pH got very low, below 4.5, we never saw any adverse impacts on the crop that would justify liming and using tillage to incorporate the lime. In fact, some nutrients such as zinc, manganese, and iron can become more available at low pH, which can be an advantage at times.
Yield enhancement is not the only concern with low-pH soils, however. Herbicide effectiveness must also be considered. The most commonly used soil-applied herbicide impacted by pH is atrazine. As pH goes down, activity and hence performance goes down. So in acid soils weed control may be impacted. We do see that in corn and sorghum production.
Liming products for no-till
When choosing a liming product, is there any value to using dolomitic lime (which contains a large percentage of magnesium in addition to calcium) over a purely calcium-based lime product? On most of our soils in Kansas we are blessed with high magnesium content. So as long as we maintain a reasonable soil pH, there normally is enough magnesium present to supply the needs of a crop. Calcium content is normally significantly higher than magnesium, so calcium deficiency is very, very rare in Kansas. The soil pH would need to be below 4.5 before calcium deficiency would become an issue. Before calcium deficiency would occur, aluminum toxicity or manganese toxicity would be severely impacting crop growth. So producers really don’t have to worry about a deficiency of calcium or magnesium on most Kansas soils.
What about the use of pelletized lime as a pH management tool on no-till fields? The idea has been around for a while to use pel-lime in low doses to neutralize the acidity created from nitrogen and prevent acid zones from developing. There is no reason it won’t work, if you apply enough product each year. Pel-lime is a very high-quality product, normally having 1800 to 2000 pounds of effective calcium carbonate (ECC) per ton, and can be blended with fertilizers such as MAP or DAP or potash easily.
But it is costly. As an example, at a cost of $160 per ton and 1,800 lbs effective calcium carbonate (ECC) per ton, 100 pounds of ECC pel-lime costs $8.80. If it costs $25 per ton to buy, haul, and apply a 50% ECC limestone, that equates to $2.50 per 100 pounds ECC.
If you were applying 100 pounds of urea-based nitrogen, it would take approximately 180 pounds of ECC to neutralize the acidity produced by the N. This would require 200 pounds of 1,800 pound ECC pel-lime or 360 pounds of 50% ECC ag lime. The cost would be around $16 per acre with pel-lime or $4.50 per acre with ag lime. So technically, the pel-lime option is fine. But it would cost more than 3 times as much, at least in this example. You can use your own figures regarding costs and ECC of different lime products available to you to do a similar calculation. Deciding which product to use is a simple economic choice.
Summary
Applying N fertilizer to soil will cause the soil to become acidic over time. Placement of the applied N and the level of soil mixing done through tillage determine where the acid zones will develop. Make sure your soil testing program is focused on the area in the soil becoming acidic, and apply the lime accordingly.
Dave Mengel
Kansas State University
Professor Soil Fertility Specialist
dmengel@ksu.edu
