Home » Fertilizer (Page 9)
Category Archives: Fertilizer

Banding P as a Band-Aid for low-pH soils.
In the mid-1970s Dr. Robert Westerman banded 18-46-0 with wheat at planting in a low-pH soil near Haskel Ok. The impact was immediately evident. Soon after Oklahoma State University recommended the “Banding of Phosphate in Wheat: A Temporary Alternative to Liming” Figure 1. This method was a Band-Aid solution for the significant amount Oklahoma winter wheat production area which was either too far from a reliable lime source or under a short term lease contract.

Figure 1. The cover of an extension brochure distributed in Oklahoma during the 1980s.
Still today grain producers throughout the United States commonly farm a large percentage of land that is not their own. In the leasing process agreements can widely vary both on length of the lease and the amount of inputs that the land owner will pay. The wheat belt of Oklahoma is known for having large areas with low soil pH levels. A survey of soil samples submitted to the Oklahoma State University Soil, Water, and Forage Analytical Laboratory in 2011 under the winter wheat crop code showed 38% of the samples having a soil pH level below 5.5 (Figure 2). In Oklahoma short term leases with limited shared expenses have limited the access to agricultural lime for remediation of acidic soils. In the dry environment it may take up to one year before the lime applied has completely corrected the soil acidity problem. In a situation where the lease agreement is only for one to two years there may be no economic benefit for the producer to apply lime especially in regions where winter wheat average yields range from 20 to 40 bushel per acre. The current recommendation for winter wheat producers working on low-pH short term lease ground is to apply 30 lbs P2O5 ac-1 ( 65 lbs 18-46-0 ac-1) with the seed for grain only wheat and 60 lbs P2O5 ac-1 (130 lbs 18-46-0 ac-1) for dual-purpose wheat production. This recommendation however is for soils with adequate soil test P, but low soil pH. When soil test P is below optimum the 30 or 60 units is applied in addition to the amount needed to reach 100% sufficiency.
Banding P is considered a “Band-Aid” as the problem of soil acidity is not re-mediated it is only masked. If not addressed the pH of the soil will continue to fall over time. Aluminum and manganese toxicity is the greatest issue associated with soil acidity. Available aluminum, a predominant mineral in the regions soils, is pH dependent. A change of 1.0 pH level changes available Al by 1000 fold. For example a soil with a pH of 5.0 will have an approximate Al concentration of 27 ppm, critical level of winter wheat is 27 ppm, while a soil with a pH of 4.0 will have an Al concentration of approximately 27,000 ppm. Aluminum and manganese toxicity does not only impact grain yield but it has an even greater impact on biomass production. Kariuki et al (2007) recorded the impact of soil acidity on eight current winter wheat lines. Correcting soil acidity increased wheat grain yield by 82% and increased forage production by 150%. For Oklahoma the forage produced by the wheat crop is as important as the grain. Oklahoma is unique in that approximately 50% of the four million acres of winter wheat are grazed annually much of this under the dual –purpose “Graze-N-Grain” management. To maintain productivity on the land without the long term investment of Ag lime producers have been applying phosphorus fertilizer to alleviate the impact of aluminum toxicity.

Figure 2. Summary of the soil pH values for the 614 samples submitted to the Oklahoma State University Soil, Water, Forage, Analytical Laboratory under wheat crop code during the time frame of 1-1-2011 11-30-2011.
In 1992 Boman et al reported that impact banding phosphates with seed on winter wheat forage production (Figure 3). Across the four locations the addition of P increase yield from 2 to 4 fold. The work by Kaitibie et al (2002) documented an additional aspect of banding P. In the variable and often arid climate of Oklahoma the activation of lime can take a significant amount of time, in upwards of one year. In comparison banding P has an immediate impact on the alleviation of metal toxicities. Figure 4 shows the incorporation of lime improved forage yield but not to the degree of banding P. For continuous winter wheat producers the time between application of lime and planting can be quite short. Typically the previous crop will be harvest in mid-June and in the best case scenario lime would be applied and incorporated by mid-July. At this point there is only 60 days until the next wheat crop is planted in early to mid-September.
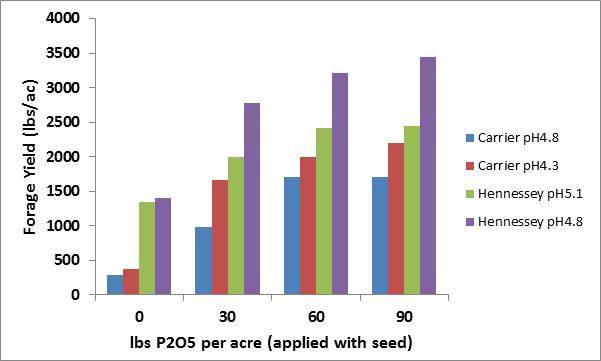
Figure 3. The impact of banding phosphate with seed at planting in acidic soils on winter wheat forage production in Oklahoma. Chart adapted from Boman et al. 1992.

Figure 4. The impact of applying of phosphate fertilizer and lime on the forage production of two winter wheat cultivars in Oklahoma. Chart adapted from Kaitibie et al. 2002.
For many with short term leases banding P is still the only viable solution for wheat production in low-pH soils. However there is ground being farmed by the owner or is under long-term lease that is still receiving this Band-Aid approach. At the 1980-1990 fertilizer and lime prices there is good reason to continue this method. However the cost of P fertilizer has quadrupled since the 1970’s. The last ten year average price of P2O5 was $0.42 per pound while it cost an average of $0.10 in the 70s. So for those who own or are able to work out beneficial lease agreements Table 1 should be of interest. By year three the cost of phosphate exceeds the cost of lime. If you were to use the values from the 1980’s of $0.20 per pound of P2O5 and $25 per ton ECCE lime it was not until year five, the last year before reapplying lime, did the cost of P exceed cost of lime.

Table 1. Cumulative cost per acre of applying phosphorus and lime to remediate aluminum and manganese toxicity based on a five year liming cycle. The 30 lb P2O5 rate is recommended for grain only production while dual-purpose wheat require 60 P2O5. Prices based on current quotes of DAP at $590 a ton ($0.41 lb P2O5) and Ag lime at $30 per ton ECCE.
As the 2014 winter wheat and canola crop is being transported to the bins it is extremely important to take advantage of this time to take soil samples from as many fields as possible. Soil pH issues must be understood and addressed. I often remind producers soil pH plays an exception number of roles. Not only does it impact yield as shown before but it impacts rooting (ability to survive stresses), nutrient availability, and herbicide activity. Our SU herbicides (Finesse, Powerflex, and Maverick) that are used widely across the state are negatively impacted by low soil pH. Figure 5 shows how at a pH of 5.6 Glean is down to a 50% concentration in the soil approximately two weeks after application. So when it comes time to make the call for phosphorus or lime try to weigh all of these aspects, at current prices P is not that much cheaper, improving pH will improve yield and potentially improve weed control.
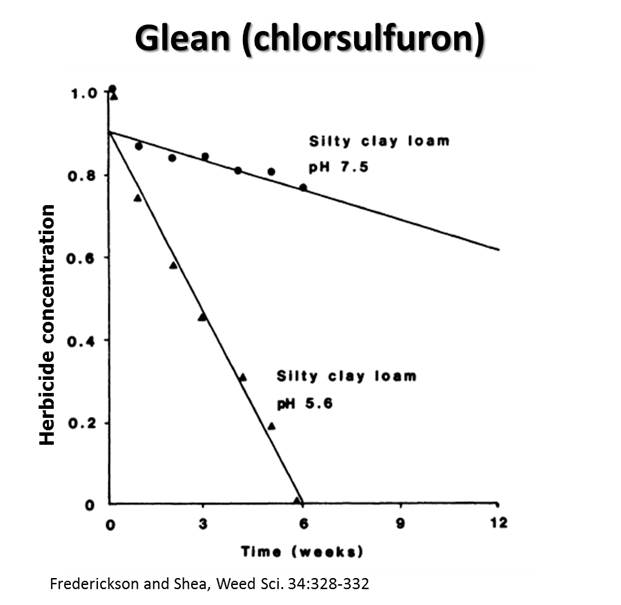
Figure 5. The concentration of Glean (Cholorsulfuron) remaining in too soils (pH 7.5 and pH 5.6) over a twelve week period.
Citations
Boman,R.K., R.L. Westerman, G.V. Johnson, and M.E. Jojola. 1992. Phosphorus fertilization effects on winter wheat production in acid soils. In Soil Fertility Highlights, Agronomy Department Oklahoma Agricultural Experiment Station, Oklahoma State University.Agronomy 92-1 pg171-174
Kaitibie,S., F. M. Epplin, E.G. Krenzer, and H. Zhang. 2002. Economics of lime and phosphorus application for dual-purpose wheat production in low-pH soils. Agron. J. 94:1139:1145.
Kariuki, S.K., H. Zhang, J.L. Schroder, J. Edwards, M. Payton, B.F. Carver, W.R. Raun, and E.G. Krenzer. 2007. Hard red winter wheat cultivar responses to a pH and aluminum concentration gradient. Agron J. 99:88-98.

First hollow stem advisor available on Mesonet
This is a great tool. It looks like we have very little time between green-up and hollowstem.
The advisor uses a mathematical model that predicts the probability of first hollow stem based on soil heat units and wheat first hollow stem category (early, middle, or late). The model was developed by J.D. Carlson at OSU using first hollow stem data from the wheat variety testing program, and model development was made possible through a grant from the Oklahoma Wheat Commission.
You can navigate to…
View original post 322 more words
Nitrogen Rich Strips
The Nitrogen Rich Strip, or N-Rich Strip, is a technique/tool/process that I spend a great deal of time working with and talking about. It is one of the most simplistic forms of precision agriculture a producer can adopt. The concept of the N-Rich strip is to have an area in the field that has more nitrogen (N) than the rest. Due to our fertilizer applicators this is typically a strip. The approach maybe somewhat new but at one point most producers have had N-Rich Strips in their fields, albeit accidentally. Before the days of auto-steer it was not uncommon, and honestly still is not, to see a area in the field that the fertilizer applicator either doubled up on or skipped. In our pastures and dual purpose/graze out wheat every spring we can see the tell-tale signs of livestock deposits. When over laps or “Cow Pox” become visible we can assume the rest of the field is behind in nitrogen. I like to tell producers that the goal of the N-Rich strip is to make a really big cow pie.

- Cow Pox, Image courtesy Kaitlyn Nelson
What I like most about the N-Rich Strip approach is its Simplicity. The N-Rich Strip is applied and; Scenario 1. The N-Rich Strip becomes visible (Greener) you APPLY NITROGEN, Scenario 2. The strip is not visible you Option A. DON’T APPLY NITROGEN Option B. Apply Nitrogen Anyways. The conclusion to apply N or not is based on the reasoning that the only difference between the N-Rich Strip and the area 10 ft from it is nitrogen, so if the strip is greener the rest of the field needs nitrogen. If there is no difference N is not limiting and our research shows N does not have to be applied. However producers who decide to be risk adverse (in terms of yield) can apply N but it would be advised to do so at a reduce the rate. Now is a good time to note that the N-Rich Strip alone provides a Yes or No, not rate recommendation. At OSU we use the GreenSeeker optical sensor and Sensor Based Nitrogen Rate Calculator (SBNRC) to determine the rate, but that discussion will come later. I equate the change from using yield goal N rate recs to the N-Rich Strip as to going from foam markers to light bars on a sprayer. Not 100% accurate but a great improvement.

N-Rich Strip in no-till wheat near Hobart OK.
Now that we have covered the WHY, lets get down to the nuts and bolts HOW, WHEN, WHERE.
How the strip is applied has more to do with convenience and availability than anything else but there are a few criteria I suggest be met. The strip should be at least 10 ft wide and 300 ft long. The rate should be no less than 50 lbs N (above the rest of the field) for grain only wheat and canola, 80 lbs N for dual purpose wheat. The normal recommendation is that when applying pre-plant either have a second, higher rate programmed into the applicator or make a second pass over an area already fertilized. Many will choose to rent a pull type spreader with urea for a day, hitting each field.
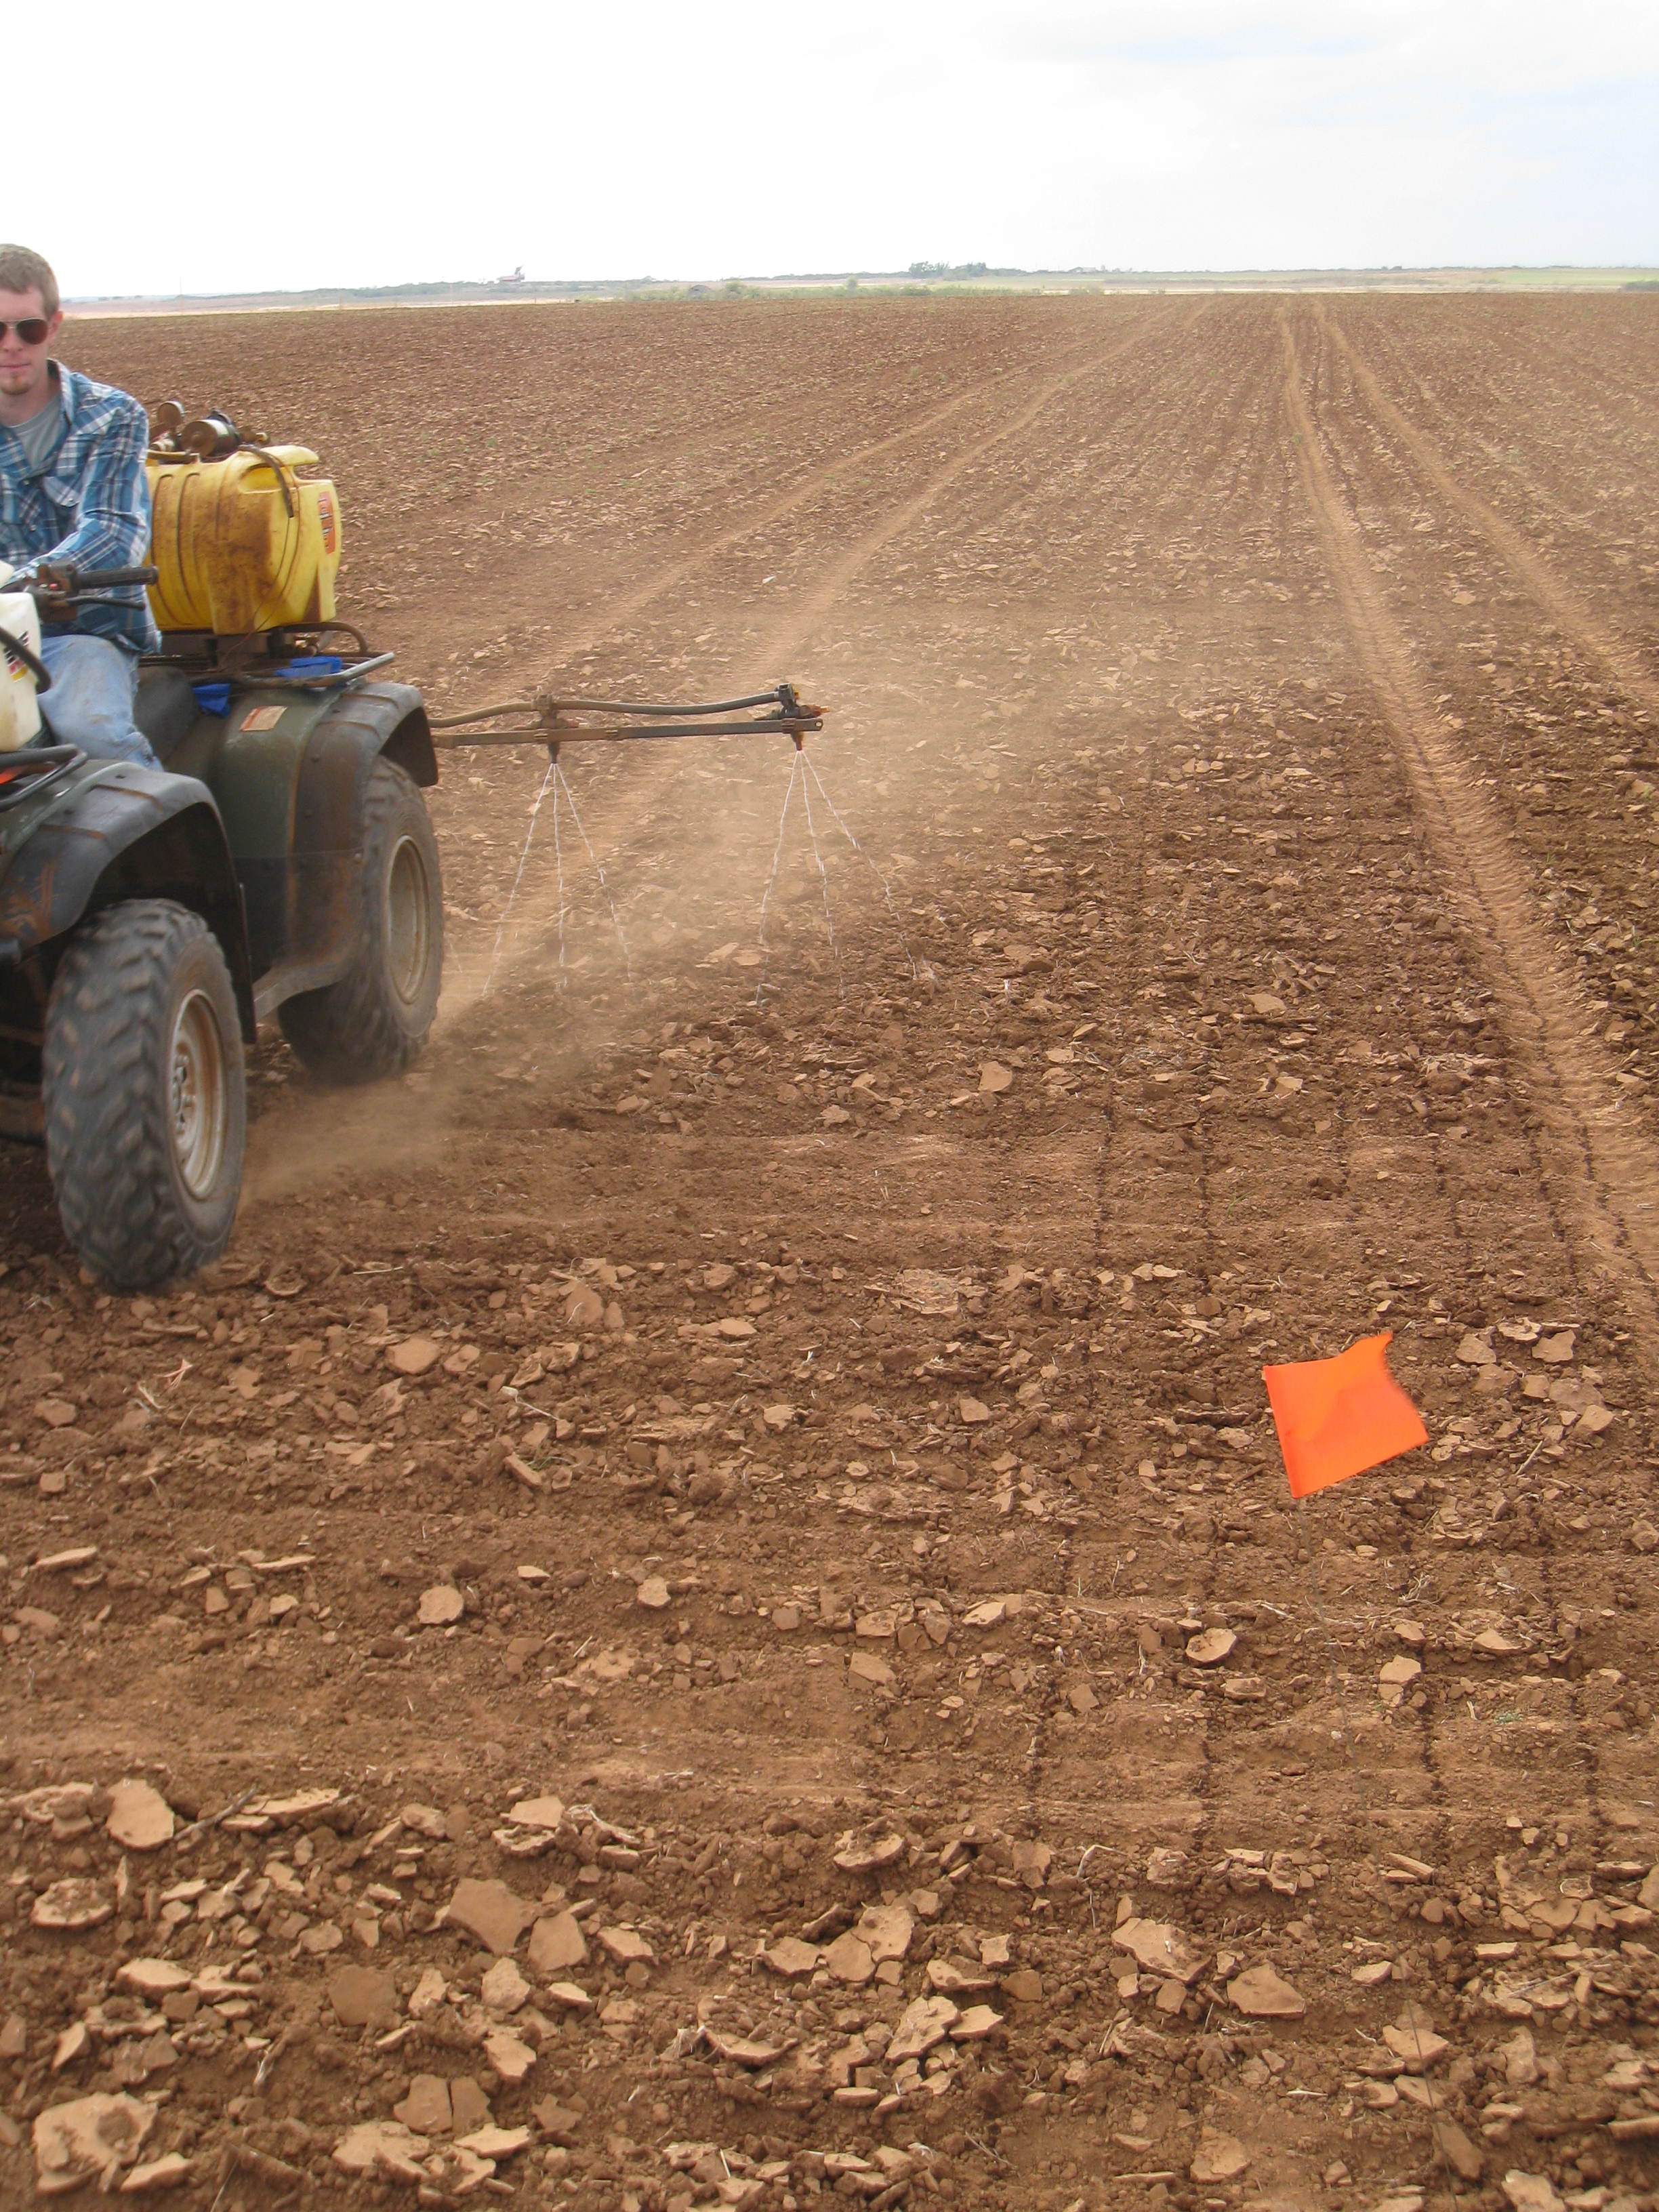
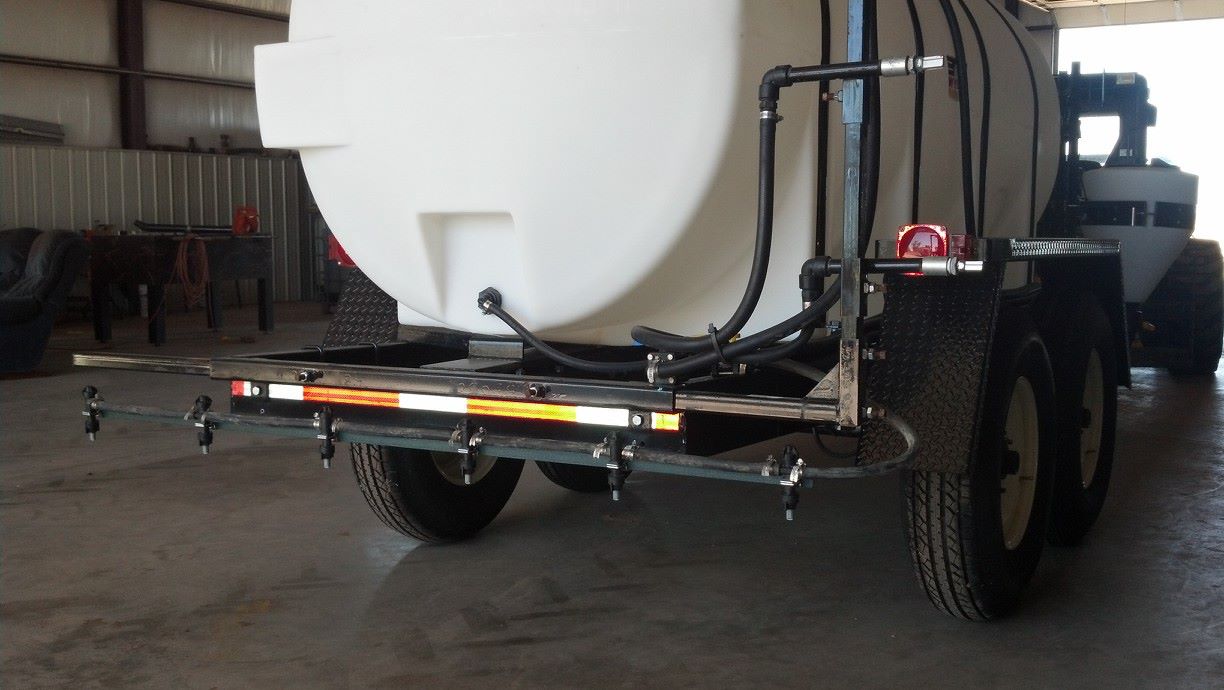
Becoming more popular are applicators made or adapted for use. ATV sprayers are the most common as they can be multi-purpose. In most cases a 20-25 gallon tank with a 1 gpm pump is placed on the ATV with an 8-10ft breakover boom. The third applicator is a ride away sprayer with a boom running along the rear of the trailer. In all cases when liquid is the source I recommend some form of streamer nozzle. In most cases there is not a great deal of thought put into what source. I recommend whichever source is the easiest, cheapest, and most convenient to apply.

Vincent N-Rich Strip Applicator, Ponca City OK
Oklahoma State Univ. N-Rich Strip Applicator
Gard N-Rich Strip Applicator, Fairview Ok
When the strip is applied in winter crops proper timing is regionally dependent. For the Central Great Plains, ideally the fertilizer should be applied pre-plant or soon after. However, in most cases as long as the fertilizer is down by the first of November everything works. This does not say a strip applied after this time doesn’t work but it leaves more room for error. There is a chance the crop could already be stressed or the nitrogen tied up and not release in time. However when the N-Rich Strip approach is used on the Eastern Shore in Virginia and Maryland the strips have to be applied at green up. The soils in that region are very deep sands and nitrogen applied in the fall may not make it to the spring. Also most wheat producers in the area make three or more applications of nitrogen unlike the two (pre and top) of the Great Plains. It is always important to make the tools fit your specific regional needs and practices and not the other way around.
Where is actually the biggest unknown. The basic answer is to place the N-Rich Strip in the area that best represents the field. Many people question this as it doesn’t account for spacial variability in the field, and they are correct. But my response is that in this case spatial variability is not the goal, temporal variability is. Keeping in mind the goal is to take a field which has been receiving a flat yield goal recommendation for the last 30+ years and make a better flat rate recommendation. My typically request is that on a field with significant variability either apply a strip long enough to cross the zones or apply smaller strips in each significant area. This allows for in-season decisions. I have seen some make the choice to ignore the variability in the field, made evident by the strip, and apply one rate and others choose the address the variability by applying two or more rates. One key to the placement of N-Rich Strips is record keeping. Either via notes or GPS, record the location of every strip. This allows for the strips to be easily located at non-response sites. It is also recommended to move the strip each year to avoid overloading the area with N.
I hear a great deal of talk about how it would take to much time to put out the N-Rich Strip. However the majority of producers that do it once on one field, end up doing it every year on every field. There is very likely someone in your area who is using the N-Rich Strips. As top-dress grows closer keep an eye out for a blog “Using the GreenSeeker Sensor and Sensor Based Nitrogen Rate Calculator”.
For more information on N-Rich Strips check out the YouTube video below, visit http://www.npk.okstate.edu or contact me directly at b.arnall@okstate.edu. I have lots of material I am happy to share and distribute.
See the YouTube Video http://www.youtube.com/watch?v=kJ3DSwWYgE8
