Home » Corn (Page 2)
Category Archives: Corn

Comparing Ortho/Poly-Phosphate Ratios for In-Furrow Seed Safe Starter Fertilizer
Guest Author, Dr. Jake Vossenkemper; Agronomy Lead, Liquid Grow Fertilizer
New Research Comparing Ortho/Poly-Phosphate Ratios for In-Furrow Seed Safe Starter Fertilizers
Article Summary
- Ortho-phosphates are 100% plant available, but a high percentage of poly-phosphates in starter fertilizers convert to ortho-phosphate within just two days of application.
- This quick conversion from poly- to ortho-phosphate suggests expensive “high” ortho starter fertilizers are not likely to result in increased corn yields compared to seed-safe fluid starters containing a higher percentage of poly-phosphate.
- A field study conducted near Traer, IA in the 2016 growing season found less than 1 bu/ac yield difference between a 50/50 ortho:poly starter and high ortho-phosphate starter.
- High ortho starters cost more per acer than 50/50 ortho:poly starters, but do not increase corn grain yields.
Poly-phosphates Rapidly Convert to Plant available Ortho-Phosphates
Given poly-phosphates are not immediately plant available and ortho-phosphates are immediately plant available, this gives the promoters of “high” ortho-phosphate starters ample opportunity to muddy the waters. Nevertheless, the facts are that poly-phosphates are rather rapidly hydrolyzed (converted to) into ortho-phosphates once applied to soils, and this hydrolysis process generally takes just 48 hours or so to complete.
In Sept. of 2015, I posted a blog discussing some of the more technical reasons why the ratio of ortho- to poly-phosphates in starter fertilizers should have no impact on corn yields. For those that are interested in those more technical details, I encourage you to follow this link to the Sept. 2015 blog post: https://www.liqui-grow.com/farm-journal/.
While I was relatively certain that the ratio of ortho- to poly-phosphates in liquid starters should have no effect on corn yields, I decide to “test” this idea with a field trial in the 2016 growing season conducted near Traer, IA.
How the Field Trial Was Conducted
In this field trial, we used two starter products applied in-furrow at 6 gal/ac. Each starter had an NPK nutrient analysis of 6-24-6. The only difference between these two starters was the ratio of ortho- to poly-phosphate. One of these starters contained 80% ortho-phosphate and the other contained just 50% ortho-phosphate with the remainder of the phosphorous source in each of these two starters being poly-phosphate. Each plot was planted with a 24-row planter (Picture 1) and plot lengths were nearly 2400 ft. long. In total, there were 5 side-by-side comparisons of the two starter fertilizers that contained different ratios of ortho- to poly-phosphates.
Field Trial Results
In general, there were no large differences in yield between the two starters in any of the 5 side-by-side comparisons, except for comparison number 5 (Figure 1). In comparison number 5, the 50% ortho/50% poly-phosphate starter actually yielded 6 bu/ac more than the high ortho starter. But averaged over the 5 side-by-side comparisons, there was less than 1 bu/ac yield difference between the high and low ortho starters (P=0.6712).
In addition to finding no differences in grain yield between these two starters, the high ortho starters generally cost about $1 more per gallon (so $6/ac at a 6 gal/ac rate) than the low ortho starters. So the more expensive high ortho starter clearly did not “pay” its way in our 2016 field trial.
More Trials Planned for 2017
While our findings agree with other research-comparing ortho- and poly-phosphate starter fertilizers (Frazen and Gerwing. 1997), we want to be absolutely certain that our fertilizer offerings are the most economically viable products on the market. Therefore, I have decided to run this same field trial at one location in northern Illinois in 2017, and at one location in central Iowa in 2017. Stay tuned for those research results this fall.

Picture 1
Planting starter fertilizer trials near Traer, IA in the growing season of 2016.
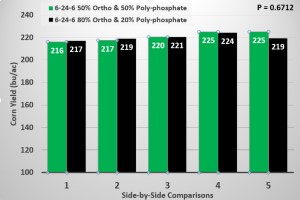
5 side-by-side comparisons of corn yield from two 6-24-6 starter fertilizers that contained either 50% ortho & 50% poly-phosphate or 80% ortho and 20% poly-phosphate. The field trial was conducted near Traer, IA in the growing season of 2016.
References
Franzen D. and J. Gerwing. 2007. Effectiveness of using low rates of plant nutrients. North Central regional research publication No. 341. http://www.extension.umn.edu/agriculture/nutrient-management/fertilizer-management/docs/Feb-97-1.pdf (accessed 8 of Sept 2015).
The Sufficiency versus Replacement tipping point.
Being educated in the realm of Soil Fertility at Oklahoma State University by the likes of Dr Gordon Johnson and Dr. Bill Raun, Brays Nutrient Mobility Concept and Mitscherlich’s Percent Sufficiency Concept are ingrained in my psyche. In class the concept of Build and Maintain for phosphorus fertilizer management was just briefly visited and not discussed as a viable option. For anyone in the corn belt, and some Okies, reading this that may seem unusual. But when I was in school on average in Oklahoma there was about 100-200 K acres of 100 120 bpa (bushel per acre) corn, 300-400 K acres of 40-50 bpa sorghum, and over 5 million acres of 20-30 bpa wheat. In a state with those average yields, replacing P removed by the crop was not a major concern.
But times are changing. There is more corn and soybean planted and the achievable yields of all crop are increasing. While the average winter wheat producer should not be worried about replacement rates of P there is a growing group of producers that should. This blog will discuss the scenarios in which sufficiency rates are best and those in which replacement should be considered. The OSU factsheet PSS-2266 goes in-depth on each of these methods.
Applying P based on sufficiency will increase soil test P levels in a low yielding environment. For example on a 20 bpa wheat field that starts out with a soil test P level of 0. Using the sufficiency recommendation each year the soil test value will reach 20 ppm (40 STP) in 20 years. A 30 bpa field would take 30 years. Yes that is a long time but the soil test value is increasing a little each year. The point of 20 ppm is important because at that level the crop is 95% sufficient, meaning if no P is added the crop will only reach 95% of the fields yield potential.
Using a mass balance approach we can determine at what point does the crop remove more than we can supply with in or near furrow starter fertilizer. Table 1 shows the values I am using for the discussion. The first column is just the average amount of P removed per bushel of grain, most of our grains fall in the .4 to .5 lbs P per bushel range. The second column is the soil test value at which P level is said to be at 90% sufficient. The reason this column is included is that the P2O5 reccomendation for this P level fits into the starter rate for all crops. The low high starter rates are the typical range of P2O5 that is delivered within the safe range (N based) and what I see as the common rates. These values may be above or below what you use.

Table 1. Values used to create Table 2. Phosphorus per bushel of grain. Mehlich 3 soil test value (ppm) at which crop is determined to be 90% sufficient, typical range of P2O5 applied with starter fertilizers, recommended P2O5 rate when soil test P is at 90% sufficiency.
Table 2 is pretty simple but it is the center point of this article. The one caveat I need to add is this assumes strip till or 2*2 / 3*2 is not being used. Table 2 is using the starter range and removal value to determine the yield level the starter can support. The first take on this table may provide some hint on why in a state with 5 million acres of wheat averaging 36 BPA the state soil fertility specialist didn’t focus on replacement rates. In fact for most for most the the wheat ground P application is higher than removal and P levels are slowly increasing. The big take home from this table should be is my yield level outside this window? If so do not immediately go out in crease your P rates but do take a close look at your system as a whole. Take a close look at your cropping system, not just one seasons but look at a three or four year cycle. Add up P applied and P removed, are you positive or negative net balance? If you are negative take a long hard look at your soil test over time. Some soils can supply a large amount of P even if you are removing more than you apply. Other soils will be rapidly drawn down. Regualr soil testing allows for producers to keep an eye on these values.

Table 2. Yield level (bushels per acre) at which P removal is equal to P added in starter fertilizer application.
In the end even if the production warrants the use of replacement rates, the current market may not. For more on that read https://osunpk.com/2016/08/27/now-may-not-be-the-time-for-replacement/.
Speaking of market currently both soybeans and cotton are getting a lot of attention due to how the economics is penciling out. Soybean is a “heavy” P crop pulls .8 lbs per bpa while cotton removes 13 lbs per bales. Both of these crops are salt sensitive and the rate of inforrow is typically quite low providing only about 6 lbs when on 30″ rows. If you are growing beans or cotton make sure you account for their removal when you talley up your system.
Below is a table that I wanted to add, well because I like it. This table illustrates that buildup, and drawdown, rate is heavily impacted by existing soil test value. In short it takes a lot more fertilizer P to raise soil test p levels in a very low P testing field than it does when soil test P is closer to optimum, 19 lbs per 1 lb at STP of 10 and 5 lbs per lb when STP is 65. The exact rate changes by soil type and the same holds true to drawn down via crop removal.

Amount of P2O5 above crop removal needed to increase soil test phosphorous based upon initial soil test results.
Adapted From http://www.spectrumanalytic.com/support/library/ff/Soil_test_P_and_K_buildup_and_drawdown.htm “Drawdown of Soil Test Phosphorus and Potassium Levels by Alfalfa, K.L. Wells & J.E. Dollarhide, Univ. of Kentucky, Soil Science News & Views, Vol. 21, No. 3, 2000”
Any questions or comments? Feel free to contact me at b.arnall@okstate.edu
Recent Weather Causing Corn (and Sorghum) Injury From Pre-emerge Herbicides
While this is not about fertility in the southern Great Plains I feel it is a very important topic. I will not be surprised if we don’t start seeing this in some of the corn and sorghum that was just planted before the rains. I would also add the over the years I often see bleaching in sorghum, that looks similar to zinc and/or iron deficiency, caused by atrazine injury. This typically occurs when atrazine is applied prior to a heavy rain. The atrazine is washed down slope and into the rows, the injury is almost always seen in low lying areas. The crop usually grows out of it.

Atrazine injury in sorghum. Heavy rains followed application. Pic via Rick Kochenower.
Brian A.
This article is written by Mr. Cody Daft, Field Agronomist Western Business Unit, Pioneer Hi-Bred
Have you noticed any corn leafing out underground prior to emergence? Have you seen tightly rolled leaves or plants that can’t seem to unfurl leaves and look buggy whipped? Almost all of the fields I have looked at recently have shown these symptoms in at least a portion of the field, and some fields this has been very widespread. The common denominator in all the fields I have viewed has been the herbicides applied were a metolachlor (Dual/Cinch type products) and the weather (cooler than normal, wetter than normal). Similar issues can be noted in grain sorghum to some extent.
The recent wet weather and water-logged soils have increased the possibility of corn injury from many popular soil applied herbicides. Corn growing in wet soils is not able to metabolize (degrade) herbicides as rapidly as corn growing in drier conditions. Plant absorption of herbicides occurs by diffusion. What this means is that the herbicide diffuses from locations of high concentration (application site on the soil) to low concentration (plant roots). The diffusion process continues regardless of how rapidly the corn is growing. In corn that is not growing rapidly (cool, wet conditions) corn plants can take up doses of herbicide high enough to show damage and a few differences in symptomology.
The unfortunate aspect of wet soil conditions is that additional stress is put on the plant not only to metabolize herbicide residues, but also to ward off diseases and insects. These additional stresses can impact a corn plant’s ability to metabolize herbicide.
The most common type of herbicide injury observed under these conditions is associated with chloroacetamide herbicides. These herbicides are used for control of grass and small seeded broadleaf weeds, and are seedling root and shoot inhibitors.
These products include the soil-applied grass herbicides such as:
- Dual/Cinch/Medal II
- Degree/Harness
- Microtech/Lasso
- Frontier/Outlook
- Define/Axiom
- And other atrazine premixes like Lumax (a premix of mesotrione (Callisto), s-metolachlor (Dual II Magnum), atrazine and a safener benoxacor).
What About The Injury Symptoms?
Before corn emergence:
- Stunting of shoots that result in abnormal seedlings that do not emerge from soil.
- Corkscrewing symptoms similar to cold/chilling injury.
- Corn plants and grassy weeds may leaf out underground and leaves may not properly unfurl.
After corn emergence:
- Buggy whipping – leaves may not unfurl properly.

Figure . Buggy-whipping symptom from carryover of PPO herbicides to corn.via https://www.pioneer.com/home/site/us/agronomy/library/herbicide-carryover/
What About Safeners?
Products like DUAL II Magnum herbicide contain the safener benoxacor which has been shown to enhance S- Metolachlor metabolism in corn. This enhanced metabolism can reduce the potential of S- Metolachlor injury to corn seedlings when grown under unfavorable weather conditions such as cool temperature or water stress. However, a safener is not the silver bullet, and slow plant growth may still have trouble metabolizing the herbicide even with a safener…but it does help the severity of damage/symptoms.
Will The Plants Recover?
Plants that have leafed out underground or show corkscrewed mesocotyl symptoms are likely to not recover or even emerge from below the soil. Larger plants that are already emerged that show tightly rolled leaves and are buggy whipped will most likely recover once the field sees drier conditions and we have warm weather and sun light to assist in better plant growth.
More Information Discussing Corn Injury From Pre-emerge Herbicides Here:
Cody Daft
Pioneer Hi-Bred
cody.daft@pioneer.com
