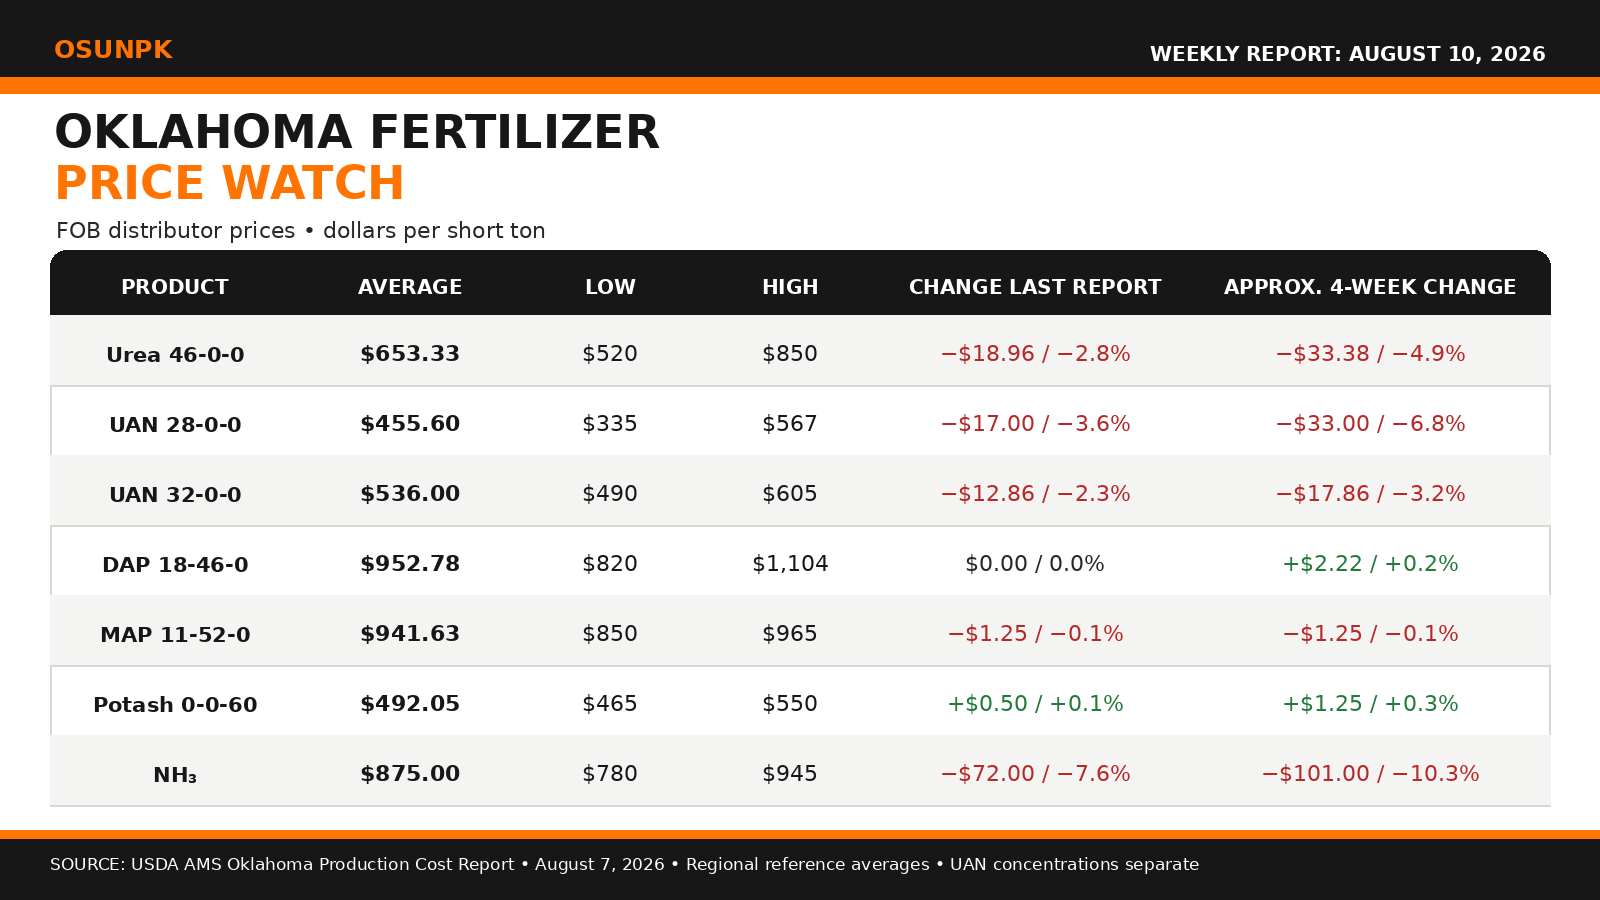
Nitrogen prices continued to decline in Oklahoma during the past two weeks, led by anhydrous ammonia. The statewide NH₃ reference fell $72 per ton to $875, while urea and both UAN concentrations also declined. The four-week decrease now exceeds 10% for NH₃ and approaches 7% for UAN 28. Phosphate and potash prices, meanwhile, have changed very little.
The Oklahoma average, minimum and maximum prices shown in the accompanying graphic come from the USDA AMS Oklahoma Production Cost Report. USDA collects FOB asking prices from Oklahoma distributors but does not identify the contributing dealers or disclose the number of observations. Public cash quotes from named dealers, including Two Rivers Cooperative, are tracked separately and are not blended into the USDA regional statistics.
The immediate Oklahoma explanation for softer nitrogen prices is relatively straightforward: hot, dry conditions have slowed fertilizer movement. USDA reported reduced demand across the fertilizer market, with triple-digit temperatures accelerating corn dry-down and allowing harvest to begin in parts of the state. With limited field activity and the primary summer application season behind us, dealers have less nearby demand supporting nitrogen values.
International nitrogen conditions are also becoming less restrictive. Fertilizer-market analyst Josh Linville reported that urea values continue to face pressure from weaker demand and a second round of approved Chinese exports. Additional Chinese availability matters because it gives international buyers another major supply origin and reduces competition for other export tons.
Nutrien’s second-quarter results reinforce the mixed nature of the nitrogen market. Global nitrogen benchmarks remained elevated, but second-quarter nitrogen sales volumes were lower. The market will now be watching whether increased export availability is sufficient to offset upcoming fall demand and additional international purchasing.
Phosphate remains a different story. Oklahoma DAP was unchanged during the latest reporting period, while MAP declined only $1.25 per ton. Stable local prices should not be interpreted as evidence that upstream supply risks have disappeared. Linville reported that Moroccan TSP and MAP are moving toward North America, which could improve regional availability. However, phosphate production continues to face elevated sulfur and ammonia costs and limited export availability from some traditional suppliers. These factors may support replacement costs even while weak seasonal demand keeps Oklahoma prices from moving higher.
Potash remains the most stable major nutrient. Oklahoma’s reported average increased only 50 cents per ton. Nutrien reported higher global potash benchmarks and record first-half sales volumes, but it also reported record production. Strong supply performance helps explain why firm global demand has not produced a significant Oklahoma price movement.
For Oklahoma producers, the most important development is the continued separation between nitrogen and phosphate markets. Lower nitrogen quotes may create purchasing opportunities, but the wide reported ranges make direct comparisons essential. Phosphate prices are locally steady but remain exposed to sulfur, ammonia and import-supply risks. Confirm the cash price, nutrient analysis, pickup or delivery basis, quote expiration and application charges before comparing dealer offers.
Fertilizer markets, local prices and product availability can change quickly. Confirm all prices and terms with local dealers before making purchasing decisions.
**The Oklahoma average, minimum and maximum prices shown in the accompanying graphic come from the USDA AMS Oklahoma Production Cost Report. USDA collects FOB asking prices from Oklahoma distributors but does not identify the contributing dealers or disclose the number of observations. Public cash quotes from named dealers, including Two Rivers Cooperative, are tracked separately and are not blended into the USDA regional statistics.
Market Sources
- USDA Agricultural Marketing Service. Oklahoma Production Cost Report. August 7, 2026. https://www.ams.usda.gov/mnreports/ams_3621.pdf
- Linville, Josh. Fertilizer-market commentary. August 7, 2026. https://x.com/JLinvilleFert
- Nutrien. Nutrien Reports Second Quarter 2026 Results. August 5, 2026. https://www.nutrien.com/news/press-releases/nutrien-reports-second-quarter-2026-results-1753
- Reuters. Nutrien Misses Profit Estimates as Lower Volumes Blunt Higher Fertilizer Prices. August 6, 2026. https://www.reuters.com/world/americas/nutrien-misses-profit-estimates-lower-volumes-blunt-higher-fertilizer-prices-2026-08-06/
- Two Rivers Cooperative. Fertilizer Index. Accessed August 10, 2026. https://www.tworiversks.coop/pages/custom.php?id=19995
This report is produced via Chat GPT Plus Work, with review by Brian Arnall.
 Down and Dirty with NPK