During January and February I spent a lot of time on the road giving precision ag and wheat yield / protein talks. One thing about giving the same talk multiple times and spending countless hours on the road, about 70, is the time you have to think about the little things in your talk. This time around it was the slide below. The graph is from the 502 Long Term Fertility study located in Lahoma OK. When I first put the slide together in 2016 the purpose was to show how the yield and optimum fertilizer rate is extremely varied. I went in to the 55 plus years of yield data and pulled out the past ten years and identified the nitrogen treatment, only those with full P and K fertility, that economically maximized yield each year. With the graph I was able to show how the nitrogen rate required to maximize yield changes dramatically each year and where the amount of N was not directly correlated with yield. But after showing this graph a few times I thought that added lbs of N per bushel would help me highlight the point about changing N demand. That’s the blue numbers below each year. And of course out of curiosity I averaged the numbers. The ten year average was 1.5 lbs of N, which would suggest over a ten year period you would need to apply 120% of the N removed to optimize profit.

Selected data from the long term winter wheat study locate in Lahoma, Oklahoma. Study consist of a range of nitrogen, phosphorus, and potassium rates and combinations. The orange bar the grain yield of the plot with the economic optimum yield and the black bar is the N rate associated with the yield. The blue values on the bottom is the lbs of N required per bushel.
The 1.5 lbs per bushel over time was an important number. Not long before I had reached out to half of dozen producers that I have spent at least 5 years with working on their N management. My question to them, what was your average yield and average N rate over all your fields and years. Turns out that most of these producers who were using N-Rich strips and making 2 or 3 trips over the field were averaging 1.5-1.6 lbs N per bushel of wheat produced across a farm. Of course when they told me this I was excited, that’s such an improvement over 2.0 lbs of N per bushel.
The real thought came with me combining these two independent tid bits. Can we provide a Nitrogen Management Report Card if we look at several years of yield history? Let me preface what is presented below is not a scientifically tested or proved concept, yet. The more I think about it the more I am beginning to think that YES we can do a beneficial postmortem analysis. This is not a 1 year analysis, in fact based on the long term data I have been looking at there needs to be 5 years of data per field evaluated. I also strongly contend that this is a by field process. This will provide the opportunity to look at management over a broad spectrum of soil types and weather.
The calculation for lbs of N per bushel is not tough. In a continuous grain only winter wheat system you would add up the amount of nitrogen applied per acre over the period you are evaluating. Sum up the annual average grain yield and multiple that value by 1.3. Divide the total N applied by the total N removed per acre. This will be a decimal value, to compare with the tables below multiple by 100 to get a percent. Based on the long-term trials there needs to be at minimum five years of data. But the more the better.
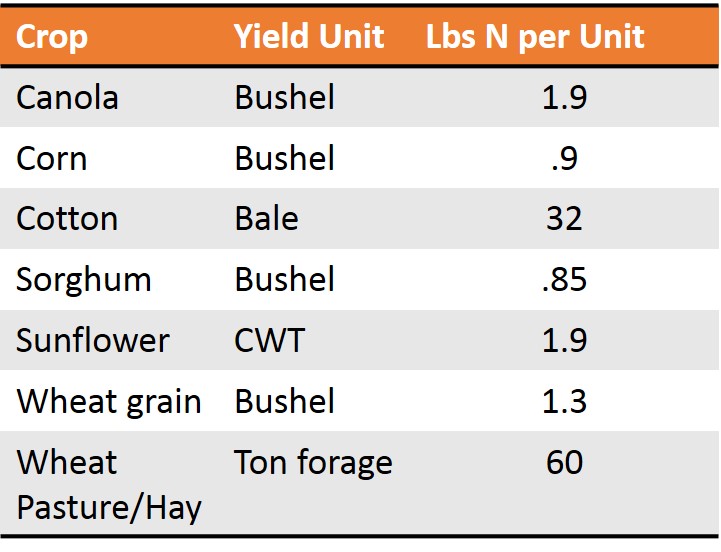
Pounds of nitrogen removed per one unit of yield harvested. These values are generalized averages and can change based on environment, management, and cultivar.
I would like to reiterate the grades provided below were not developed from any given data set. The report comments are of my own opinion. I do hope in the near future to utilize the Oklahoma State University long-term fertility studies to refine these tables.

The Nitrogen Management Report Card for a continuous winter wheat grain only system. The first column is lbs of N per bushel, the second column is the percent of nitrogen applied per pound removed. The last column is the report on your nitrogen management strategy.
For a field with a crop rotation the way to calculate is the same you will just need to go into each harvest and multiple yield by the N in the crop, then sum up those values.

The Nitrogen Management Report Card for a Crop Rotation that does not include a legume. The first column is the percent of nitrogen applied per pound removed. The last column is the report on your nitrogen management strategy.
For a field with a crop rotation with legume (or cover crop), I have adjusted the grade scale with the assumption less total N will be needed due to the addition of N fixed by the legumes.

The Nitrogen Management Report Card for a Crop Rotation including a Legume. Legume nitrogen removal is not accounted for however grades are changed assuming some level of nitrogen fixation. The first column is the percent of nitrogen applied per pound removed. The last column is the report on your nitrogen management strategy.
Hopefully with concept will give you a different way to evaluate your N management strategies. This will not and cannot tell you what you need to apply next year. I mean just look at the data from Lahoma, from 2011 to 2015 optimum N rate ranged from 0 to 100 lbs N pre acre and N per bushel grown ranged from 0 to 2.2. Also as you look at the charts, understand that if you follow the old rule of thumbs 2.0 lbs N per bushel winter wheat and 1.2 lbs N per bushel for corn and sorghum, you are likely in the RED. These values are not that wrong for yield goal, 100% preplant application nitrogen management strategy. It is just with today technology, equipment, and agronomic practices we can do a lot better.
My final recommendations/comments would be:
1) If you are in the greens and yellows you are overall doing well. However there is always room for improvement. Are you currently accounting for the temporal variability in N demand, how about the spatial variability?
2) If you are in the orange and reds on the low side, are you there because you are underestimating yield or you are applying less because of grain prices?
There is likely money to be made by increasing yields with a little more nitrogen in these fields.
3) If you are in the orange and reds on the high side, are you there because you are consistently overestimating yield? Perhaps your yield estimation is not off but your lbs of N per bushel value is too high? Are you applying all of your N pre-plant. This practice is the most inefficient way, in terms of N use efficiency, to fertilize.
Questions or comments?
Please feel free to reach out to me via email or phone.
b.arnall@okstate.edu 405-744-1722

[…] we remove 150 pounds of N in grain, feed, or fiber. In other words 1 lb in and 1 lb out. My blog Nitrogen Management Report Card takes a look at nitrogen use […]